
Education Indicators in Canada: An International Perspective 2017
Chapter E
Participation in formal and/or non-formal education

Archived Content
Information identified as archived is provided for reference, research or recordkeeping purposes. It is not subject to the Government of Canada Web Standards and has not been altered or updated since it was archived. Please "contact us" to request a format other than those available.
E1 Insights from the Programme for the International Assessment of Adult Competencies (PIAAC)
Context
This indicator is based on data from the Programme for the International Assessment of Adult Competencies (PIAAC), a household study conducted under the auspices of the Organisation for Economic Co-operation and Development (OECD). In Education at a Glance 2017: OECD Indicators and other OECD publications, PIAAC is referred to as the “Survey of Adult Skills.”
PIAAC’s aim was to assess key cognitive and workplace skills needed for successful participation in 21st Century society and the global economy. The study measured cognitive skills in the areas of literacy, numeracy, and problem-solving in technology-rich environments. It also included an extensive background questionnaire that provides information about a number of other skills and personal traits that are important to success.
Adult learning can play an important role in helping to develop and maintain key information processing skills, and to acquire other knowledge and skills throughout life. It is crucial to provide and ensure access to organised learning opportunities for adults beyond initial formal education, especially for workers who need to adapt to changes throughout their careers and who have difficulty achieving high labour market outcomes (OECD, 2013).
Lifelong learning can also contribute to non-economic goals, such as personal fulfilment, improved health, civic participation and social inclusion. Social integration requires that individuals have the basic skills and knowledge needed to exercise their rights and responsibilities as citizens and enjoy the benefits of community life. The large variation in adult learning activities and participation among OECD countries at similar levels of economic development suggests that there are significant differences in learning cultures, learning opportunities at work and adult-education systems (Borkowsky, 2013).
Observations

Data table for Chart E.1.1
| Men and women | Men | Women | |
|---|---|---|---|
| percent | |||
| New Zealand | 68 | 68 | 67 |
| Finland | 66 | 63 | 70 |
| Denmark | 66 | 64 | 69 |
| Sweden | 66 | 64 | 68 |
| Norway | 64 | 63 | 66 |
| Netherlands | 64 | 67 | 62 |
| United States | 59 | 59 | 59 |
| Canada | 58 | 59 | 58 |
| Singapore | 57 | 61 | 53 |
| England (UK) | 56 | 58 | 54 |
| Australia | 56 | 57 | 54 |
| Israel | 53 | 53 | 53 |
| Germany | 53 | 56 | 49 |
| Estonia | 53 | 48 | 57 |
| Ireland | 51 | 53 | 49 |
| Korea | 50 | 54 | 46 |
| Czech Republic | 50 | 53 | 46 |
| OECD | 50 | 51 | 48 |
| Flanders (Belgium) | 49 | 49 | 49 |
| Northern Ireland (UK) | 49 | 48 | 49 |
| Austria | 48 | 50 | 47 |
| Slovenia | 48 | 47 | 50 |
| Chile | 48 | 53 | 42 |
| Spain | 47 | 47 | 46 |
| Japan | 42 | 48 | 35 |
| France | 36 | 36 | 36 |
| Poland | 35 | 35 | 36 |
| Lithuania | 34 | 30 | 36 |
| Slovak Republic | 33 | 34 | 32 |
| Italy | 25 | 27 | 23 |
| Turkey | 23 | 29 | 16 |
| Greece | 20 | 22 | 19 |
| Russian FederationData table Note 1 | 20 | 16 | 23 |
| Jakarta (Indonesia) | 12 | 15 | 8 |
Sources: Table E.1.1, and Education at a Glance 2016: OECD indicators. |
|||
- Across OECD countries that participated in PIAAC, an average of 50% of all adults participated in formal and/or non-formal education in 2012/2015. Canada’s average participation rate was higher than the OECD’s at 58%. Among OECD and partner countries, the participation rates ranged from more than 60% in Denmark, Finland, the Netherlands, New Zealand, Norway, and Sweden to less than 30% in Greece, Italy, Jakarta (Indonesia), the Russian Federation, and Turkey.
- Canada’s participation rate was similar for women (58%) and men (59%) aged 25 to 64 years, which was higher than the OECD averages (48% and 51%, respectively).

Data table for Chart E.1.2
| Men and women | Men | Women | |
|---|---|---|---|
| percent | |||
| OECD | 50 | 51 | 48 |
| CAN | 58 | 59 | 58 |
| N.L. | 48 | 49 | 46 |
| P.E.I | 59 | 53 | 64 |
| N.S. | 60 | 62 | 58 |
| N.B. | 51 | 55 | 48 |
| Que. | 51 | 50 | 53 |
| Ont. | 60 | 61 | 60 |
| Man. | 62 | 64 | 61 |
| Sask. | 62 | 62 | 62 |
| Alta. | 64 | 69 | 58 |
| B.C. | 61 | 61 | 60 |
| Y.T. | 62 | 63 | 62 |
| N.W.T. | 60 | 56 | 64 |
| Nvt. | 44 | 41 | 47 |
|
Note: The bars representing Canada and the OECD are filled with a diagonal line pattern to make them easier to find. Sources: Table E.1.2, and Education at a Glance 2016: OECD indicators. |
|||
- The average participation rate in formal and/or non-formal education ranged from 44% to 64% across provinces and territories for men and women, 41% to 69% for men, and 46% to 64% for women.
- The participation rates in formal and/or non-formal education for both men and women were below the Canadian average (58%) in Newfoundland and Labrador, New Brunswick, Quebec, and Nunavut; however, in most provinces and territories, the participation rates for both men and women were above the Canadian average.

Data table for Chart E.1.3
| Neither formal nor non-formal education | Non-formal education only | Formal education only | Both formal and non-formal education | |
|---|---|---|---|---|
| percent | ||||
| 25 to 34 years | 30 | 43 | 11 | 16 |
| 35 to 44 years | 36 | 47 | 5 | 12 |
| 45 to 54 years | 43 | 48 | 2 | 7 |
| 55 to 64 years | 59 | 37 | 1 | 3 |
| Source: Table E.1.3 | ||||
- In Canada, participation rates in formal and/or non-formal education decreased with age, with adults aged 25 to 34 years having the highest rates at 70% and adults aged 55-64 having the lowest rates at 41%.
- While participation rates in non-formal education were similar for adults aged 25-34 to adults aged 45-54 years old (ranging from 43% to 48%, respectively), the rates for formal education only as well as both formal and non-formal education decreased steadily as age increased from the group of adults aged 25-34 years to the group of adults aged 55-64 years (from 11% to 1% and 16% to 3%, respectively).
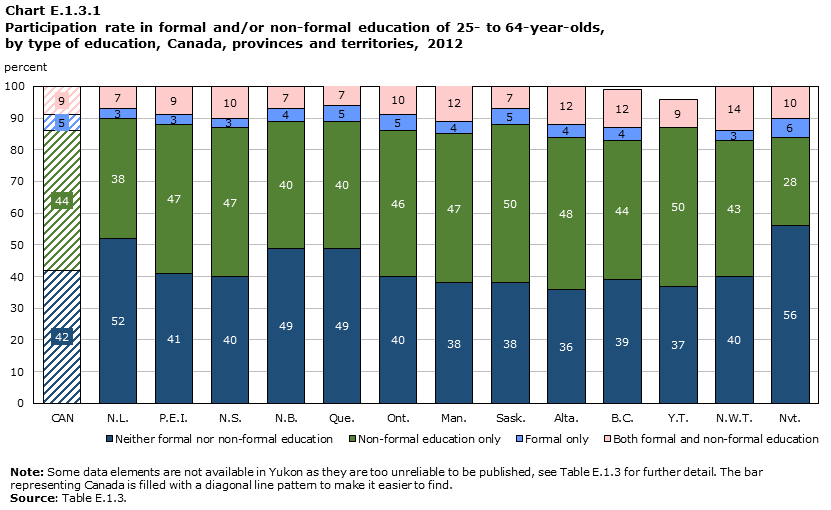
Data table for Chart E.1.3.1
| Neither formal nor non-formal education | Non-formal education only | Formal only | Both formal and non-formal education | |
|---|---|---|---|---|
| percent | ||||
| CAN | 42 | 44 | 5 | 9 |
| N.L. | 52 | 38 | 3 | 7 |
| P.E.I. | 41 | 47 | 3 | 9 |
| N.S. | 40 | 47 | 3 | 10 |
| N.B. | 49 | 40 | 4 | 7 |
| Que. | 49 | 40 | 5 | 7 |
| Ont. | 40 | 46 | 5 | 10 |
| Man. | 38 | 47 | 4 | 12 |
| Sask. | 38 | 50 | 5 | 7 |
| Alta. | 36 | 48 | 4 | 12 |
| B.C. | 39 | 44 | 4 | 12 |
| Y.T. | 37 | 50 | Note F: too unreliable to be published | 9 |
| N.W.T. | 40 | 43 | 3 | 14 |
| Nvt. | 56 | 28 | 6 | 10 |
|
F too unreliable to be published Note: Some data elements are not available in Yukon as they are too unreliable to be published, see Table E.1.3 for further detail. The bar representing Canada is filled with a diagonal line pattern to make them easier to find. Source: Table E.1.3. |
||||
- Of the 58% of Canadian adults who participate in formal education and/or non-formal education, the majority (44%) participated in non-formal education only, followed by participation in both forms of adult learning (9%), then participation in formal adult education only (5%).
- Across provinces and territories, the average participation rate in non-formal education ranged from 28% to 50% while participation in formal and non-formal education ranged from 7% to 14%, and for formal education only ranged from 3% to 6%.
- In Canada, 42% of adults aged 25 to 64 years did not participate in either formal or non-formal education. These non-participation rates were highest in Nunavut (56%), Newfoundland and Labrador (52%), New Brunswick (49%), and Quebec (49%), but lowest in Manitoba (38%), Saskatchewan (38%), Yukon (37%), and Alberta (36%).

Data table for Chart E.1.4
| Participants with young children | Participants without young children | |
|---|---|---|
| percent | ||
| OECD | 53 | 47 |
| CAN | 62 | 57 |
| DEU | 55 | 52 |
| FRA | 41 | 33 |
| ITA | 25 | 25 |
| JPN | 43 | 42 |
| UK | 59 | 55 |
| USA | 64 | 57 |
| N.L. | 61 | 43 |
| P.E.I | 58 | 59 |
| N.S. | 66 | 57 |
| N.B. | 60 | 48 |
| Que. | 61 | 47 |
| Ont. | 63 | 59 |
| Man. | 70 | 60 |
| Sask. | 65 | 61 |
| Alta. | 56 | 67 |
| B.C. | 61 | 60 |
| Y.T | 61 | 63 |
| N.W.T. | 59 | 61 |
| Nvt. | 45 | 42 |
|
1. Children under 13 years. Note: The bars representing Canada and the OECD are filled with a diagonal line pattern to make them easier to find. Sources: Table E.1.4, and Education at a Glance 2017: OECD indicators. |
||
- The presence of young children (under 13 years) appeared to be associated with differences in rates of participation in formal and non-formal learning. In Canada, the average participation rates in formal and/or non-formal education for adults aged 25-64 years was higher among adults with young children (62%) than those without young children (57%). These two averages were higher for their counterparts at the OECD average (53% and 47%, respectively) and all G7 countries with the exception of the United States.
- Across Canadian jurisdictions, with the exception of Prince Edward Island, Alberta, Yukon, and the Northwest Territories, adults aged 25 to 64 years with young children were more likely to participate in formal and/or non-formal education than adults aged 25 to 64 years without young children. This trend was consistent across most of the G7 and OECD countries.
- Among all provinces and territories, the largest difference in participation rates in formal and/or non-formal education between adults aged 25 to 64 years with and without young children was found in Newfoundland and Labrador at 18%.

Data table for Chart E.1.4.1
| Participants with young children | Participants without young children | Men with young children | Men without young children | Women with young children | Women without young children | |
|---|---|---|---|---|---|---|
| percent | ||||||
| OECD | 53 | 47 | 57 | 47 | 50 | 47 |
| CAN | 62 | 57 | 65 | 57 | 59 | 57 |
| N.L. | 61 | 43 | 65 | 43 | 56 | 43 |
| P.E.I | 58 | 59 | 52 | 54 | 64 | 64 |
| N.S. | 66 | 57 | 73 | 58 | 60 | 56 |
| N.B. | 60 | 48 | 65 | 51 | 56 | 44 |
| Que. | 61 | 47 | 61 | 46 | 61 | 49 |
| Ont. | 63 | 59 | 67 | 59 | 59 | 60 |
| Man. | 70 | 60 | 70 | 61 | 70 | 58 |
| Sask. | 65 | 61 | 72 | 58 | 59 | 63 |
| Alta. | 56 | 67 | 63 | 70 | 48 | 62 |
| B.C. | 61 | 60 | 64 | 60 | 59 | 61 |
| Y.T | 61 | 63 | 69 | 61 | 54 | 64 |
| N.W.T. | 59 | 61 | 56 | 56 | 62 | 66 |
| Nvt. | 45 | 42 | 49 | 33 | 42 | 53 |
|
1. Children under 13 years. Sources: Table E.1.4, and Education at a Glance 2017: OECD indicators. |
||||||
- In Canada, the participation rate in formal and/or non-formal education was higher for men aged 25 to 64 years with young children (65%) than women with young children (59%). However, the participation rates were the same for men and women without young children (57%).
- In Canada, the participation rates in formal and/or non-formal education between women aged to 25 to 64 years with young children (59%), and without young children (57%) were similar.
- In seven jurisdictions (Newfoundland and Labrador, Nova Scotia, New Brunswick, Ontario, Saskatchewan, British Columbia, and Yukon), men with young children had the highest rates of participation in formal and/or non-formal education (ranging from 64% to 73%).
- In two jurisdictions (Newfoundland and Labrador and Quebec) men and women without young children had the lowest rates of participation in formal and/or non-formal education (ranging from 43% to 49%).

Data table for Chart E.1.5
| No time because of child care or family responsibilities | Education/training was too expensive/I coud not afford it | I was too busy at work | I did not have the prerequisites | Lack of employer’s support | The course/programme was offered at inconvenient time/place | Something unexpected prevented me taking education/training | Other | |
|---|---|---|---|---|---|---|---|---|
| percent | ||||||||
| Canada | 17 | 19 | 30 | 2 | 6 | 12 | 3 | 12 |
| N.L. | 9 | 17 | 27 | Note F: too unreliable to be published | 9 | 20 | Note F: too unreliable to be published | 15 |
| P.E.I | 8 | 12 | 37 | Note F: too unreliable to be published | 5 | 16 | 5 | 13 |
| N.S. | 13 | 21 | 29 | Note F: too unreliable to be published | 7 | 12 | Note F: too unreliable to be published | 13 |
| N.B. | 12 | 20 | 26 | Note F: too unreliable to be published | 9 | 15 | Note F: too unreliable to be published | 13 |
| Que. | 21 | 14 | 25 | 2 | 5 | 13 | 4 | 16 |
| Ont. | 16 | 21 | 32 | 1 | 6 | 10 | 2 | 11 |
| Man. | 14 | 14 | 33 | Note F: too unreliable to be published | 7 | 11 | 4 | 16 |
| Sask. | 13 | 16 | 31 | Note F: too unreliable to be published | 6 | 17 | Note F: too unreliable to be published | 12 |
| Alta. | 13 | 15 | 33 | Note F: too unreliable to be published | 10 | 16 | Note F: too unreliable to be published | 8 |
| B.C. | 18 | 22 | 30 | Note F: too unreliable to be published | Note F: too unreliable to be published | 10 | 4 | 11 |
| Y.T | 9 | 9 | 42 | Note F: too unreliable to be published | Note F: too unreliable to be published | Note F: too unreliable to be published | Note F: too unreliable to be published | 9 |
| N.W.T. | 15 | 12 | 26 | Note F: too unreliable to be published | 10 | 14 | Note F: too unreliable to be published | 15 |
| Nvt. | 17 | 5 | 29 | Note F: too unreliable to be published | 9 | 16 | Note F: too unreliable to be published | 18 |
|
F too unreliable to be published Notes: Some data elements are not available as they are too unreliable to be published, see Table E.1.5 for further detail. The bar representing Canada is filled with a diagonal line pattern to make them easier to find. Source: Table E.1.5 |
||||||||
- Across all provinces and territories, the most commonly cited barrier to participation in formal and/or non-formal education among adults aged 25 to 64 years was being too busy at work, ranging from 25% in Quebec to 37% in Prince Edward Island.
- The second most commonly cited barrier to participation in formal and/or non-formal education was cost, ranging from 5% in Nunavut to 22% in British Columbia.
- In Canada, adults aged 25 to 64 years cited child care or family responsibilities as a barrier to participation in formal and/or non-formal education. These rates were highest in Quebec (21%) and British Columbia (18%), but lowest in Prince Edward Island (8%), Newfoundland and Labrador (9%), and Yukon (9%).

Data table for Chart E.1.5.1
| I was too busy at work | Education/training was too expensive/I could not afford it | No time because of child care or family responsibilities | |
|---|---|---|---|
| percent | |||
| Canada | 30 | 19 | 17 |
| OECD | 29 | 15 | 15 |
| FRA | 23 | 17 | 8 |
| DEU | 33 | 9 | 15 |
| ITA | 40 | 15 | 19 |
| JPN | 38 | 8 | 19 |
| USA | 28 | 23 | 17 |
| UK | 30 | 20 | 14 |
| Sources: Table E.1.5, and Education at a Glance 2017: OECD indicators. | |||
- In Canada, G7 countries, and OECD countries overall, the most commonly cited barrier to participation in formal and/or non-formal education among adults aged 25 to 64 years was being too busy at work, ranging from 23% in France to 40% in Italy.
- The second most commonly cited barrier to participation in formal and/or non-formal education for adults aged 25 to 64 years was cost, with this response being most common in the United States (23%), United Kingdom (20%), and then Canada (19%).
- In terms of child care or family responsibility being cited as a barrier to participation in formal and/or non-formal education among G7 countries, these rates were highest in Italy (19%), Japan (19%), United States (17%), and Canada (17%).
Definitions, sources and methodology
Programme for the International Assessment of Adult Competencies (PIAAC)
In Canada, PIAAC was conducted by Statistics Canada and made possible by the joint effort of the ministers of education of the provinces and territories, through the Council of Ministers of Education (Canada) [CMEC], and the Government of Canada, led by Employment and Skills Development Canada. The data collection took place from November 2011 to June 2012. The sample size for Canada was exceptionally large, at 27,285 individuals. This size was necessary to permit statistically reliable results at the provincial and territorial levels, as well as for certain populations within these jurisdictions.
PIAAC results included in Education at a Glance 2017: OECD Indicators are based on data from Round I (2012) and Round II (2015) countries. Round I OECD countries participating in PIAAC include Australia, Austria, Canada, Czech Republic, Denmark, England and Northern Ireland (UK), Estonia, Finland, Flanders (Belgium), France, Germany, Ireland, Italy, Japan, Korea, Netherlands, Norway, Poland, Slovak Republic, Spain, Sweden, and United States. Round II OECD countries participating in PIAAC include Chile, Greece, Israel, New Zealand, Slovenia, and Turkey. For this reason, the composition of the OECD average in PIAAC has changed from earlier publications of Education at a Glance and Education Indicators in Canada: An International Perspective.
For this report, tables based on PIAAC data have been organized into a single indicator, E1. The tables and charts represent a selection of results from PIAAC that are included in Education at a Glance 2017: OECD Indicators and Education at a Glance 2016: OECD Indicators. Not all EAG tables have been reproduced.
For definitions and background information about PIAAC in Canada, please refer to Skills in Canada: First Results from the Program for the International Assessment of Adult Competencies (PIAAC) or visit the PIAAC Web site.
For some data analysis, the sample is small, explaining why standard errors are slightly higher than usual. Data should, therefore, be interpreted with caution.
Age groups: Adults refers to 25-64 year-olds.
Education and training: Formal education is planned education provided in the system of schools, colleges, universities and other formal educational institutions that normally constitutes a continuous “ladder” of full-time education for children and young people. The providers may be public or private. Non-formal education is sustained educational activity that does not correspond exactly to the definition of formal education. Non-formal education may take place both within and outside educational institutions and cater to individuals of all ages. Depending on country contexts, it may cover education programmes in adult literacy, basic education for out-of-school children, life skills, work skills and general culture. The Survey of Adult Skills uses a list of possible non-formal education activities, including open or distance-learning courses, private lessons, organised sessions for on-the-job training, and workshops or seminars to prompt respondents to list all of their learning activities during the previous 12 months. Some of these learning activities might be of short duration.
Intensity of participation in non-formal education: The respondents were asked to estimate the total time they spent in non-formal education activities during the previous 12 months, by number of weeks, days or hours. Weeks and days were converted into hours.
- Date modified: