
Is undesirable answer behaviour consistent across surveys? An investigation into respondent characteristics
Section 4. Results
In this section, we first show the Cliff’s Delta’s for all surveys together as if they were one large survey. Second, we consider the Cliff’s Delta’s per survey to give an indication about UAB consistency across surveys to answer our research question. All Cliff’s Delta’s are obtained by comparing each category profile to the combined profile of the remaining categories. For instance, this means that the profile for respondents aged 15-24 are compared to the profile for the respondents from all other age categories. We chose for this type of comparison, as we are interested in whether a specific subgroup deviates from the complete sample of respondents, considered representative regarding age and education, minus that subgroup.
First, we need to note that respondents varied in the number of surveys they filled out. Some respondents filled out only one or two surveys, while others filled out all or almost all surveys. Behaviour data for every survey that the respondent filled out were used for the analyses. For instance, if a respondent filled out the surveys Health, Income, and Personality, this respondent is included in the data analyses for all these surveys. Second, respondents are classified in one category for both age and education. This means that a respondent can be older than 64 years and highly educated, and is included in the data analyses for both characteristics. Hence, respondents are included in each survey and characteristic analysis that is applicable to them. From this, it should be clear that we do not analyze individual respondents in this study, but that we focus on groups of respondents sharing the same characteristic. The reason is that we want to relate UAB to characteristics that are known from the literature to affect UAB, rather than to isolate individuals and explore potentially related characteristics.
We consider an individual respondent profile based on less than five items non-informative and too imprecise to take into account. Therefore, for each respondent group profile, we only include respondents who filled out at least five items. This means that part of the respondents may be excluded from several subgroups for the analyses. As a result, the occurrence of UAB for a subgroup after excluding respondents may differ from the initial occurrence of UAB for that subgroup. Thus, after excluding respondents from a subgroup, the remainder of the subgroup may not be representative for the original subgroup anymore in terms of the initial UAB occurrence. Therefore, we used two criteria to guarantee the representativeness of each original subgroup: 1) Each subgroup consists of more than 30% of the number of respondents in the original group, and; 2) the UAB occurrence in each subgroup does not differ more than 0.02 from the original group’s UAB occurrence.
4.1 Exploring survey participation and respondents aged 65 or older
Before elaborating on the main results, we give the outcomes of a few explorations. First, we investigated to what extent frequency of survey participation may have differed between the various age and educational subgroups. See Table 4.1. The average number of surveys that was filled out per respondent overall is 7.6. The average number of surveys per educational subgroup appeared to be relatively high and not to differ much between subgroups. For the age subgroups however, it is evident that younger respondents filled out a lower number and older respondents a higher number of surveys on average.
| TOT | 15_24 | 25_34 | 35_44 | 45_54 | 55_64 | > 64 | |
|---|---|---|---|---|---|---|---|
| Age | 7.6 | 6.0 | 6.8 | 7.3 | 7.7 | 8.3 | 8.5 |
| (6,700) | (838) | (803) | (1,083) | (1,223) | (1,289) | (1,464) | |
| This is an empty cell | Primary | VMBO | HAVW | MBO | HBO | WO | |
| Education | 7.6 | 7.3 | 7.7 | 7.3 | 7.6 | 7.7 | 7.6 |
| (6,688) | (601) | (1,634) | (791) | (1,549) | (1,504) | (609) |
We used respondent profiles and Cliff’s Delta to explore whether the degree of participation made a difference in the occurrence of the specific UABs taking all surveys together. We split up the complete sample of panel respondents into a group who filled out at most eight surveys and a group who filled out at least nine surveys. See Table 4.2. It is clear that participation rate did not affect the occurrence of most UABs. Not surprisingly, respondents who participated in relatively few surveys showed relatively more “won’t tell”-answers. A second effect was relatively more straightlining in case of a lower participation rate.
| SD | PR | DK | ST | WT | AC | NE | EX | |
|---|---|---|---|---|---|---|---|---|
| At most eight vs. at least nine surveys | -0.09 | 0.07 | 0.08 | 0.14 Table 4.2 Note ~ | 0.29 Note * | -0.06 | 0.02 | -0.10 |
|
||||||||
Lastly, respondents aged 75 or older may be even more vulnerable to difficulty in cognitive processing and hence showing UAB than respondents aged 65-74. Therefore, we compared respondents aged 65-74 to respondents aged 75 or older on their group UAB proportion. See Table A.1 in Appendix A. Age subgroups did not or hardly differ for most UABs and surveys. Only regarding straightlining there were a few striking differences, but interestingly, these showed that respondents aged 75 or older expressed less straightlining than respondents aged 65-74. This means that we do not have a reason to split up the age subgroup of 65 years or older into two smaller subgroups.
4.2 Overall outcomes for Cliff’s Delta
The overall results for Cliff’s Delta concern the global picture for specific subgroups for all surveys taken together. We use the rules that indicates no effect, a small effect, a medium effect, and a large effect, as investigated by Vargha and Delaney (2000), see also Goedhart (2016). A subgroup is always compared to the aggregated total of all remaining applicable subgroups regarding the specific characteristic. See Table 4.3 for the Cliff’s Delta’s for all surveys taken together.
From Table 4.3, it is clear that subgroups for age and education differ in various forms of specific satisficing behaviours overall. Younger and lower educated respondents showed more “don’t know”-answers than older and higher educated respondents. Higher educated respondents showed more acquiescent, but less neutral responses than lower educated respondents. Younger respondents showed less extreme responses than respondents from other age categories. Respondents from the middle age categories showed more primacy responses than both younger and older respondents (see Graph 1 in Figure 4.1), while higher educated respondents showed more primacy responses than lower educated respondents. Respondents from the middle age categories showed more straightlining than older respondents, while higher educated respondents showed more straightlining than lower educated respondents. From Table 4.3, it is also evident that some subgroups for age and education differ for sensitivity-based answer behaviour overall. Younger respondents showed more “won’t tell”-answers than older respondents. Higher educated respondents showed more socially desirable responses (see Graph 2 in Figure 4.1), but less “won’t tell”-answers than lower educated respondents. In summary, overall satisficing and sensitivity-based behaviours are clearly present, in most cases particularly for the youngest, oldest, lowest educated, or highest educated respondent groups.
A present overall effect size for a specific category and UAB does not by definition mean a present effect size for various surveys; an overall effect size may exist without effect sizes for any surveys. The opposite may be true as well; an overall effect size may be absent, as positive and negative effect sizes for various surveys cancel each other out. In the following section, we investigate to what extent either positive or negative effect sizes consistently exist across surveys and answer our main research question.
| Satisficing Behaviour | Behaviour Based on Sensitive Content | |||||||
|---|---|---|---|---|---|---|---|---|
| DK | AC | NE | EX | PR | ST | SD | WT | |
| Age | 0.30 Note * | -0.06 | -0.02 | -0.15 Table 4.3 Note ~ | -0.24 Table 4.3 Note ~ | 0.00 | -0.04 | 0.25 Table 4.3 Note ~ |
| 1524 | (0.25, 0.35) | (-0.12, -0.00) | (-0.08, 0.04) | (-0.21, -0.10) | (-0.30, -0.18) | (-0.06, 0.07) | (-0.09, 0.01) | (0.20, 0.31) |
| Age | 0.11 Table 4.3 Note ~ | 0.05 | -0.06 | -0.08 | 0.08 | 0.12 Table 4.3 Note ~ | 0.02 | 0.09 |
| 2534 | (0.05, 0.16) | (-0.00, 0.11) | (-0.12, -0.00) | (-0.14, -0.02) | (0.03, 0.14) | (0.06, 0.17) | (-0.03, 0.08) | (0.04, 0.14) |
| Age | 0.08 | -0.01 | 0.03 | 0.01 | 0.13 Table 4.3 Note ~ | 0.19 Table 4.3 Note ~ | -0.02 | 0.08 |
| 3544 | (0.04, 0.13) | (-0.06, 0.04) | (-0.02, 0.07) | (-0.04, 0.06) | (0.08, 0.17) | (0.15, 0.24) | (-0.07, 0.02) | (0.03, 0.12) |
| Age | 0.02 | -0.04 | 0.01 | 0.04 | 0.13 Table 4.3 Note ~ | 0.11 Table 4.3 Note ~ | -0.01 | 0.02 |
| 4554 | (-0.02, 0.07) | (-0.09, 0.00) | (-0.04, 0.05) | (-0.01, 0.08) | (0.08, 0.17) | (0.07, 0.16) | (-0.05, 0.03) | (-0.02, 0.06) |
| Age | -0.15 Table 4.3 Note ~ | 0.03 | -0.02 | 0.06 | 0.06 | -0.12 Table 4.3 Note ~ | 0.02 | -0.06 |
| 5564 | (-0.19, -0.11) | (-0.01, 0.07) | (-0.06, 0.02) | (0.01, 0.10) | (0.03, 0.10) | (-0.16, -0.08) | (-0.02, 0.06) | (-0.10, -0.02) |
| Age | -0.20 Table 4.3 Note ~ | 0.02 | 0.04 | 0.05 | -0.17 Table 4.3 Note ~ | -0.22 Table 4.3 Note ~ | 0.02 | -0.17 Table 4.3 Note ~ |
| 65Ol | (-0.24, -0.16) | (-0.02, 0.06) | (0.00, 0.08) | (0.01, 0.09) | (-0.20, -0.13) | (-0.26, -0.18) | (-0.02, 0.06) | (-0.20, -0.14) |
| Edu | 0.20 Table 4.3 Note ~ | -0.13 Table 4.3 Note ~ | 0.14 Table 4.3 Note ~ | 0.03 | -0.21 Table 4.3 Note ~ | -0.14 Table 4.3 Note ~ | -0.13 Table 4.3 Note ~ | 0.08 |
| PRI | (0.14, 0.26) | (-0.19, -0.06) | (0.08, 0.20) | (-0.04, 0.10) | (-0.27, -0.15) | (-0.20, -0.07) | (-0.20, -0.08) | (0.02, 0.14) |
| Edu | 0.10 | -0.18 Table 4.3 Note ~ | 0.14 Table 4.3 Note ~ | 0.04 | -0.13 Table 4.3 Note ~ | -0.04 | -0.08 | 0.07 |
| VM | (0.06, 0.14) | (-0.22, -0.14) | (0.10, 0.18) | (-0.00, 0.08) | (-0.17, -0.09) | (-0.08, 0.00) | (-0.12, -0.04) | (0.04, 0.11) |
| Edu | 0.00 | 0.01 | -0.10 | -0.02 | 0.00 | -0.04 | -0.06 | 0.02 |
| HA | (-0.05, 0.06) | (-0.04, 0.06) | (-0.16, -0.05) | (-0.08, 0.03) | (-0.05, 0.06) | (-0.09, 0.02) | (-0.10, -0.01) | (-0.03, 0.07) |
| Edu | 0.07 | -0.04 | 0.05 | -0.02 | 0.02 | 0.05 | -0.02 | 0.08 |
| MB | (0.03, 0.11) | (-0.08, 0.00) | (0.01, 0.09) | (-0.07, 0.02) | (-0.02, 0.06) | (0.00, 0.09) | (-0.06, 0.02) | (0.04, 0.11) |
| Edu | -0.17 Table 4.3 Note ~ | 0.18 Table 4.3 Note ~ | -0.12 Table 4.3 Note ~ | -0.03 | 0.12 Table 4.3 Note ~ | 0.02 | 0.13 Table 4.3 Note ~ | -0.13 Table 4.3 Note ~ |
| HB | (-0.21, -0.13) | (0.14, 0.22) | (-0.16, -0.08) | (-0.07, 0.01) | (0.09, 0.16) | (-0.02, 0.06) | (0.10, 0.17) | (-0.16, -0.09) |
| Edu | -0.21 Table 4.3 Note ~ | 0.22 Table 4.3 Note ~ | -0.18 Table 4.3 Note ~ | 0.02 | 0.19 Table 4.3 Note ~ | 0.12 Table 4.3 Note ~ | 0.14 Table 4.3 Note ~ | -0.13 Table 4.3 Note ~ |
| WO | (-0.27, -0.16) | (0.16, 0.27) | (-0.23, -0.12) | (-0.04, 0.08) | (0.14, 0.24) | (0.07, 0.18) | (0.08, 0.19) | (-0.18, -0.08) |
|
||||||||

Description of Figure 4.1
Figure presenting the probability for all surveys of Primacy Responding according to age in Graph 1 and the probability for all surveys of Socially Desirable Responding in Graph 2. In Graph 1, we notice that there is less Primacy Responding for respondents aged 15-24 (black) and 65 or older (orange), and more Primacy Responding for respondents aged 35-44 (blue) and 45-54 (purple). In Graph 2, we notice that there is less Socially Desirable Responding for respondents who finished only primary school (black), and more Socially Desirable Responding for respondents who finished HBO (green) or WO (orange).
4.3 Consistency outcomes for Cliff’s Delta
These results for Cliff’s Delta concern the consistency of subgroups across surveys. To reveal consistency, we considered the number of surveys for which at least a small effect was the result. Considering consistency conservatively, as an at least small effect for a specific UAB and category for all or almost all applicable surveys, we would draw the conclusion that there is no consistency to be found: There is no consistent satisficing or sensitivity-based behaviour evident across surveys. See Table 4.4 containing all results for the UABs and categories for which more than half of the applicable surveys showed either positive or negative effect sizes: There is no category that shows an effect for all or almost all surveys for any UAB.
| FA | HE | HO | IN | PE | PO | RE | WO | ||
|---|---|---|---|---|---|---|---|---|---|
| Answering “Don’t Know” | Age | 0.09 | This is an empty cell | This is an empty cell | 0.46 Table 4.4 Note # | This is an empty cell | 0.28 Note * | 0.05 | 0.24 Table 4.4 Note ~ |
| 1524 | (0.05, 0.12) | (0.41, 0.51) | (0.22, 0.34) | (0.03, 0.07) | (0.19, 0.30) | ||||
| Age | This is an empty cell | This is an empty cell | -0.13 Table 4.4 Note ~ | -0.20 Table 4.4 Note ~ | This is an empty cell | -0.14 Table 4.4 Note ~ | -0.02 | This is an empty cell | |
| 65Ol | (-0.17, -0.09) | (-0.24, -0.16) | (-0.17, -0.10) | (-0.03, -0.01) | |||||
| Edu | 0.15 Table 4.4 Note ~ | This is an empty cell | 0.08 | 0.16 Table 4.4 Note ~ | This is an empty cell | 0.17 Table 4.4 Note ~ | 0.02 | 0.23 Table 4.4 Note ~ | |
| PRI | (0.08, 0.23) | (-0.00, 0.15) | (0.10, 0.23) | (0.11, 0.24) | (0.00, 0.05) | (0.15, 0.31) | |||
| Primacy Responding | Age | -0.36 Note * | -0.10 | This is an empty cell | -0.31 Note * | -0.18 Table 4.4 Note ~ | -0.11 Table 4.4 Note ~ | -0.09 | -0.05 |
| 1524 | (-0.40, -0.32) | (-0.13, -0.06) | (-0.37, -0.26) | (-0.24, -0.12) | (-0.17, -0.06) | (-0.14, -0.04) | (-0.09, -0.01) | ||
| Edu | 0.03 | -0.11 Table 4.4 Note ~ | This is an empty cell | -0.23 Table 4.4 Note ~ | -0.15 Table 4.4 Note ~ | -0.08 | -0.14 Table 4.4 Note ~ | -0.09 | |
| PRI | (-0.03, 0.09) | (-0.16, -0.06) | (-0.29, -0.17) | (-0.22, -0.08) | (-0.15, -0.01) | (-0.20, -0.09) | (-0.15, -0.04) | ||
| Edu | -0.10 | 0.06 | This is an empty cell | 0.18 Table 4.4 Note ~ | 0.18 Table 4.4 Note ~ | 0.03 | 0.16 Table 4.4 Note ~ | 0.24 Table 4.4 Note ~ | |
| WO | (-0.14, -0.05) | (0.02, 0.10) | (0.12, 0.24) | (0.12, 0.24) | (-0.02, 0.09) | (0.11, 0.21) | (0.19, 0.28) | ||
| Neutral Responding | Edu | 0.05 | This is an empty cell | This is an empty cell | -0.14 Table 4.4 Note ~ | -0.16 Table 4.4 Note ~ | -0.18 Table 4.4 Note ~ | This is an empty cell | -0.04 |
| WO | (0.01, 0.10) | (-0.20, -0.09) | (-0.23, -0.09) | (-0.23, -0.13) | (-0.09, -0.00) | ||||
|
|||||||||
Therefore, for each UAB and category, we considered the number of surveys for which at least a small either positive or negative effect was found. See Table 4.5. It is striking that relatively many cells or category-UAB pairs showed both positive and negative effects (marked by “2” in Table 4.5). This means that a category may show more of a specific UAB for some surveys, while less for other surveys. For instance, consider the category 15-24 years for the UAB answering “won’t tell” (WT) in Table 4.5. Here, this age category showed more “won’t tell”-answers than the other categories combined for one survey, while less “won’t tell”-answers for another survey. For a more liberal perspective on consistency, we elaborate on the cases for which more than half of the applicable surveys showed either positive or negative effect sizes (see Table 4.4). Strikingly, this is applicable to only seven out of the 96 possible cases (as we have results for eight UABs and twelve categories) and at a maximum of only 75% of the applicable surveys.
| Number of Surveys | 3 | 5 | 4/5 | 4/5 | 4/5/6 | 6/7 | 7 | 8 | |
|---|---|---|---|---|---|---|---|---|---|
| Answer Behaviour | WT | AC | NE | EX | DK | ST | PR | SD | |
| Age | 15-24 years | 2 | This is an empty cell | This is an empty cell | This is an empty cell | 1 | 2 | 1 | 2 |
| 25-34 years | This is an empty cell | This is an empty cell | This is an empty cell | This is an empty cell | This is an empty cell | 2 | 2 | 2 | |
| 35-44 years | This is an empty cell | This is an empty cell | This is an empty cell | This is an empty cell | This is an empty cell | 1 | 2 | 2 | |
| 45-54 years | This is an empty cell | This is an empty cell | This is an empty cell | This is an empty cell | This is an empty cell | 1 | 1 | This is an empty cell | |
| 55-64 years | This is an empty cell | This is an empty cell | This is an empty cell | This is an empty cell | 1 | This is an empty cell | This is an empty cell | 2 | |
| 65 years or older | This is an empty cell | This is an empty cell | This is an empty cell | This is an empty cell | 1 | 1 | 2 | 2 | |
| Edu | Primary education | This is an empty cell | 1 | 1 | This is an empty cell | 1 | This is an empty cell | 1 | 2 |
| VMBO | This is an empty cell | 1 | This is an empty cell | This is an empty cell | This is an empty cell | This is an empty cell | 2 | 2 | |
| HAVWO | This is an empty cell | This is an empty cell | This is an empty cell | This is an empty cell | This is an empty cell | This is an empty cell | This is an empty cell | 2 | |
| MBO | This is an empty cell | This is an empty cell | This is an empty cell | This is an empty cell | This is an empty cell | This is an empty cell | This is an empty cell | This is an empty cell | |
| HBO | This is an empty cell | 1 | This is an empty cell | This is an empty cell | 1 | This is an empty cell | 1 | 1 | |
| WO | This is an empty cell | This is an empty cell | 1 | 2 | 1 | 1 | 1 | 2 | |
|
|||||||||
For the UAB answering “don’t know”, Table 4.4 shows that respondents 15-24 years of age gave more “don’t know”-answers and respondents of 65 years or older gave less “don’t know”-answers than other respondents for multiple surveys (see Graphs 1 through 4 in Figure 4.2). Respondents who finished only primary education gave more “don’t know”-answers than other respondents for various surveys. For primacy responding, we found that respondents 15-24 years of age or who finished only primary education chose less early response options than other respondents for multiple surveys. Respondents who finished the highest educational level chose more early response options and less neutral responses than other respondents for various surveys.
In summary, the results refer to an absence of UAB consistency across all or almost all surveys: Both satisficing and sensitivity-based UABs did not emerge consistently across surveys. We conclude that respondents’ UAB across surveys may be more influenced by the survey and its topic and items than solely by the age or educational level of the respondent. We close with a discussion in the following section.
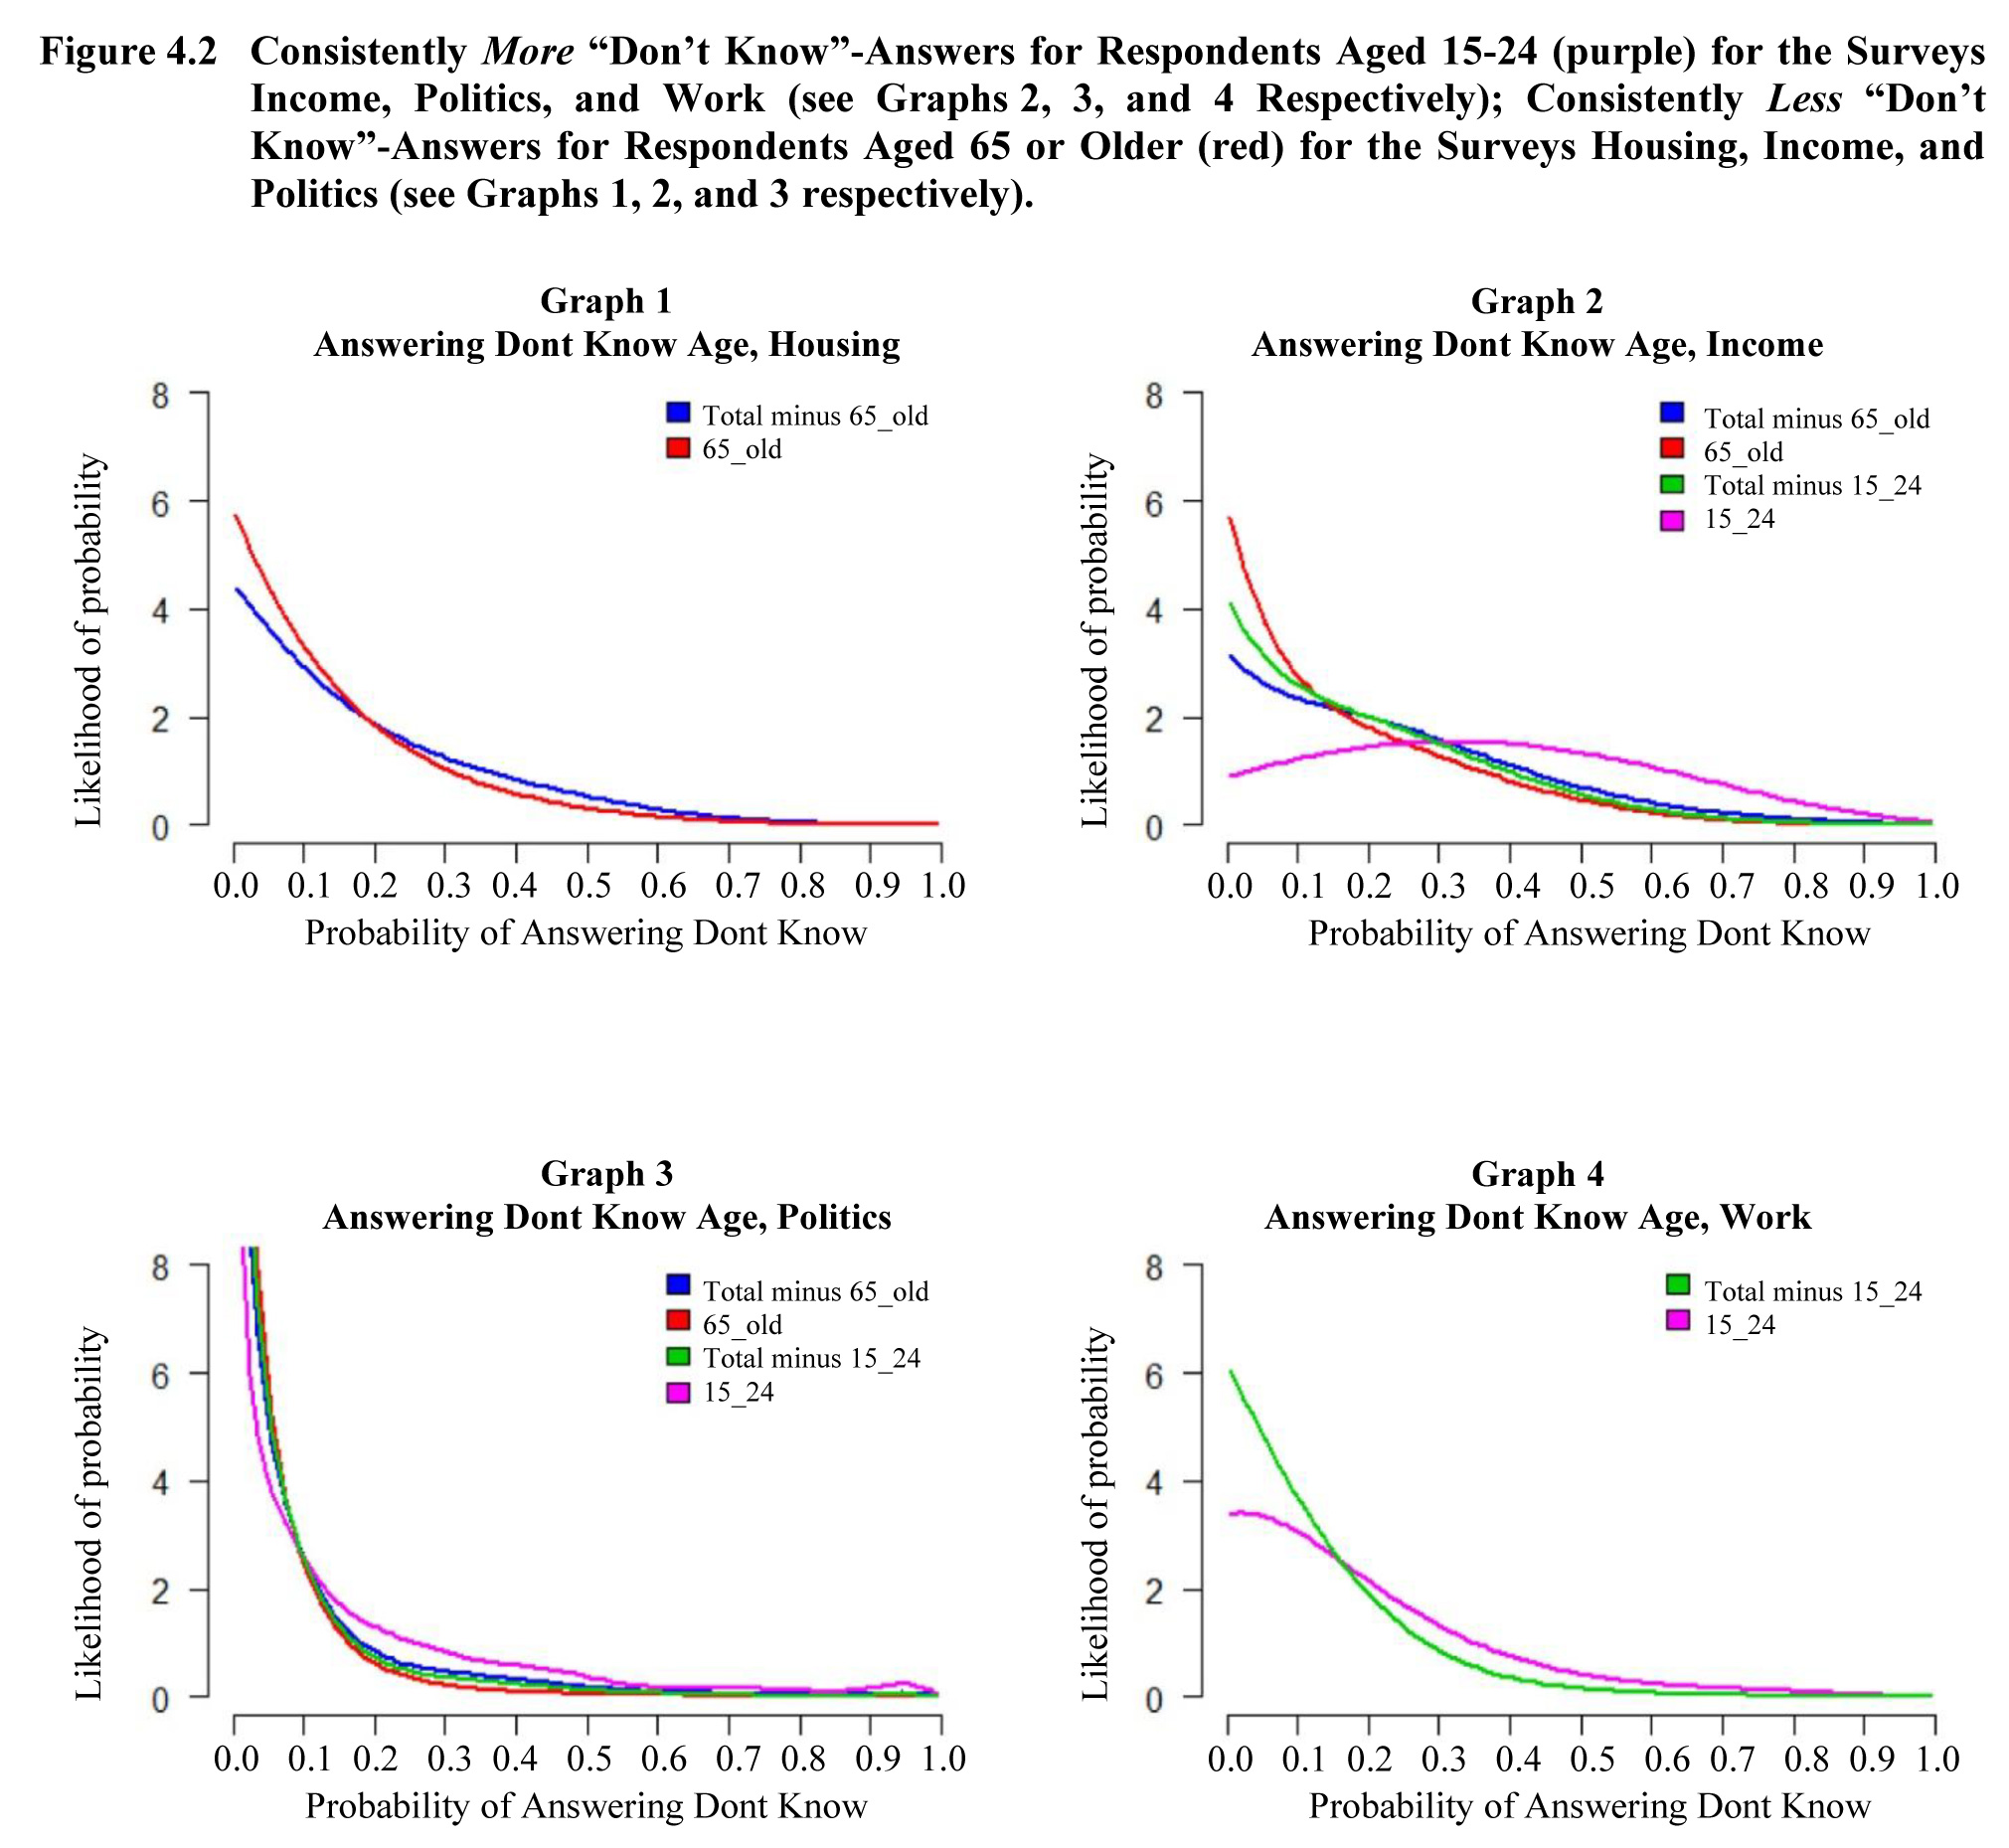
Description of Figure 4.2
Figure presenting the probabilities of answering “Don’t Know” for the surveys on Housing (Graph 1), Income (Graph 2), Politics (Graph 3), and Work (Graph 4) according to the age groups “Total minus aged 65 and older” in blue, “Aged 65 and older” in red, “Total minus aged 15-24” in green, and “Aged 15-24” in purple. We notice consistently more “Don’t Know”-answers for respondents aged 15-24 (purple) for surveys on Income, Politics, and Work (see Graphs 2, 3, and 4 respectively); and consistently less “Don’t Know”-answers for respondents aged 65 or older (red) for surveys on Housing, Income, and Politics (see Graphs 1, 2, and 3 respectively).
- Date modified: