
Is undesirable answer behaviour consistent across surveys? An investigation into respondent characteristics
Section 2. Theoretical framework
Cognitive ability may be considered a stable personal characteristic that has its influence on UAB (Krosnick, 1991, 1999; Krosnick et al., 1996). For our study, we consider the respondent characteristics age and educational level as proxies for cognitive ability to investigate its relation to specific UAB. Both age and educational level have been shown to be related to UAB and hence survey data quality (Krosnick, 1991, 1999; Krosnick et al., 1996). Older and lower educated respondents show less accurate UAB than younger respondents (Andrews and Herzog, 1986) and higher educated respondents (Antoni, Bela and Vicari, 2019), and a less stable attitude reliability measurement than younger and higher educated respondents (Alwin and Krosnick, 1991). See Table 2.1 for an overview of the age and educational categories as used in this study, and relevant literature.
In this study, we include two overarching kinds of UAB: Satisficing behaviour, and behaviour that is based on sensitive content. Satisficing behaviour refers to taking short-cuts in the question-answering process. Satisficing is positively related to item difficulty and can be the outcome of low cognitive ability (Heerwegh and Loosveldt, 2011; Krosnick, 1991, 1999; Krosnick et al., 1996). As a result of satisficing, respondents may show one of the following six specific UABs: Answering “don’t know”, acquiescence, neutral responding, extreme responding, primacy responding, and straightlining. See Table 2.2 for the meaning of these UABs and their relevant literature.
UAB can also be the result of sensitive survey content. Such UAB is positively related to item sensitivity and may be the outcome of a lack of willingness from the respondent to give a true answer (Bradburn, Sudman, Blair and Stocking, 1978; Shoemaker, Eichholz and Skewes, 2002; Tourangeau et al., 2000). Sensitive items may involve a threat of disclosure (Lensvelt-Mulders, 2008) or can be experienced as intrusive (Tourangeau et al., 2000; Tourangeau and Yan, 2007). As a result of sensitive content, respondents may give one of the following two specific UABs: Socially desirable responding and answering “won’t tell”. Note that “socially desirable responding” is in fact undesirable because of its relation to measurement error (see for instance DeMaio, 1984; Heerwegh and Loosveldt, 2011). See Table 2.2 for the meaning of the UABs and relevant literature. See Figure 2.1 for the complete theoretical framework.
We need to emphasize that most of the specific UABs in this study are referred to in some literature as “response styles” (see for instance He and Van de Vijver, 2013; He, Van de Vijver, Espinosa and Mui, 2014; Van Herk, Poortinga and Verhallen, 2004; Van Rosmalen, Van Herk and Groenen, 2010). We deliberately do not use the concept of response style throughout this paper. The goal of this study is to investigate whether groups of respondents express a stable and consistent pattern or style of specific UAB across surveys. This means that we need to avoid confusing “response style” as a UAB with “style” as a consistent pattern that groups may show across surveys. Therefore, we distinguished between the UAB itself and the pattern or style of UAB across surveys that we are actually expecting to find.
| Respondent characteristic | Categories of the respondent characteristics in this study | Selected relevant literature |
|---|---|---|
| Age | 1. 15-24 years old | Alwin and Krosnick (1991); Andrews and Herzog (1986); Greenleaf (1992); He, Van de Vijver, Espinosa and Mui (2014); Hox et al. (1991); Kieruj and Moors (2013); Meisenberg and Williams (2008); O’Muircheartaigh, Krosnick and Helic (2000); Pickery and Loosveldt (1998); Schonlau and Toepoel (2015); Zhang and Conrad (2014) |
| 2. 25-34 years old | ||
| 3. 35-44 years old | ||
| 4. 45-54 years old | ||
| 5. 55-64 years old | ||
| 6. 65 years and older | ||
| Education | 1. primary school | Aichholzer (2013); Alwin and Krosnick (1991); Greenleaf (1992); He et al. (2014); Krosnick (1991); Krosnick and Alwin (1987); Krosnick, Holbrook, Berent, Carson, Hanemann, Kopp, Mitchell, Presser, Ruud, Smith, Moody, Green and Conaway (2002); Marín, Gamba and Marín (1992); McClendon (1986, 1991); Narayan and Krosnick (1996); O’Muircheartaigh et al. (2000); Pickery and Loosveldt (1998); Schuman and Presser (1981); Zhang and Conrad (2014) |
| 2. vmbo: intermediate secondary education | ||
| 3. havo/vwo: higher secondary education | ||
| 4. mbo: intermediate vocational education | ||
| 5. hbo: higher vocational education | ||
| 6. wo: university |
| Answer Behaviour | Meaning of the Answer Behaviour | Selected Relevant Literature for the Answer Behaviour |
|---|---|---|
| Socially Desirable Responding | The tendency to minimize showing socially undesirable behaviour. | Andersen and Mayerl, 2019; Campanelli, Nicolaas, Jäckle, Lynn, Hope, Blake and Gray, 2011; DeMaio, 1984; Heerwegh and Loosveldt, 2011; Holbrook et al., 2003; Jann, Krumpal and Wolter, 2019; Johnson and Van de Vijver, 2003; Kreuter, Presser and Tourangeau, 2008; Krosnick, 1999; Paulhus, 2002; Roberts, 2007; Roberts and Jäckle, 2012; Tourangeau et al., 2000; Tourangeau and Yan, 2007 |
| Answering “Don’t Know” and “Won’t Tell” | The tendency to give a “don’t know”- or a “won’t tell”- answer to a question. | Beatty and Herrmann, 2002; Binswanger, Schunk and Toepoel, 2013; Bishop, Tuchfarber and Oldendick, 1986; Bradburn et al., 1978; Fricker, Galesic, Tourangeau and Yan, 2005; Krosnick et al., 2002; Leigh and Martin, 1987; Roberts, 2007; Roßmann, Gummer and Silber, 2017; Schuman and Presser, 1981; Shoemaker et al., 2002; Tourangeau et al., 2000; Vis-Visschers, Arends-Tóth, Giesen and Meertens, 2008 |
| Acquiescence | The tendency to answer affirmatively, regardless of the content of the question. | Billiet and McClendon, 2000; De Leeuw, 1992; Díaz de Rada and Domínguez, 2015; Heerwegh and Loosveldt, 2011; McClendon, 1991; Messick, 1966; O’Muircheartaigh et al., 2000; Saris, Revilla, Krosnick and Shaeffer, 2010; Schaeffer and Presser, 2003; Stricker, 1963 |
| Neutral Responding | The tendency to choose the neutral midpoint category from a bipolar answering scale. | He and Van de Vijver, 2013; Kalton, Roberts and Holt, 1980; Krosnick and Fabrigar, 1997; O’Muircheartaigh et al., 2000; Si and Cullen, 1998; Stern, Dillman and Smyth, 2007; Tarnai and Dillman, 1992 |
| Extreme Responding | The tendency to choose an extreme category from the answering scale. | Aichholzer, 2013; De Leeuw, 1992; Díaz de Rada and Domínguez, 2015; Ye, Fulton and Tourangeau, 2011 |
| Primacy Responding | The tendency to choose an option at the beginning of an answering list. | Galesic, Tourangeau, Couper and Conrad, 2008; Krosnick, 1991; Krosnick, 1992; Krosnick and Alwin, 1987; McClendon, 1991; Stern et al., 2007 |
| Straightlining | The tendency to give the same answers to a series of questions arranged in a grid format. | Díaz de Rada and Domínguez, 2015; Fricker et al., 2005; Krosnick, 1991; Krosnick and Alwin, 1989; Roßmann et al., 2017; Schonlau and Toepoel, 2015; Zhang, 2013; Zhang and Conrad, 2014 |
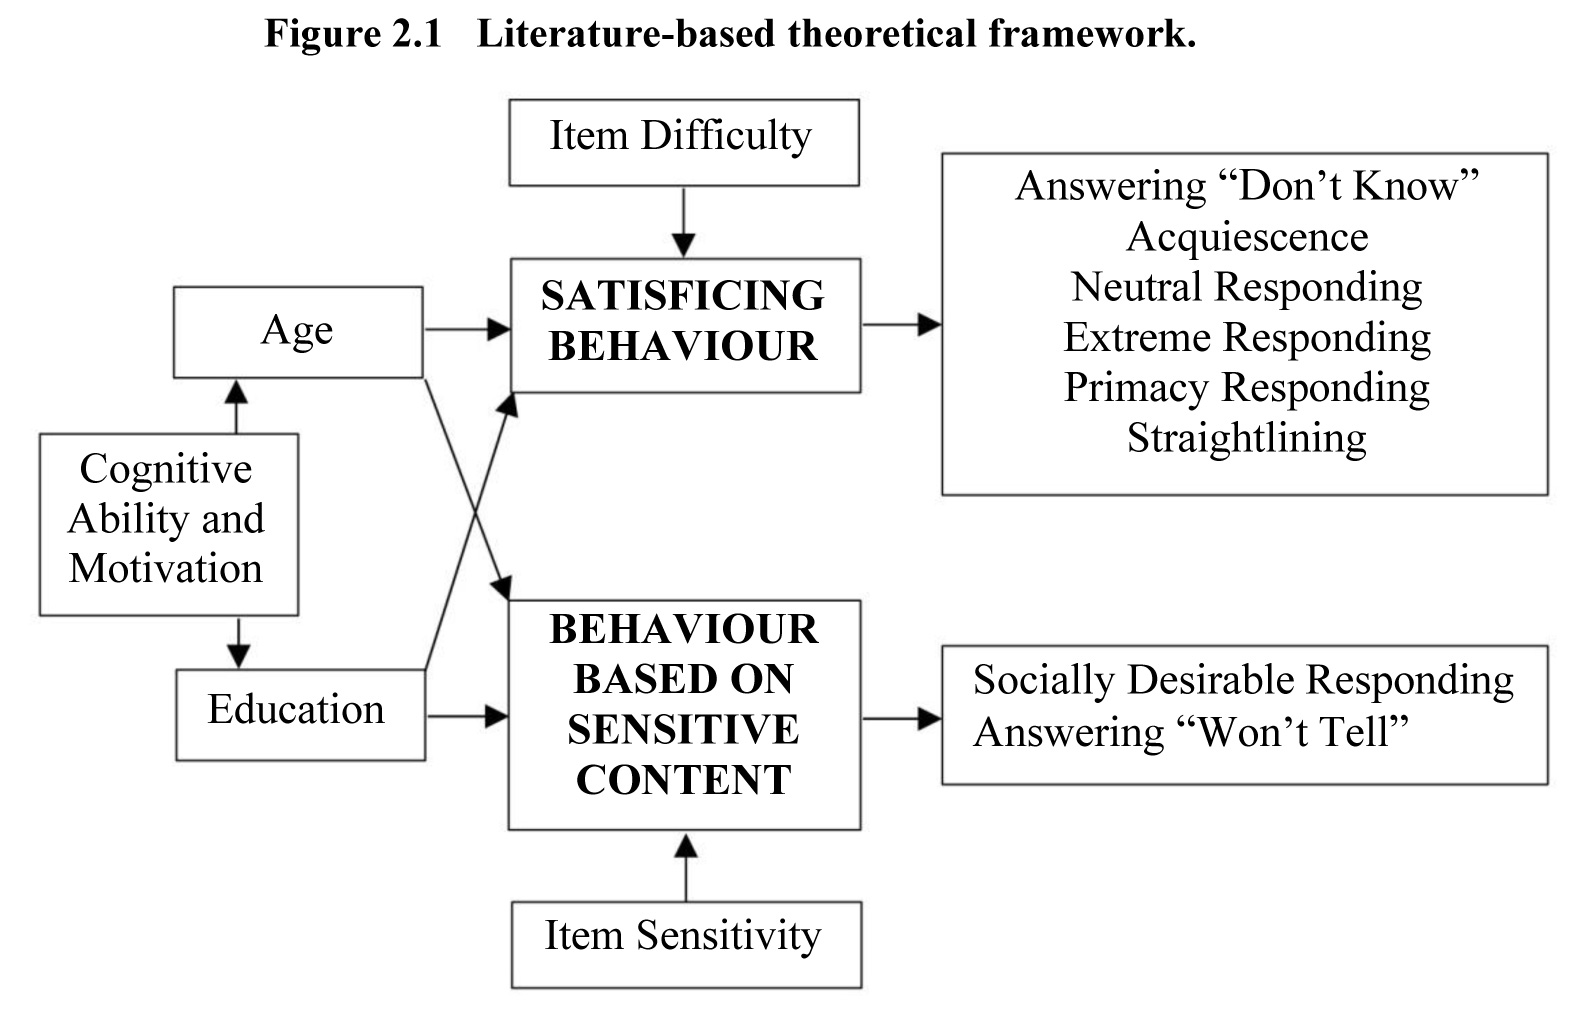
Description of Figure 2.1
Figure describing the complete literature-based theoretical framework on which the main research question is based. We find the respondent characteristics and the answer behaviours which are grouped into satisficing behaviour and behaviour based on sensitive content.
Literature overview: Age and education
Age and education seem to be related to non-substantive UAB, giving neutral, extreme, and acquiescent answers, and straightlining. Some studies found more acquiescence for older than for younger respondents (Meisenberg and Williams, 2008; O’Muircheartaigh, Krosnick and Helic, 2000), while other studies found the opposite (Hox, De Leeuw and Kreft, 1991) or no effect (He, Van de Vijver, Espinosa and Mui, 2014). Older respondents are found to give more extreme answers (Greenleaf, 1992; He et al., 2014; Meisenberg and Williams, 2008), including across questionnaires (Kieruj and Moors, 2013), while younger respondents are found to choose relatively more middle or neutral options (He et al., 2014). Schonlau and Toepoel (2015) found more straightlining for younger than for older respondents, while another study did not find a relation between age and straightlining for respondents who give answers at a high pace (Zhang and Conrad, 2013). Older respondents are found to give more “no opinion”-answers (Pickery and Loosveldt, 1998) or “don’t know”-answers (O’Muircheartaigh et al., 2000) than younger respondents.
Lower educated respondents are found to give more “no opinion”-answers (Narayan and Krosnick, 1996; Krosnick et al., 2002; Pickery and Loosveldt, 1998) and “don’t know”-answers (O’Muircheartaigh et al., 2000; Schuman and Presser, 1981) than higher educated respondents. Most studies found a negative relation between education and acquiescence (McClendon, 1991; Narayan and Krosnick, 1996; O’Muircheartaigh et al., 2000), although some research did not find a relation (Bachman and O’Malley, 1984; He et al., 2014; Hox et al., 1991). Also a negative relation between education and extreme responding is found (Aichholzer, 2013; Greenleaf, 1992; He et al., 2014; Marín, Gamba and Marín, 1992 ‒ but see Bachman and O’Malley, 1984 for different findings), while mixed results exist concerning choosing middle or neutral options; see Narayan and Krosnick (1996) versus He et al. (2014). Among respondents who give answers at a high pace, more straightlining was found for lower than for higher educated respondents (Zhang and Conrad, 2013). Evidence for the relation between education and primacy responding was mixed; see Krosnick and Alwin (1987) versus McClendon (1991).
As summarized above, the literature shows that the relation between age or education and UAB is not unambiguous. The literature needs to be complemented by results that are based on a fixed panel of respondents filling out multiple surveys. Existing findings from different studies are often mixed and may not be comparable because of different respondent samples. This means that it is hard to make literature-based predictions for our panel study and consistent UAB across surveys. Therefore, we do not construct hypotheses and merely explore to what degree UAB for different age and educational groups is consistent across surveys. By using a fixed panel and large set of ten surveys, our aim is to obtain an overarching overview of the relation of age and education to eight relevant UABs.
- Date modified: