
Section 3 – Results at the provincial and territorial levels, 2018 to 2043
Yukon

Archived Content
Information identified as archived is provided for reference, research or recordkeeping purposes. It is not subject to the Government of Canada Web Standards and has not been altered or updated since it was archived. Please "contact us" to request a format other than those available.
Text begins
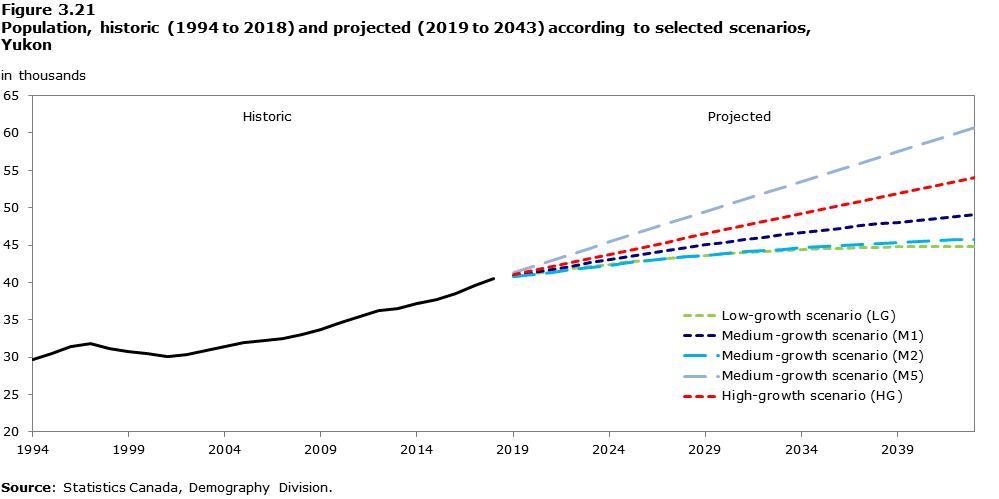
- Projection scenarios show that the population of Yukon would increase over the next 25 years. By 2043, Yukon’s population would be between 44,800 (scenario LG) and 60,700 (scenario M5), compared to 40,500 in 2018.
- Future population growth in Yukon depends largely on international migration and, to a lesser extent, positive net interprovincial migration in certain scenarios (M3, M4 and M5).
- Similar to the rest of the territories, natural increase is projected to remain positive for Yukon over the projection period in all scenarios. However, rates of natural increase are comparatively lower in Yukon than in the other two territories, owing mainly to its relatively lower fertility and older age structure.
- The median age of the population of Yukon is projected to increase in all scenarios over the next 25 years. From 38.9 years in 2018, it would reach between 40.0 years (scenario SA) and 43.7 years (scenario FA) in 2043. The proportion of the population aged 65 and over would increase from 11.8% in 2018 to between 16.6% (scenario SA) and 20.6% (scenarios M3 and FA) by 2043.
Description for Figure 3.21
| Year | Historic | Projected | ||||
|---|---|---|---|---|---|---|
| Low-growth scenario (LG) | Medium-growth scenarios | High-growth scenario (HG) | ||||
| M1 | M2 | M5 | ||||
| in thousands | ||||||
| 1994 | 29.7 | Note ..: not available for a specific reference period | Note ..: not available for a specific reference period | Note ..: not available for a specific reference period | Note ..: not available for a specific reference period | Note ..: not available for a specific reference period |
| 1995 | 30.4 | Note ..: not available for a specific reference period | Note ..: not available for a specific reference period | Note ..: not available for a specific reference period | Note ..: not available for a specific reference period | Note ..: not available for a specific reference period |
| 1996 | 31.4 | Note ..: not available for a specific reference period | Note ..: not available for a specific reference period | Note ..: not available for a specific reference period | Note ..: not available for a specific reference period | Note ..: not available for a specific reference period |
| 1997 | 31.8 | Note ..: not available for a specific reference period | Note ..: not available for a specific reference period | Note ..: not available for a specific reference period | Note ..: not available for a specific reference period | Note ..: not available for a specific reference period |
| 1998 | 31.1 | Note ..: not available for a specific reference period | Note ..: not available for a specific reference period | Note ..: not available for a specific reference period | Note ..: not available for a specific reference period | Note ..: not available for a specific reference period |
| 1999 | 30.8 | Note ..: not available for a specific reference period | Note ..: not available for a specific reference period | Note ..: not available for a specific reference period | Note ..: not available for a specific reference period | Note ..: not available for a specific reference period |
| 2000 | 30.4 | Note ..: not available for a specific reference period | Note ..: not available for a specific reference period | Note ..: not available for a specific reference period | Note ..: not available for a specific reference period | Note ..: not available for a specific reference period |
| 2001 | 30.2 | Note ..: not available for a specific reference period | Note ..: not available for a specific reference period | Note ..: not available for a specific reference period | Note ..: not available for a specific reference period | Note ..: not available for a specific reference period |
| 2002 | 30.3 | Note ..: not available for a specific reference period | Note ..: not available for a specific reference period | Note ..: not available for a specific reference period | Note ..: not available for a specific reference period | Note ..: not available for a specific reference period |
| 2003 | 30.9 | Note ..: not available for a specific reference period | Note ..: not available for a specific reference period | Note ..: not available for a specific reference period | Note ..: not available for a specific reference period | Note ..: not available for a specific reference period |
| 2004 | 31.5 | Note ..: not available for a specific reference period | Note ..: not available for a specific reference period | Note ..: not available for a specific reference period | Note ..: not available for a specific reference period | Note ..: not available for a specific reference period |
| 2005 | 31.9 | Note ..: not available for a specific reference period | Note ..: not available for a specific reference period | Note ..: not available for a specific reference period | Note ..: not available for a specific reference period | Note ..: not available for a specific reference period |
| 2006 | 32.3 | Note ..: not available for a specific reference period | Note ..: not available for a specific reference period | Note ..: not available for a specific reference period | Note ..: not available for a specific reference period | Note ..: not available for a specific reference period |
| 2007 | 32.6 | Note ..: not available for a specific reference period | Note ..: not available for a specific reference period | Note ..: not available for a specific reference period | Note ..: not available for a specific reference period | Note ..: not available for a specific reference period |
| 2008 | 33.1 | Note ..: not available for a specific reference period | Note ..: not available for a specific reference period | Note ..: not available for a specific reference period | Note ..: not available for a specific reference period | Note ..: not available for a specific reference period |
| 2009 | 33.7 | Note ..: not available for a specific reference period | Note ..: not available for a specific reference period | Note ..: not available for a specific reference period | Note ..: not available for a specific reference period | Note ..: not available for a specific reference period |
| 2010 | 34.6 | Note ..: not available for a specific reference period | Note ..: not available for a specific reference period | Note ..: not available for a specific reference period | Note ..: not available for a specific reference period | Note ..: not available for a specific reference period |
| 2011 | 35.4 | Note ..: not available for a specific reference period | Note ..: not available for a specific reference period | Note ..: not available for a specific reference period | Note ..: not available for a specific reference period | Note ..: not available for a specific reference period |
| 2012 | 36.2 | Note ..: not available for a specific reference period | Note ..: not available for a specific reference period | Note ..: not available for a specific reference period | Note ..: not available for a specific reference period | Note ..: not available for a specific reference period |
| 2013 | 36.5 | Note ..: not available for a specific reference period | Note ..: not available for a specific reference period | Note ..: not available for a specific reference period | Note ..: not available for a specific reference period | Note ..: not available for a specific reference period |
| 2014 | 37.1 | Note ..: not available for a specific reference period | Note ..: not available for a specific reference period | Note ..: not available for a specific reference period | Note ..: not available for a specific reference period | Note ..: not available for a specific reference period |
| 2015 | 37.7 | Note ..: not available for a specific reference period | Note ..: not available for a specific reference period | Note ..: not available for a specific reference period | Note ..: not available for a specific reference period | Note ..: not available for a specific reference period |
| 2016 | 38.5 | Note ..: not available for a specific reference period | Note ..: not available for a specific reference period | Note ..: not available for a specific reference period | Note ..: not available for a specific reference period | Note ..: not available for a specific reference period |
| 2017 | 39.6 | Note ..: not available for a specific reference period | Note ..: not available for a specific reference period | Note ..: not available for a specific reference period | Note ..: not available for a specific reference period | Note ..: not available for a specific reference period |
| 2018 | 40.5 | Note ..: not available for a specific reference period | Note ..: not available for a specific reference period | Note ..: not available for a specific reference period | Note ..: not available for a specific reference period | Note ..: not available for a specific reference period |
| 2019 | Note ..: not available for a specific reference period | 40.8 | 40.9 | 40.8 | 41.3 | 41.0 |
| 2020 | Note ..: not available for a specific reference period | 41.2 | 41.3 | 41.1 | 42.1 | 41.5 |
| 2021 | Note ..: not available for a specific reference period | 41.5 | 41.8 | 41.4 | 42.9 | 42.1 |
| 2022 | Note ..: not available for a specific reference period | 41.8 | 42.2 | 41.7 | 43.8 | 42.6 |
| 2023 | Note ..: not available for a specific reference period | 42.2 | 42.6 | 42.0 | 44.6 | 43.2 |
| 2024 | Note ..: not available for a specific reference period | 42.5 | 43.1 | 42.3 | 45.4 | 43.7 |
| 2025 | Note ..: not available for a specific reference period | 42.7 | 43.5 | 42.6 | 46.3 | 44.3 |
| 2026 | Note ..: not available for a specific reference period | 43.0 | 43.9 | 42.9 | 47.1 | 44.9 |
| 2027 | Note ..: not available for a specific reference period | 43.2 | 44.3 | 43.2 | 47.9 | 45.4 |
| 2028 | Note ..: not available for a specific reference period | 43.5 | 44.6 | 43.4 | 48.7 | 46.0 |
| 2029 | Note ..: not available for a specific reference period | 43.7 | 45.0 | 43.7 | 49.5 | 46.5 |
| 2030 | Note ..: not available for a specific reference period | 43.8 | 45.4 | 43.9 | 50.3 | 47.1 |
| 2031 | Note ..: not available for a specific reference period | 44.0 | 45.7 | 44.1 | 51.2 | 47.6 |
| 2032 | Note ..: not available for a specific reference period | 44.2 | 46.0 | 44.3 | 52.0 | 48.2 |
| 2033 | Note ..: not available for a specific reference period | 44.3 | 46.4 | 44.5 | 52.8 | 48.7 |
| 2034 | Note ..: not available for a specific reference period | 44.4 | 46.7 | 44.6 | 53.6 | 49.2 |
| 2035 | Note ..: not available for a specific reference period | 44.5 | 47.0 | 44.8 | 54.4 | 49.8 |
| 2036 | Note ..: not available for a specific reference period | 44.6 | 47.3 | 45.0 | 55.2 | 50.3 |
| 2037 | Note ..: not available for a specific reference period | 44.7 | 47.6 | 45.1 | 56.0 | 50.9 |
| 2038 | Note ..: not available for a specific reference period | 44.7 | 47.8 | 45.2 | 56.8 | 51.4 |
| 2039 | Note ..: not available for a specific reference period | 44.7 | 48.1 | 45.3 | 57.5 | 51.9 |
| 2040 | Note ..: not available for a specific reference period | 44.8 | 48.3 | 45.5 | 58.3 | 52.5 |
| 2041 | Note ..: not available for a specific reference period | 44.8 | 48.6 | 45.6 | 59.1 | 53.0 |
| 2042 | Note ..: not available for a specific reference period | 44.8 | 48.8 | 45.7 | 59.9 | 53.5 |
| 2043 | Note ..: not available for a specific reference period | 44.8 | 49.1 | 45.8 | 60.7 | 54.1 |
|
.. not available for a specific reference period Source: Statistics Canada, Demography Division. |
||||||
| Scenario / Period | Total growth | Natural increase | Net international migration | Net interprovincial migration | |||||||
|---|---|---|---|---|---|---|---|---|---|---|---|
| Total | Births | Deaths | Total | Immigration | Net emigration | Net non-permanent residents | Total | In-migration | Out-migration | ||
| crude rate per thousand | |||||||||||
| Historic | |||||||||||
| 1977/1978 | 27.9 | 15.5 | 19.9 | 4.3 | 0.7 | 2.8 | 2.1 | 0.0 | 11.6 | 124.7 | 113.0 |
| 1997/1998 | -22.6 | 9.2 | 13.2 | 4.1 | 0.4 | 2.5 | 2.6 | 0.5 | -32.2 | 47.2 | 79.4 |
| 2017/2018 | 21.4 | 5.4 | 11.3 | 5.9 | 10.8 | 6.6 | 1.9 | 6.1 | 5.2 | 42.5 | 37.3 |
| Projected | |||||||||||
| Low-growth scenario (LG) | |||||||||||
| 2022/2023 | 7.6 | 3.5 | 10.4 | 6.9 | 4.8 | 6.6 | 1.9 | 0.2 | -0.7 | 45.3 | 46.0 |
| 2032/2033 | 3.0 | 0.8 | 9.4 | 8.6 | 4.4 | 6.3 | 1.9 | 0.0 | -2.2 | 44.2 | 46.5 |
| 2042/2043 | 0.3 | 0.0 | 9.5 | 9.5 | 3.8 | 5.9 | 2.0 | -0.1 | -3.5 | 44.2 | 47.7 |
| Medium-growth scenario (M1) | |||||||||||
| 2022/2023 | 10.3 | 4.7 | 11.2 | 6.5 | 6.2 | 7.4 | 1.7 | 0.5 | -0.7 | 45.4 | 46.1 |
| 2032/2033 | 7.0 | 3.0 | 10.5 | 7.5 | 6.2 | 7.7 | 1.6 | 0.1 | -2.2 | 44.3 | 46.6 |
| 2042/2043 | 4.9 | 2.6 | 10.8 | 8.2 | 5.9 | 7.5 | 1.6 | 0.0 | -3.5 | 44.4 | 47.9 |
| Medium-growth scenario (M2) | |||||||||||
| 2022/2023 | 7.5 | 4.3 | 10.9 | 6.6 | 6.4 | 7.5 | 1.7 | 0.5 | -3.2 | 42.7 | 45.9 |
| 2032/2033 | 4.2 | 2.0 | 9.9 | 7.9 | 6.6 | 8.0 | 1.5 | 0.1 | -4.4 | 41.6 | 46.0 |
| 2042/2043 | 2.2 | 1.2 | 10.2 | 9.0 | 6.5 | 8.1 | 1.5 | -0.1 | -5.5 | 41.6 | 47.1 |
| Medium-growth scenario (M3) | |||||||||||
| 2022/2023 | 13.5 | 4.2 | 10.8 | 6.6 | 6.2 | 7.3 | 1.6 | 0.5 | 3.1 | 41.4 | 38.3 |
| 2032/2033 | 9.5 | 1.7 | 9.4 | 7.7 | 6.0 | 7.4 | 1.5 | 0.1 | 1.8 | 40.7 | 38.9 |
| 2042/2043 | 6.7 | 1.0 | 9.6 | 8.7 | 5.6 | 7.1 | 1.5 | 0.0 | 0.2 | 40.9 | 40.8 |
| Medium-growth scenario (M4) | |||||||||||
| 2022/2023 | 17.4 | 4.4 | 11.0 | 6.6 | 6.0 | 7.2 | 1.7 | 0.5 | 6.9 | 37.7 | 30.7 |
| 2032/2033 | 13.6 | 2.3 | 9.9 | 7.7 | 5.5 | 7.0 | 1.6 | 0.1 | 5.8 | 36.6 | 30.8 |
| 2042/2043 | 11.4 | 1.4 | 10.1 | 8.7 | 4.8 | 6.4 | 1.6 | 0.0 | 5.2 | 36.5 | 31.3 |
| Medium-growth scenario (M5) | |||||||||||
| 2022/2023 | 19.1 | 4.5 | 11.1 | 6.6 | 5.9 | 7.2 | 1.7 | 0.5 | 8.7 | 37.5 | 28.8 |
| 2032/2033 | 15.4 | 2.4 | 10.1 | 7.8 | 5.3 | 6.8 | 1.6 | 0.1 | 7.7 | 36.6 | 28.8 |
| 2042/2043 | 13.4 | 1.4 | 10.3 | 8.8 | 4.5 | 6.1 | 1.6 | 0.0 | 7.5 | 36.5 | 29.0 |
| High-growth scenario (HG) | |||||||||||
| 2022/2023 | 13.0 | 6.0 | 12.1 | 6.1 | 7.8 | 8.2 | 1.5 | 1.1 | -0.8 | 45.2 | 46.0 |
| 2032/2033 | 11.3 | 5.1 | 11.7 | 6.6 | 8.4 | 9.5 | 1.4 | 0.3 | -2.2 | 44.3 | 46.5 |
| 2042/2043 | 10.1 | 4.9 | 12.2 | 7.3 | 8.5 | 9.9 | 1.4 | 0.0 | -3.3 | 44.7 | 48.1 |
| Slow-aging scenario (SA) | |||||||||||
| 2022/2023 | 12.3 | 5.3 | 12.1 | 6.9 | 7.8 | 8.2 | 1.6 | 1.1 | -0.7 | 45.3 | 46.0 |
| 2032/2033 | 10.2 | 3.8 | 11.8 | 8.0 | 8.4 | 9.4 | 1.4 | 0.3 | -2.0 | 44.7 | 46.7 |
| 2042/2043 | 9.5 | 4.0 | 12.4 | 8.4 | 8.5 | 9.8 | 1.4 | 0.0 | -3.1 | 45.4 | 48.4 |
| Fast-aging scenario (FA) | |||||||||||
| 2022/2023 | 8.4 | 4.2 | 10.4 | 6.2 | 4.8 | 6.6 | 1.9 | 0.2 | -0.7 | 45.3 | 46.0 |
| 2032/2033 | 4.2 | 2.3 | 9.3 | 7.0 | 4.4 | 6.3 | 1.9 | 0.0 | -2.4 | 43.9 | 46.3 |
| 2042/2043 | 1.0 | 1.0 | 9.3 | 8.3 | 3.9 | 5.9 | 1.9 | -0.1 | -3.9 | 43.4 | 47.3 |
|
Notes: Crude rates are calculated over the total population and expressed per thousand persons in the total population at midyear. Crude rates are significantly affected by the age structure of the population. For example, most countries will eventually experience an increase in the crude death rate in the coming decades due to the aging of the population, in spite of continued declines in mortality at all ages. The crude rate of natural increase and the crude rate of net migration sum to the crude growth rate. The crude rate of natural increase equals the crude birth rate minus the crude death rate. The crude rate of net migration equals the crude rate of immigration minus the crude rate of net emigration plus the crude rate of net non-permanent resident migration. Net emigration is the balance of emigrants, minus returning emigrants, plus net temporary emigrants. The rate of net interprovincial migration equals the crude rate of interprovincial in-migration minus the crude rate of interprovincial out-migration. Source: Statistics Canada, Demography Division. |
|||||||||||

Description for Figure 3.22
This figure shows four overlapping population pyramids showing the age and sex structures of the 2018 and 2043 Yukon populations according to three scenarios. In 2018, the pyramid is represented by a solid grey colour, while the 2043 pyramids are represented by purple, blue and orange lines, each corresponding respectively to the slow-aging scenario (SA), the medium-growth scenario (M1) and the fast-aging scenario (FA). The counts by age and sex are expressed in relative values (per thousand) in relation to the total population.
The y-axis is in the middle of the figure, separating the pyramids in two and showing the ages from 0 to 100 years. Males are shown on the left side of the axis, and females are shown on the right side.
The x-axis shows the proportion of persons for each age, expressed per thousand, from 0 to 10, and this is the same for the left-handed and right-handed sides of the y-axis.
The shape of the 2018 population age pyramid is diverging from the typical pyramid shape. It looks more like a mushroom with a narrow base, two wider zones at ages 25 to 40 and at ages 50 to 70, and a pointed apex. The lines representing the age and sex structure of the 2043 population according to three scenarios form pyramids with a higher peak than 2018. The 2043 pyramids show that the proportion of the older population will grow compared to the younger ages in the coming decades, a consequence of the aging population structure projected.
- Date modified: