
Section 3 – Results at the provincial and territorial levels, 2018 to 2043
New Brunswick

Archived Content
Information identified as archived is provided for reference, research or recordkeeping purposes. It is not subject to the Government of Canada Web Standards and has not been altered or updated since it was archived. Please "contact us" to request a format other than those available.
Text begins
- According to the projection scenarios, New Brunswick’s population would be between 736,900 (scenario LG) and 855,100 (scenario HG) by 2043, compared to 770,600 in 2018. In all scenarios, New Brunswick’s projected demographic weight within Canada decreases from its value of 2.1% in 2018 to between 1.6% (scenario SA) and 1.8% (scenario FA) in 2043.
- New Brunswick’s population would increase between 2018 and 2043 in all but two projection scenarios (LG and FA). In the scenarios where its population decreases, it is mainly due to natural increase becoming more and more negative under population aging and, to a lesser extent, to losses in interprovincial migration.
- Like in the majority of the provinces, the increasingly negative natural increase projected for New Brunswick is driven primarily by rising crude death rates paired with falling crude birth rates (as a result of an older projected population age structure).
- In 2018, New Brunswick had the second-highest median age in the country, following Newfoundland and Labrador. This situation is projected to continue in all scenarios. In 2043, the median age of the population of New Brunswick would reach between 46.7 years (scenario SA) and 51.2 years (scenario FA), up from 45.9 years in 2018. From 20.8% in 2018, the proportion of the population aged 65 and over is projected to reach between 27.4% (scenario SA) and 32.4% (scenario FA) by 2043.

Description for Figure 3.7
| Year | Historic | Projected | ||||
|---|---|---|---|---|---|---|
| Low-growth scenario (LG) | Medium-growth scenarios | High-growth scenario (HG) | ||||
| M1 | M4 | M2 | ||||
| in thousands | ||||||
| 1994 | 750.2 | Note ..: not available for a specific reference period | Note ..: not available for a specific reference period | Note ..: not available for a specific reference period | Note ..: not available for a specific reference period | Note ..: not available for a specific reference period |
| 1995 | 750.9 | Note ..: not available for a specific reference period | Note ..: not available for a specific reference period | Note ..: not available for a specific reference period | Note ..: not available for a specific reference period | Note ..: not available for a specific reference period |
| 1996 | 752.3 | Note ..: not available for a specific reference period | Note ..: not available for a specific reference period | Note ..: not available for a specific reference period | Note ..: not available for a specific reference period | Note ..: not available for a specific reference period |
| 1997 | 752.5 | Note ..: not available for a specific reference period | Note ..: not available for a specific reference period | Note ..: not available for a specific reference period | Note ..: not available for a specific reference period | Note ..: not available for a specific reference period |
| 1998 | 750.5 | Note ..: not available for a specific reference period | Note ..: not available for a specific reference period | Note ..: not available for a specific reference period | Note ..: not available for a specific reference period | Note ..: not available for a specific reference period |
| 1999 | 750.6 | Note ..: not available for a specific reference period | Note ..: not available for a specific reference period | Note ..: not available for a specific reference period | Note ..: not available for a specific reference period | Note ..: not available for a specific reference period |
| 2000 | 750.5 | Note ..: not available for a specific reference period | Note ..: not available for a specific reference period | Note ..: not available for a specific reference period | Note ..: not available for a specific reference period | Note ..: not available for a specific reference period |
| 2001 | 749.8 | Note ..: not available for a specific reference period | Note ..: not available for a specific reference period | Note ..: not available for a specific reference period | Note ..: not available for a specific reference period | Note ..: not available for a specific reference period |
| 2002 | 749.4 | Note ..: not available for a specific reference period | Note ..: not available for a specific reference period | Note ..: not available for a specific reference period | Note ..: not available for a specific reference period | Note ..: not available for a specific reference period |
| 2003 | 749.4 | Note ..: not available for a specific reference period | Note ..: not available for a specific reference period | Note ..: not available for a specific reference period | Note ..: not available for a specific reference period | Note ..: not available for a specific reference period |
| 2004 | 749.4 | Note ..: not available for a specific reference period | Note ..: not available for a specific reference period | Note ..: not available for a specific reference period | Note ..: not available for a specific reference period | Note ..: not available for a specific reference period |
| 2005 | 748.1 | Note ..: not available for a specific reference period | Note ..: not available for a specific reference period | Note ..: not available for a specific reference period | Note ..: not available for a specific reference period | Note ..: not available for a specific reference period |
| 2006 | 745.6 | Note ..: not available for a specific reference period | Note ..: not available for a specific reference period | Note ..: not available for a specific reference period | Note ..: not available for a specific reference period | Note ..: not available for a specific reference period |
| 2007 | 745.4 | Note ..: not available for a specific reference period | Note ..: not available for a specific reference period | Note ..: not available for a specific reference period | Note ..: not available for a specific reference period | Note ..: not available for a specific reference period |
| 2008 | 746.9 | Note ..: not available for a specific reference period | Note ..: not available for a specific reference period | Note ..: not available for a specific reference period | Note ..: not available for a specific reference period | Note ..: not available for a specific reference period |
| 2009 | 750.0 | Note ..: not available for a specific reference period | Note ..: not available for a specific reference period | Note ..: not available for a specific reference period | Note ..: not available for a specific reference period | Note ..: not available for a specific reference period |
| 2010 | 753.0 | Note ..: not available for a specific reference period | Note ..: not available for a specific reference period | Note ..: not available for a specific reference period | Note ..: not available for a specific reference period | Note ..: not available for a specific reference period |
| 2011 | 755.7 | Note ..: not available for a specific reference period | Note ..: not available for a specific reference period | Note ..: not available for a specific reference period | Note ..: not available for a specific reference period | Note ..: not available for a specific reference period |
| 2012 | 758.4 | Note ..: not available for a specific reference period | Note ..: not available for a specific reference period | Note ..: not available for a specific reference period | Note ..: not available for a specific reference period | Note ..: not available for a specific reference period |
| 2013 | 758.5 | Note ..: not available for a specific reference period | Note ..: not available for a specific reference period | Note ..: not available for a specific reference period | Note ..: not available for a specific reference period | Note ..: not available for a specific reference period |
| 2014 | 759.0 | Note ..: not available for a specific reference period | Note ..: not available for a specific reference period | Note ..: not available for a specific reference period | Note ..: not available for a specific reference period | Note ..: not available for a specific reference period |
| 2015 | 758.8 | Note ..: not available for a specific reference period | Note ..: not available for a specific reference period | Note ..: not available for a specific reference period | Note ..: not available for a specific reference period | Note ..: not available for a specific reference period |
| 2016 | 763.4 | Note ..: not available for a specific reference period | Note ..: not available for a specific reference period | Note ..: not available for a specific reference period | Note ..: not available for a specific reference period | Note ..: not available for a specific reference period |
| 2017 | 766.9 | Note ..: not available for a specific reference period | Note ..: not available for a specific reference period | Note ..: not available for a specific reference period | Note ..: not available for a specific reference period | Note ..: not available for a specific reference period |
| 2018 | 770.6 | Note ..: not available for a specific reference period | Note ..: not available for a specific reference period | Note ..: not available for a specific reference period | Note ..: not available for a specific reference period | Note ..: not available for a specific reference period |
| 2019 | Note ..: not available for a specific reference period | 772.1 | 773.1 | 772.4 | 773.1 | 774.3 |
| 2020 | Note ..: not available for a specific reference period | 773.4 | 775.6 | 774.3 | 775.6 | 777.9 |
| 2021 | Note ..: not available for a specific reference period | 774.6 | 778.1 | 776.2 | 778.2 | 781.8 |
| 2022 | Note ..: not available for a specific reference period | 775.6 | 780.6 | 778.1 | 780.8 | 785.8 |
| 2023 | Note ..: not available for a specific reference period | 776.4 | 783.1 | 780.0 | 783.3 | 789.8 |
| 2024 | Note ..: not available for a specific reference period | 776.9 | 785.5 | 781.7 | 785.7 | 794.0 |
| 2025 | Note ..: not available for a specific reference period | 777.2 | 787.7 | 783.3 | 788.0 | 798.2 |
| 2026 | Note ..: not available for a specific reference period | 777.1 | 789.8 | 784.8 | 790.1 | 802.4 |
| 2027 | Note ..: not available for a specific reference period | 776.9 | 791.8 | 786.1 | 792.1 | 806.6 |
| 2028 | Note ..: not available for a specific reference period | 776.3 | 793.6 | 787.2 | 794.0 | 810.7 |
| 2029 | Note ..: not available for a specific reference period | 775.5 | 795.2 | 788.2 | 795.6 | 814.8 |
| 2030 | Note ..: not available for a specific reference period | 774.3 | 796.6 | 788.9 | 797.0 | 818.8 |
| 2031 | Note ..: not available for a specific reference period | 772.9 | 797.8 | 789.5 | 798.2 | 822.7 |
| 2032 | Note ..: not available for a specific reference period | 771.3 | 798.7 | 789.8 | 799.2 | 826.4 |
| 2033 | Note ..: not available for a specific reference period | 769.3 | 799.5 | 789.9 | 800.0 | 830.0 |
| 2034 | Note ..: not available for a specific reference period | 767.1 | 800.0 | 789.7 | 800.6 | 833.4 |
| 2035 | Note ..: not available for a specific reference period | 764.6 | 800.3 | 789.3 | 800.9 | 836.7 |
| 2036 | Note ..: not available for a specific reference period | 761.9 | 800.3 | 788.7 | 801.0 | 839.8 |
| 2037 | Note ..: not available for a specific reference period | 758.9 | 800.1 | 787.8 | 800.8 | 842.6 |
| 2038 | Note ..: not available for a specific reference period | 755.7 | 799.7 | 786.7 | 800.4 | 845.3 |
| 2039 | Note ..: not available for a specific reference period | 752.3 | 799.0 | 785.4 | 799.8 | 847.7 |
| 2040 | Note ..: not available for a specific reference period | 748.7 | 798.1 | 783.8 | 799.0 | 849.9 |
| 2041 | Note ..: not available for a specific reference period | 745.0 | 797.0 | 782.0 | 797.9 | 851.9 |
| 2042 | Note ..: not available for a specific reference period | 741.0 | 795.6 | 780.0 | 796.6 | 853.6 |
| 2043 | Note ..: not available for a specific reference period | 736.9 | 794.0 | 777.7 | 795.1 | 855.1 |
|
.. not available for a specific reference period Source: Statistics Canada, Demography Division. |
||||||
| Scenario / Period | Total growth | Natural increase | Net international migration | Net interprovincial migration | |||||||
|---|---|---|---|---|---|---|---|---|---|---|---|
| Total | Births | Deaths | Total | Immigration | Net emigration | Net non-permanent residents | Total | In-migration | Out-migration | ||
| crude rate per thousand | |||||||||||
| Historic | |||||||||||
| 1977/1978 | 6.8 | 8.5 | 15.9 | 7.5 | 0.3 | 1.1 | 0.8 | 0.0 | -1.9 | 21.8 | 23.7 |
| 1997/1998 | -1.4 | 2.4 | 10.6 | 8.1 | 0.4 | 1.0 | 0.6 | 0.0 | -4.2 | 14.5 | 18.7 |
| 2017/2018 | 4.9 | -1.1 | 8.6 | 9.7 | 6.1 | 5.4 | 0.5 | 1.3 | -0.1 | 14.9 | 14.9 |
| Projected | |||||||||||
| Low-growth scenario (LG) | |||||||||||
| 2022/2023 | 1.0 | -2.8 | 7.8 | 10.6 | 4.5 | 5.1 | 0.7 | 0.0 | -0.7 | 12.9 | 13.6 |
| 2032/2033 | -2.5 | -5.6 | 7.3 | 12.9 | 3.8 | 4.5 | 0.7 | 0.0 | -0.8 | 12.4 | 13.2 |
| 2042/2043 | -5.6 | -7.6 | 7.3 | 14.9 | 2.7 | 3.3 | 0.6 | 0.0 | -0.7 | 12.1 | 12.8 |
| Medium-growth scenario (M1) | |||||||||||
| 2022/2023 | 3.1 | -1.6 | 8.3 | 9.9 | 5.4 | 5.7 | 0.6 | 0.2 | -0.7 | 12.9 | 13.6 |
| 2032/2033 | 0.9 | -3.4 | 8.1 | 11.5 | 5.0 | 5.5 | 0.6 | 0.1 | -0.7 | 12.4 | 13.1 |
| 2042/2043 | -2.0 | -5.2 | 8.2 | 13.3 | 3.8 | 4.3 | 0.5 | 0.0 | -0.7 | 12.2 | 12.9 |
| Medium-growth scenario (M2) | |||||||||||
| 2022/2023 | 3.2 | -1.6 | 8.4 | 9.9 | 5.4 | 5.7 | 0.6 | 0.2 | -0.6 | 13.1 | 13.8 |
| 2032/2033 | 1.0 | -3.3 | 8.1 | 11.4 | 5.0 | 5.5 | 0.6 | 0.1 | -0.8 | 12.6 | 13.3 |
| 2042/2043 | -1.9 | -5.1 | 8.2 | 13.3 | 3.8 | 4.3 | 0.5 | 0.0 | -0.7 | 12.3 | 13.0 |
| Medium-growth scenario (M3) | |||||||||||
| 2022/2023 | 2.5 | -1.6 | 8.3 | 10.0 | 5.4 | 5.8 | 0.6 | 0.2 | -1.2 | 13.5 | 14.7 |
| 2032/2033 | 0.2 | -3.5 | 8.0 | 11.6 | 5.1 | 5.6 | 0.6 | 0.1 | -1.3 | 12.9 | 14.3 |
| 2042/2043 | -2.8 | -5.4 | 8.1 | 13.5 | 3.9 | 4.4 | 0.5 | 0.0 | -1.3 | 12.7 | 14.0 |
| Medium-growth scenario (M4) | |||||||||||
| 2022/2023 | 2.3 | -1.8 | 8.2 | 10.0 | 5.4 | 5.8 | 0.6 | 0.2 | -1.3 | 12.4 | 13.8 |
| 2032/2033 | 0.1 | -3.8 | 7.8 | 11.6 | 5.1 | 5.6 | 0.6 | 0.1 | -1.3 | 12.0 | 13.3 |
| 2042/2043 | -2.9 | -5.7 | 7.9 | 13.6 | 3.9 | 4.4 | 0.5 | 0.0 | -1.2 | 11.8 | 13.0 |
| Medium-growth scenario (M5) | |||||||||||
| 2022/2023 | 2.5 | -1.8 | 8.2 | 10.0 | 5.4 | 5.8 | 0.6 | 0.2 | -1.1 | 12.6 | 13.8 |
| 2032/2033 | 0.4 | -3.7 | 7.9 | 11.6 | 5.1 | 5.6 | 0.6 | 0.1 | -1.0 | 12.2 | 13.2 |
| 2042/2043 | -2.6 | -5.6 | 8.0 | 13.5 | 3.9 | 4.4 | 0.5 | 0.0 | -0.9 | 12.0 | 12.9 |
| High-growth scenario (H) | |||||||||||
| 2022/2023 | 5.2 | -0.5 | 8.9 | 9.4 | 6.4 | 6.4 | 0.6 | 0.6 | -0.7 | 12.9 | 13.6 |
| 2032/2033 | 4.3 | -1.5 | 8.9 | 10.4 | 6.6 | 6.9 | 0.5 | 0.2 | -0.7 | 12.4 | 13.1 |
| 2042/2043 | 1.7 | -3.0 | 9.2 | 12.1 | 5.4 | 5.8 | 0.5 | 0.1 | -0.7 | 12.2 | 12.9 |
| Slow-aging scenario (SA) | |||||||||||
| 2022/2023 | 4.1 | -1.6 | 9.0 | 10.5 | 6.4 | 6.4 | 0.6 | 0.6 | -0.7 | 12.9 | 13.6 |
| 2032/2033 | 2.6 | -3.2 | 9.1 | 12.3 | 6.6 | 6.9 | 0.5 | 0.2 | -0.8 | 12.5 | 13.3 |
| 2042/2043 | 0.6 | -4.1 | 9.4 | 13.5 | 5.5 | 5.8 | 0.5 | 0.1 | -0.8 | 12.4 | 13.2 |
| Fast-aging scenario (FA) | |||||||||||
| 2022/2023 | 2.1 | -1.8 | 7.8 | 9.5 | 4.5 | 5.1 | 0.6 | 0.0 | -0.6 | 12.9 | 13.6 |
| 2032/2033 | -0.6 | -3.7 | 7.2 | 10.9 | 3.8 | 4.4 | 0.6 | 0.0 | -0.7 | 12.3 | 13.0 |
| 2042/2043 | -4.2 | -6.3 | 7.1 | 13.4 | 2.7 | 3.3 | 0.6 | 0.0 | -0.6 | 12.0 | 12.5 |
|
Notes: Crude rates are calculated over the total population and expressed per thousand persons in the total population at midyear. Crude rates are significantly affected by the age structure of the population. For example, most countries will eventually experience an increase in the crude death rate in the coming decades due to the aging of the population, in spite of continued declines in mortality at all ages. The crude rate of natural increase and the crude rate of net migration sum to the crude growth rate. The crude rate of natural increase equals the crude birth rate minus the crude death rate. The crude rate of net migration equals the crude rate of immigration minus the crude rate of net emigration plus the crude rate of net non-permanent resident migration. Net emigration is the balance of emigrants, minus returning emigrants, plus net temporary emigrants. The rate of net interprovincial migration equals the crude rate of interprovincial in-migration minus the crude rate of interprovincial out-migration. Source: Statistics Canada, Demography Division. |
|||||||||||
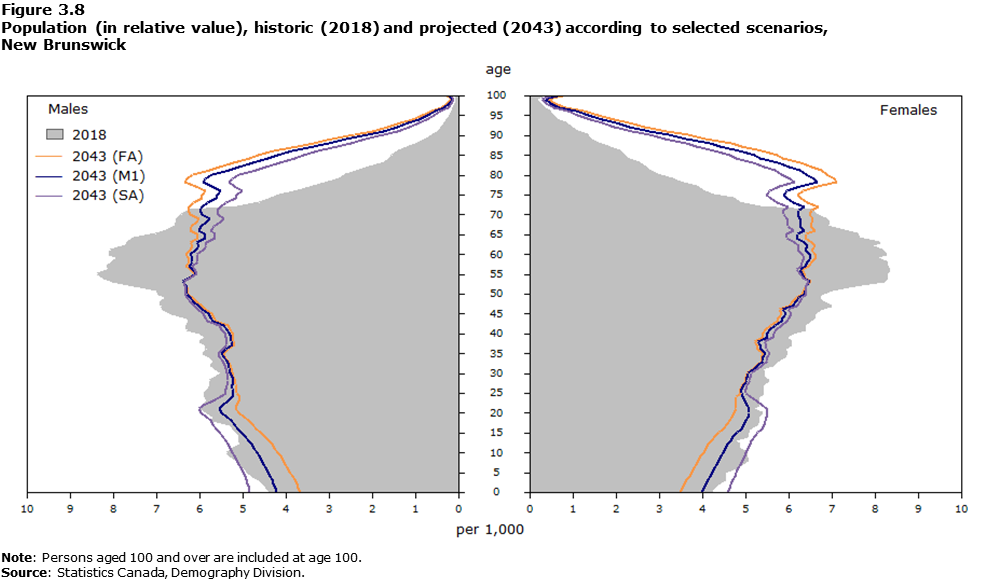
Description for Figure 3.8
This figure shows four overlapping population pyramids showing the age and sex structures of the 2018 and 2043 New Brunswick populations according to three scenarios. In 2018, the pyramid is represented by a solid grey colour, while the 2043 pyramids are represented by purple, blue and orange lines, each corresponding respectively to the slow-aging scenario (SA), the medium-growth scenario (M1) and the fast-aging scenario (FA). The counts by age and sex are expressed in relative values (per thousand) in relation to the total population.
The y-axis is in the middle of the figure, separating the pyramids in two and showing the ages from 0 to 100 years. Males are shown on the left side of the axis, and females are shown on the right side.
The x-axis shows the proportion of persons for each age, expressed per thousand, from 0 to 10, and this is the same for the left-handed and right-handed sides of the y-axis.
The shape of the 2018 population age pyramid is diverging from the typical pyramid shape. It looks more like a mushroom with a narrow base, wider at ages from 50 to 70 years, and a pointed apex. The lines representing the age and sex structure of the 2043 population according to three scenarios form pyramids with a higher peak and a narrower base than 2018, a consequence of the aging population structure projected. The 2043 pyramids show that the proportion of the older population will grow compared to the younger ages in the coming decades.
- Date modified: