
150 years of immigration in Canada

Archived Content
Information identified as archived is provided for reference, research or recordkeeping purposes. It is not subject to the Government of Canada Web Standards and has not been altered or updated since it was archived. Please "contact us" to request a format other than those available.

Canada has long been, and continues to be, a land of immigration. Since Confederation in 1867, more than 17 million immigrants have come to Canada.
Population fluctuations
The annual number of landed immigrants in Canada has fluctuated considerably over the last 150 years. Some of these fluctuations can be linked to immigration policy changes, others to Canada's economic situation or world events connected with the movement of migrants and refugees.
For example, in the late 1800s, the number of immigrants admitted annually to Canada varied between 6,300 and 133,000. Record numbers of immigrants were admitted in the early 1900s when Canada was promoting the settlement of Western Canada. The highest number ever recorded was in 1913, when more than 400,000 immigrants arrived in the country.
However, the number of people entering the country dropped dramatically during World War I, to fewer than 34,000 landed immigrants in 1915. The lowest numbers of landed immigrants were recorded during the Great Depression in the 1930s and during World War II. The return of peace fostered economic recovery and an immigration boom in Canada.
Other record levels of immigration have been registered during political and humanitarian crises, including in 1956 and 1957, when 37,500 Hungarian refugees arrived in the country, and in the 1970s and 1980s, when a large number of Ugandan, Chilean, Vietnamese, Cambodian and Laotian refugees came to Canada.
Since the early 1990s, the number of landed immigrants has remained relatively high, with an average of approximately 235,000 new immigrants per year.

Description for Chart 1
| Year of immigration | Number of landed immigrants |
|---|---|
| Sources: From 1852 to 1979—Employment and Immigration Canada, 1982. For 1980—Immigration Statistics, Immigration and Demographic Policy Group, Catalogue no. MP22-1/1980. From 1980 to 2014—Immigration Refugees Citizenship Canada. | |
| 1852 | 29,300 |
| 1853 | 29,500 |
| 1854 | 37,300 |
| 1855 | 25,300 |
| 1856 | 22,500 |
| 1857 | 33,900 |
| 1858 | 12,300 |
| 1859 | 6,300 |
| 1860 | 6,300 |
| 1861 | 13,600 |
| 1862 | 18,300 |
| 1863 | 21,000 |
| 1864 | 24,800 |
| 1865 | 19,000 |
| 1866 | 11,400 |
| 1867 | 10,700 |
| 1868 | 12,800 |
| 1869 | 18,600 |
| 1870 | 24,700 |
| 1871 | 27,800 |
| 1872 | 36,600 |
| 1873 | 50,100 |
| 1874 | 39,400 |
| 1875 | 27,400 |
| 1876 | 25,600 |
| 1877 | 27,100 |
| 1878 | 29,800 |
| 1879 | 40,500 |
| 1880 | 38,500 |
| 1881 | 48,000 |
| 1882 | 112,500 |
| 1883 | 133,600 |
| 1884 | 103,800 |
| 1885 | 79,200 |
| 1886 | 69,200 |
| 1887 | 84,500 |
| 1888 | 88,800 |
| 1889 | 91,600 |
| 1890 | 75,100 |
| 1891 | 82,200 |
| 1892 | 31,000 |
| 1893 | 29,600 |
| 1894 | 20,800 |
| 1895 | 18,800 |
| 1896 | 16,800 |
| 1897 | 21,700 |
| 1898 | 31,900 |
| 1899 | 44,500 |
| 1900 | 41,700 |
| 1901 | 55,700 |
| 1902 | 89,100 |
| 1903 | 138,700 |
| 1904 | 131,300 |
| 1905 | 141,500 |
| 1906 | 211,700 |
| 1907 | 272,400 |
| 1908 | 143,300 |
| 1909 | 173,700 |
| 1910 | 286,800 |
| 1911 | 331,300 |
| 1912 | 375,800 |
| 1913 | 400,900 |
| 1914 | 150,500 |
| 1915 | 36,700 |
| 1916 | 55,900 |
| 1917 | 72,900 |
| 1918 | 41,800 |
| 1919 | 107,700 |
| 1920 | 138,800 |
| 1921 | 91,700 |
| 1922 | 64,200 |
| 1923 | 133,700 |
| 1924 | 124,200 |
| 1925 | 84,900 |
| 1926 | 135,100 |
| 1927 | 158,900 |
| 1928 | 166,800 |
| 1929 | 165,000 |
| 1930 | 104,800 |
| 1931 | 27,500 |
| 1932 | 20,600 |
| 1933 | 14,400 |
| 1934 | 12,500 |
| 1935 | 11,300 |
| 1936 | 11,600 |
| 1937 | 15,100 |
| 1938 | 17,200 |
| 1939 | 17,000 |
| 1940 | 11,300 |
| 1941 | 9,300 |
| 1942 | 7,600 |
| 1943 | 8,500 |
| 1944 | 12,800 |
| 1945 | 22,700 |
| 1946 | 71,700 |
| 1947 | 64,100 |
| 1948 | 125,400 |
| 1949 | 95,200 |
| 1950 | 73,900 |
| 1951 | 194,400 |
| 1952 | 164,500 |
| 1953 | 168,900 |
| 1954 | 154,200 |
| 1955 | 109,900 |
| 1956 | 164,900 |
| 1957 | 282,200 |
| 1958 | 124,900 |
| 1959 | 106,900 |
| 1960 | 104,100 |
| 1961 | 71,700 |
| 1962 | 74,600 |
| 1963 | 93,200 |
| 1964 | 112,600 |
| 1965 | 146,800 |
| 1966 | 194,700 |
| 1967 | 222,900 |
| 1968 | 184,000 |
| 1969 | 161,500 |
| 1970 | 147,700 |
| 1971 | 121,900 |
| 1972 | 122,000 |
| 1973 | 184,200 |
| 1974 | 218,500 |
| 1975 | 187,900 |
| 1976 | 149,400 |
| 1977 | 114,900 |
| 1978 | 86,300 |
| 1979 | 112,100 |
| 1980 | 143,100 |
| 1981 | 128,600 |
| 1982 | 121,200 |
| 1983 | 89,200 |
| 1984 | 88,300 |
| 1985 | 84,300 |
| 1986 | 99,400 |
| 1987 | 152,100 |
| 1988 | 161,600 |
| 1989 | 191,600 |
| 1990 | 216,500 |
| 1991 | 232,800 |
| 1992 | 254,800 |
| 1993 | 256,600 |
| 1994 | 224,400 |
| 1995 | 212,900 |
| 1996 | 226,100 |
| 1997 | 216,000 |
| 1998 | 174,200 |
| 1999 | 190,000 |
| 2000 | 227,500 |
| 2001 | 250,600 |
| 2002 | 229,000 |
| 2003 | 221,300 |
| 2004 | 235,800 |
| 2005 | 262,200 |
| 2006 | 251,600 |
| 2007 | 236,800 |
| 2008 | 247,200 |
| 2009 | 252,200 |
| 2010 | 280,700 |
| 2011 | 248,700 |
| 2012 | 257,900 |
| 2013 | 259,000 |
| 2014 | 260,400 |
Increase in the number and proportion of foreign-born people
Annual statistics on landed immigrants in Canada may not reflect the number of people living in the country. Some immigrants may simply be passing through on their way to settle in a third country. Others may travel back and forth between their country of origin and Canada. Some immigrants may have died. The Census of Population measures the most direct impact of immigration on Canada's population by counting the number of people who have been or who are landed immigrants (or permanent residents) living in Canada at a specific point in time.
The 1871 Census enumerated approximately half a million foreign-born people, representing 16.1% of the Canadian population.
The foreign-born population continued to rise at the end of the 1800s, but at a slower pace than the population born in Canada. The 1901 Census recorded the lowest proportion of foreign-born population in Canada (13.0%).
After the considerable rise in immigration at the beginning of the 1900s, the 1931 Census counted nearly 2.3 million of foreign-born people, representing 22.2% of Canada's population.
This influx of foreign-born people was followed by a significant drop to approximately 2 million in 1941, as a result of the Great Depression and World War II, but also due to high emigration levels. By contrast, since the 1950s, the foreign-born population has been steadily increasing.
For example, by 2011, the National Household Survey estimated the foreign-born population at 6,775,700, representing 20.6% of the total population. This was the largest proportion since the 1931 Census.

Description for Chart 2
| Number | Percentage | ||||||||||||||
|---|---|---|---|---|---|---|---|---|---|---|---|---|---|---|---|
| Sources: Statistics Canada, censuses of population, 1871 to 2001; National Household Survey, 2011. | |||||||||||||||
| 1871 | 594,207 | 16.1% | |||||||||||||
| 1881 | 602,984 | 13.9% | |||||||||||||
| 1891 | 643,871 | 13.3% | |||||||||||||
| 1901 | 699,500 | 13.0% | |||||||||||||
| 1911 | 1,586,961 | 22.0% | |||||||||||||
| 1921 | 1,955,736 | 22.3% | |||||||||||||
| 1931 | 2,307,525 | 22.2% | |||||||||||||
| 1941 | 2,018,847 | 17.5% | |||||||||||||
| 1951 | 2,059,911 | 14.7% | |||||||||||||
| 1961 | 2,844,263 | 15.6% | |||||||||||||
| 1971 | 3,295,530 | 15.3% | |||||||||||||
| 1981 | 3,843,335 | 16.0% | |||||||||||||
| 1991 | 4,342,890 | 16.1% | |||||||||||||
| 2001 | 5,448,480 | 18.4% | |||||||||||||
| 2011 | 6,775,770 | 20.6% | |||||||||||||
Source countries changing
The composition of the foreign-born population has changed considerably in 150 years, and the censuses revealed a shift in the places of birth of Canada’s foreign-born population.
In the past, immigrants mainly from European countries
During the first few censuses after Confederation, the British Isles were the main source of immigration, accounting for 83.6% of the foreign-born population in the 1871 Census, or close to half a million people. Immigrants from the United States (10.9%), Germany (4.1%) and France (0.5%) were far behind.
The population of immigrants born in European countries other than those of the British Isles started to increase in the late 1800s, slowly at first and then more rapidly, peaking in the 1970s. This transformation consisted of three major waves.
The first wave began in the late 1800s and early 1900s, with the arrival of new groups of immigrants from Eastern Europe (Russians, Polish and Ukrainians), Western Europe and Scandinavia.
A second immigration boom following World War II continued to favour immigration from the British Isles, but a significant number of immigrants also arrived from Western Europe (Germany and the Netherlands) and Southern Europe (Italy, Greece, Yugoslavia and Portugal) from the 1950s to the 1970s. At the time of the 1971 Census, 28.3% of immigrants were born in the United Kingdom and 51.4% were born in another European country.
Lastly, Canada admitted immigrants from Eastern Europe (including the Russian Federation and former Soviet republics, Poland and Romania) in the 1980s and 1990s, following political changes in Communist bloc countries, including the fall of the Berlin Wall and the breakup of the Soviet Union.
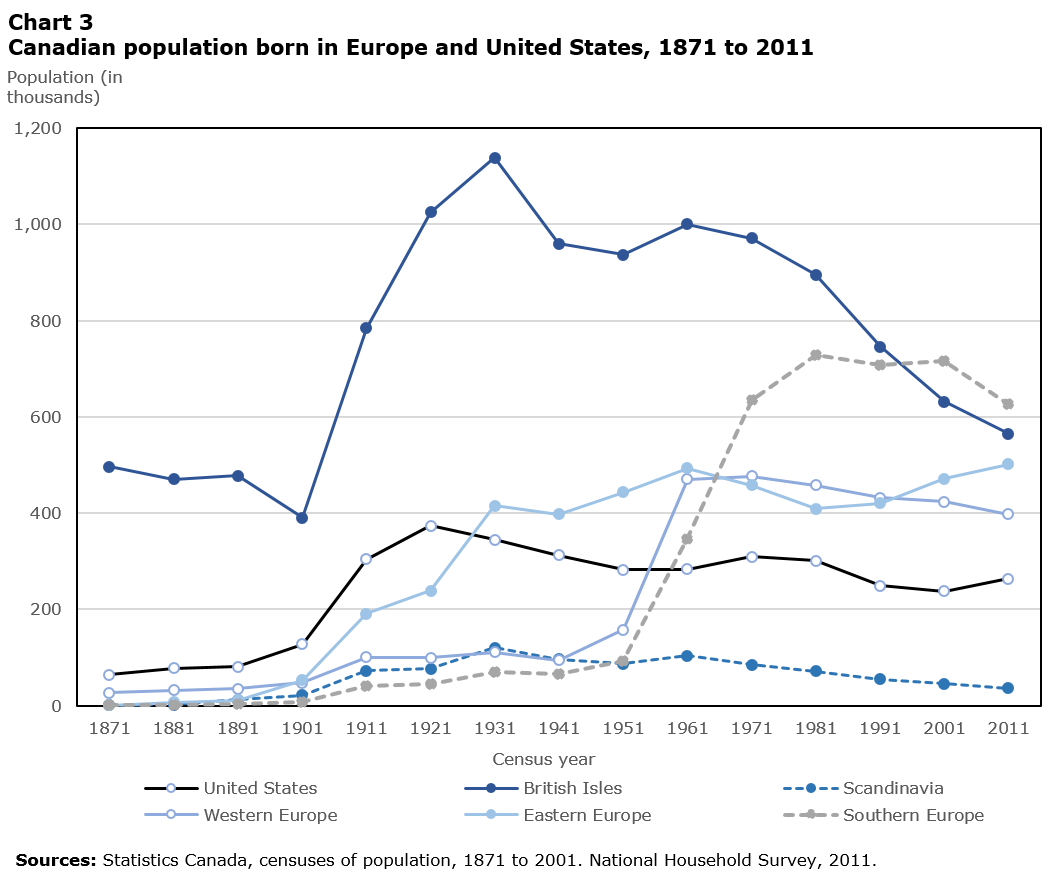
Description for Chart 3
| Country or Area of interest | United States | Western Europe | Eastern Europe | Scandinavia | British Isles | Southern Europe | |||||||||
|---|---|---|---|---|---|---|---|---|---|---|---|---|---|---|---|
| Sources: Statistics Canada, Census of Population, 1871 to 2001. National Household Survey, 2011. | |||||||||||||||
| 1871 | 64,600 | 27,200 | 400 | 600 | 496,600 | 500 | |||||||||
| 1881 | 77,800 | 31,400 | 7,000 | 2,100 | 470,900 | 1,400 | |||||||||
| 1891 | 80,900 | 35,400 | 10,600 | 12,600 | 477,700 | 3,400 | |||||||||
| 1901 | 127,900 | 47,600 | 52,300 | 21,400 | 390,000 | 8,000 | |||||||||
| 1911 | 303,700 | 100,700 | 191,100 | 72,300 | 784,500 | 41,700 | |||||||||
| 1921 | 374,000 | 99,700 | 238,900 | 77,000 | 1,025,000 | 45,300 | |||||||||
| 1931 | 344,600 | 110,400 | 415,400 | 120,400 | 1,138,900 | 69,000 | |||||||||
| 1941 | 312,500 | 94,000 | 397,500 | 96,800 | 960,100 | 66,400 | |||||||||
| 1951 | 282,000 | 157,700 | 443,700 | 86,600 | 936,600 | 92,600 | |||||||||
| 1961 | 283,900 | 470,100 | 493,800 | 104,100 | 1,000,600 | 346,900 | |||||||||
| 1971 | 309,600 | 477,100 | 458,200 | 85,100 | 971,500 | 634,900 | |||||||||
| 1981 | 301,500 | 458,400 | 409,400 | 70,900 | 895,700 | 728,900 | |||||||||
| 1991 | 249,100 | 431,500 | 420,500 | 55,000 | 746,100 | 707,300 | |||||||||
| 2001 | 237,900 | 423,800 | 471,400 | 45,200 | 631,800 | 715,400 | |||||||||
| 2011 | 263,500 | 397,400 | 501,600 | 36,200 | 565,400 | 626,600 | |||||||||
From the 1960s onwards, increasing diversity
During the first 100 years after Confederation, Canada also admitted immigrants from Asia (primarily China and Japan) and other parts of the world. Starting in the 1960s, when major amendments were made to Canada's immigration legislation and regulations, the number of immigrants from Asia and other regions of the world started to grow.
World events also led to the massive movement of refugees and migrants from different parts of the world to Canada. Examples include the arrival of 60,000 boat people from Vietnam, Cambodia and Laos in the late 1970s; 85,000 immigrants from the Caribbean and Bermuda (for example, Jamaica, Haiti, and Trinidad and Tobago) in the 1980s; 225,000 immigrants from Hong Kong over the 10 years leading up to its return to China by the United Kingdom in 1997; and 800,000 immigrants from the People's Republic of China, India and the Philippines in the 2000s.
According to the 2011 National Household Survey, Asia (including the Middle East) is now the main continent of origin of the immigrant population, although Africa's share has increased. As well, for the first time since Confederation, China and India (excluding the two special administrative regions, Hong Kong and Macao) have surpassed the United Kingdom as the country of birth most frequently reported by foreign-born people.
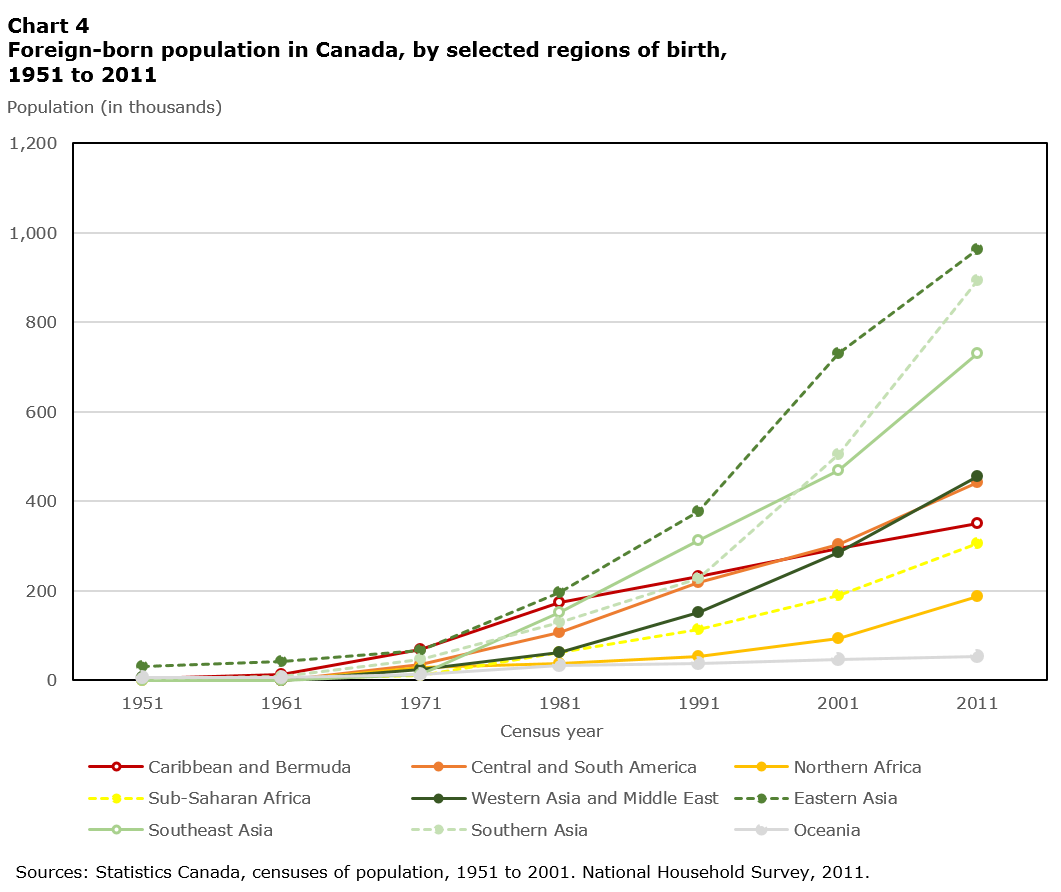
Description for Chart 4
| Area of interest | 1951 | 1961 | 1971 | 1981 | 1991 | 2001 | 2011 |
|---|---|---|---|---|---|---|---|
| Sources: Statistics Canada, censuses of population, 1951 to 2001. National Household Survey, 2011. | |||||||
| Caribbean and Bermuda | 4,400 | 12,400 | 68,100 | 173,200 | 232,500 | 294,100 | 351,400 |
| Central and South America | 3,100 | 0 | 36,000 | 106,800 | 219,400 | 304,700 | 442,700 |
| Northern Africa | 400 | 0 | 28,700 | 38,700 | 53,200 | 93,200 | 186,700 |
| Sub-Saharan Africa | >2,400 | 4,000 | 10,700 | 63,000 | 113,000 | 189,500 | 305,300 |
| Western Asia and Middle East | 6,500 | 0 | 25,200 | 63,200 | 151,100 | 285,600 | 456,000 |
| Eastern Asia | 30,800 | 43,500 | 66,600 | 195,500 | 377,200 | 730,600 | 962,600 |
| Southeast Asia | 800 | 0 | 13,100 | 152,200 | 312,000 | 469,100 | 729,800 |
| Southern Asia | 4,200 | 9,000 | 46,300 | 130,000 | 228,800 | 503,900 | 892,800 |
| Oceania | 6,100 | 6,700 | 14,300 | 33,000 | 38,000 | 47,900 | 54,500 |
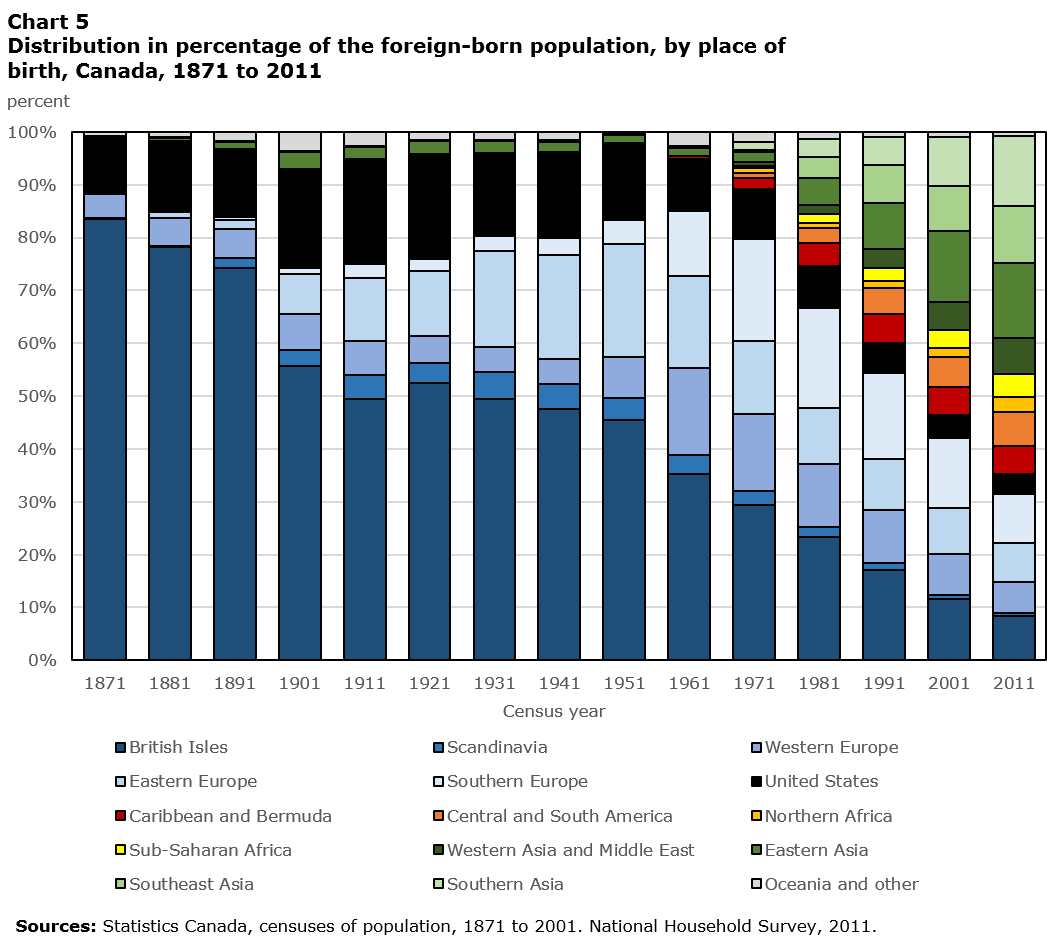
Description for Chart 5
| 1871 | 1881 | 1891 | 1901 | 1911 | 1921 | 1931 | 1941 | 1951 | 1961 | 1971 | 1981 | 1991 | 2001 | 2011 | |
|---|---|---|---|---|---|---|---|---|---|---|---|---|---|---|---|
| Country/Area Name | % | % | % | % | % | % | % | % | % | % | % | % | % | % | % |
| Sources: Statistics Canada, censuses of population, 1871 to 2001. National Household Survey, 2011. | |||||||||||||||
| Total - foreign-born population | 100.0 | 100.0 | 100.0 | 100.0 | 100.0 | 100.0 | 100.0 | 100.0 | 100.0 | 100.0 | 100.0 | 100.0 | 100.0 | 100.0 | 100.0 |
| British Isles | 83.6 | 78.1 | 74.2 | 55.8 | 49.4 | 52.4 | 49.4 | 47.6 | 45.5 | 35.2 | 29.5 | 23.3 | 17.2 | 11.6 | 8.3 |
| Scandinavia | 0.1 | 0.3 | 2.0 | 3.1 | 4.6 | 3.9 | 5.2 | 4.8 | 4.2 | 3.7 | 2.6 | 1.8 | 1.3 | 0.8 | 0.5 |
| Western Europe | 4.6 | 5.2 | 5.5 | 6.8 | 6.3 | 5.1 | 4.8 | 4.7 | 7.7 | 16.5 | 14.5 | 11.9 | 9.9 | 7.8 | 5.9 |
| Eastern Europe | 0.1 | 1.2 | 1.6 | 7.5 | 12.0 | 12.2 | 18.0 | 19.7 | 21.5 | 17.4 | 13.9 | 10.7 | 9.7 | 8.7 | 7.4 |
| Southern Europe | 0.1 | 0.2 | 0.5 | 1.1 | 2.6 | 2.3 | 3.0 | 3.3 | 4.5 | 12.2 | 19.3 | 19.0 | 16.3 | 13.1 | 9.2 |
| United States | 10.9 | 12.9 | 12.6 | 18.3 | 19.1 | 19.1 | 14.9 | 15.5 | 13.7 | 10.0 | 9.4 | 7.8 | 5.7 | 4.4 | 3.9 |
| Caribbean and Bermuda | 0.0 | 0.2 | 0.1 | 0.1 | 0.1 | 0.2 | 0.2 | 0.2 | 0.2 | 0.4 | 2.1 | 4.5 | 5.4 | 5.4 | 5.2 |
| Central and South America | 0.0 | 0.0 | 0.0 | 0.0 | 0.1 | 0.1 | 0.1 | 0.1 | 0.1 | 0.0 | 1.1 | 2.8 | 5.1 | 5.6 | 6.5 |
| Northern Africa | 0.0 | 0.0 | 0.0 | 0.0 | 0.0 | 0.0 | 0.0 | 0.0 | 0.0 | 0.0 | 0.9 | 1.0 | 1.2 | 1.7 | 2.8 |
| Sub-Saharan Africa | 0.0 | 0.0 | 0.0 | 0.0 | 0.1 | 0.1 | 0.1 | 0.1 | 0.1 | 0.1 | 0.3 | 1.6 | 2.6 | 3.5 | 4.5 |
| Western Asia and Middle East | 0.0 | 0.0 | 0.0 | 0.3 | 0.3 | 0.3 | 0.3 | 0.3 | 0.3 | 0.0 | 0.8 | 1.6 | 3.5 | 5.2 | 6.7 |
| Eastern Asia | 0.0 | 0.7 | 1.5 | 3.1 | 2.3 | 2.5 | 2.4 | 1.9 | 1.5 | 1.5 | 2.0 | 5.1 | 8.7 | 13.4 | 14.2 |
| Southeast Asia | 0.0 | 0.0 | 0.0 | 0.0 | 0.0 | 0.0 | 0.0 | 0.0 | 0.0 | 0.0 | 0.4 | 4.0 | 7.2 | 8.6 | 10.8 |
| Southern Asia | 0.0 | 0.1 | 0.1 | 0.2 | 0.3 | 0.2 | 0.2 | 0.2 | 0.2 | 0.3 | 1.4 | 3.4 | 5.3 | 9.2 | 13.2 |
| Oceania and other | 0.7 | 1.0 | 1.8 | 3.7 | 2.6 | 1.5 | 1.5 | 1.6 | 0.4 | 2.7 | 2.0 | 1.5 | 1.1 | 1.0 | 0.8 |
In summary, immigration has changed a great deal since Confederation, becoming the main driver of population growth in Canada. Each wave of immigrants has contributed, and continues to contribute, to the ethnic, linguistic and religious diversity of Canada’s population.
Definitions
Landed immigrant (or permanent resident): A person who has been granted the right to live permanently in Canada by immigration authorities, but who has not yet become a Canadian citizen through naturalization.
Foreign-born population (also referred to as immigrant population): In censuses, persons who are or have been landed immigrants or permanent residents in Canada. The foreign-born population includes Canadian citizens through naturalization; however, it does not include non-permanent residents or Canadian citizens by birth who were born abroad.
Non-permanent resident: A person in Canada who has a work or study permit, or who is a refugee claimant.
Emigrant: A Canadian citizen or immigrant who has left Canada to settle permanently in another country.
Place of birth: The name of the geographic location in which a person was born. The geographic location is specified according to the geographic boundaries current at the time of data collection, not the geographic boundaries at the time of birth.
References
Boyd, M. and M. Vickers. 2000. 100 years of immigration in Canada, Canadian Social Trends. Statistics Canada Catalogue no. 11-008.
Immigration, Refugees and Citizenship Canada. 2015. Canada: A History of Refuge. Website consulted on April 28, 2016.
Kelley, N. and M. Trebilcock. 1998. The Making of the Mosaic: A History of Canadian Immigration Policy, Toronto, Buffalo and New York, University of Toronto Press.
Statistics Canada. 2013. 2011 National Household Survey: Immigration and Ethnocultural Diversity in Canada. Catalogue no. 99-010-X.
Contact information
To enquire about the concepts, methods or data quality of this release, contact Social and Aboriginal Statistics—Client Services .
- Date modified: