
Trends in firearm-related violent crime in Canada, 2009 to 2020
by Mary Allen, Canadian Centre for Justice and Community Safety Statistics
Highlights
- Firearm-related violent crime represents a small proportion of police-reported violent crime in Canada, accounting for 2.8% of all victims of violent crime reported by police in 2020.
- In 2020, the first year of the COVID-19 pandemic, there were 8,344 victims of police-reported violent crime where a firearm was present during the commission of the offence, or a rate of 29 per 100,000 population. This rate was unchanged compared to 2019. This was not the case in all jurisdictions, however, as rates of firearm-related violent crime increased in some areas and decreased in others.
- Between 2019 and 2020, notable increases in rates of firearm-related violent crime were reported in southern rural British Columbia (+34%), the northern rural part of Ontario (+32%), rural Alberta (+32% in the North and +31% in the South), the Northwest Territories (+23%) and Nova Scotia (+22%).
- Between 2009 and 2013 the rate of victims of firearm-related violent crime in Canada decreased, which aligned with violent crime trends overall. However, rates of victims of firearm-related violent crime started an upward climb in 2014, with the largest documented increase between 2014 and 2015.
- This article examines firearm-related violent crime in the two six-year periods before and after the notable increase in 2015 (between 2009 to 2014 and 2015 to 2020) and shows that the increase occurred in most jurisdictions in Canada.
- Much of the increase in the rate of firearm-related crime between the two six-year periods was the result of a significant increase in the rate of firearm-specific violent offences of discharging a firearm with intent, pointing a firearm, and use of a firearm in an indictable offence.
- In 2020, police reported a total of 743 homicide victims in Canada or a rate of 1.95 per 100,000 population. For 277 of these victims, a firearm was used to commit the homicide (for a rate of 0.73 homicides per 100,000 population). After a gradual decrease between 2009 and 2013, the rate of firearm-related homicides has increased since 2013, with a single decline in 2018. As a result, the proportion of homicides that involved a firearm rose from 26% of all homicides in 2013 to 37% in 2020.
- Handguns were the most serious weapon present in the majority of firearm-related violent crimes both between 2009 and 2014 (59%) and between 2015 and 2020 (59%).
- Rates of firearm-related violent crime were higher in rural areas than in urban centres in most provinces, and were notably high in northern rural regions. However, firearm-related crime generally accounted for a higher proportion of violent crime in urban areas. As such, people living in some rural areas may be more at risk of firearm crime, but violent crime that occurs in urban areas is generally more likely to involve a firearm. In 2020, the only provinces where rural areas had lower rates of firearm-related crime than in urban areas were Prince Edward Island, Nova Scotia and Ontario.
- In 2020, more than six in ten (63%) of the firearm-related violent crime in urban areas involved handguns. In rural areas, the firearm present was most commonly a rifle or shotgun: 46% in the rural South and 39% in the rural North.
- In 2020, over four out of five (83%) victims of violent crime where a firearm was present were either not injured (61%) or they sustained a minor injury that required no professional medical treatment or only some first aid (22%). Victims of firearm-related violent crime were less likely to be injured than victims where no firearm was present, but were more likely to sustain a serious injury or die.
- The accused in firearm-related violent crimes was most frequently a stranger to the victim in 2020 (for 55% of male victims and 41% of female victims). This was driven, however, by firearm-related violent crime in urban areas.
- Overall, one in four (25%) female victims of firearm-related violent crime was victimized by a current or former spouse or other intimate partner. In contrast, 2.2% of male victims of firearm-related violent crime in 2020 were similarly victims of intimate partner violence. Instead, among victims, a higher proportion of males were victimized by a stranger, friend or casual acquaintance (83% versus 64% of females).
- For women, firearm-related intimate partner violence (IPV) was most frequent in rural areas. In 2020, there were 8.1 female victims of firearm-related IPV per 100,000 female population in the rural South, and 31 per 100,000 in the rural North (compared to 4.1 in urban areas). Firearm-related IPV accounted for nearly one-third (32%) of female victims in the rural South and 38% in the rural North. Although firearm-related IPV for male victims was also higher in rural areas, rates were low compared to females (1.4 per 100,000 males in the rural South, 2.8 per 100,000 in the rural North and 0.9 per 100,000 in urban areas).
- The majority of incidents involving a victim of firearm-related violent crime were solved (with at least one accused identified in the incident), with those in the rural North (83% in 2020) and rural South (72%) more often solved than those in urban areas (54%).
- Individuals accused in firearm-related violent crimes were predominantly male (87% in 2020). Male accused (88%) were more likely than females (82%) to be charged in the incident. Youth (aged 12 to 17 years) were less likely to be charged than young adults and older individuals.
- In 2020, among police services who reported information on organized crime or gang-related criminal activity, 6% of victims of firearm-related violent crime were victims in incidents that police identified as confirmed or suspected to be committed by, and for the benefit of, a criminal organization or street gang. Most (75%) of these victims were male.
In 2020, consistent with historical trends, violent Criminal Code offences accounted for about one in every five crimes that came to the attention of police. Firearm-related violent crime typically represents less than 3% of police-reported violent crime in Canada; nevertheless, it has a significant emotional and physical impact on victims, families and communities. Additionally, rates of firearm-related violence have seen a general increase over the past several years.
Concern about gun crime is long standing and a variety of approaches have been used to address it, including changes in legislation (see Text box 1). In April 2020, 22 people were killed in a mass shooting in Nova Scotia, the deadliest mass shooting in Canada in recent years. In particular, the Nova Scotia shooting led to a ban on assault-style firearms and renewed discussions around gun control and access to illegal weapons.
This Juristat article uses data from the Uniform Crime Reporting (UCR) Survey and the Homicide Survey to provide a detailed examination of recent trends in firearm-related crime in Canada and the characteristics of these crimes over time and by region. In this article, firearm-related violent crime refers to victims of violent crimes where the most serious weapon present in the incident was a firearm and where police deemed the presence of the firearm relevant to the incident. Of note, for an incident to be considered firearm-related, a firearm need only be present during the commission of the offence, not necessarily used. This measure does not include non-violent Criminal Code offences where a firearm was present, including administrative offences such as unsafe storage, or firearm-specific violent offences such as discharging a firearm with intent where there was no victim identified.
The article is divided into several sections beginning with an “Overview of firearm-related violent crime in 2020” examining geographic differences.Note This is followed by a section examining factors driving the change in firearm-related crime over 12 years, comparing two time periods (2009 to 2014 and 2015 to 2020) “Trends in firearm-related violent crime”. The article then examines the “Characteristics of firearm-related violent crime”, especially the types of violations involved and types of firearms present. This is followed by sections on “Characteristics of victims of firearm-related crime” as well as “Characteristics of individuals accused in violent incidents where a firearm was present”. Additional information is provided on non-violent weapons offences and firearm-related violent crimes involving organized crime or street gangs.
The article uses data from the UCR trend file which contains information from 2009 to 2020. The article compares pooled information for the two six-year periods (2009 to 2014 and 2015 to 2020) to examine factors related to the increased rates of firearm-related violent crime observed in recent years.Note Combining the data into two six-year periods allows for a detailed examination of changes related to this overall increase. The periods were defined with reference to 2015 (before and after 2015) as 2015 was the year with the most notable increase in firearm-related crime over the 12 year period and this increase occurred in most jurisdictions. Moreover, 2015 was a notable year for crime in general as it marked the first increase in all police-reported crime since 2003.
This article provides an analysis of police-reported firearm-related violent crime using currently available data. However, there are still many data gaps related to firearms used in crime. Statistics Canada has been working with police services to help improve information available on these types of crime (see Text box 2).
Start of text box 1
Text box 1
Firearm restrictions in Canada
The Criminal Code classifies firearms into three categories: prohibited, restricted, and non-restricted. Prohibited firearms include fully automatic firearms, sawed-off rifles and shotguns and other firearms prescribed to be prohibited in the regulations. Handguns are generally classified as restricted, while rifles and shotguns, also known as long-guns, are usually non-restricted.
Canadian law requires that an individual have a valid license under the Firearms Act (1995) in order to own or possess a firearm or to purchase ammunition. Various amendments have been made to the Criminal Code and the Firearms Act over the past decade. In 2012, Bill C-19 (Ending the Long-gun Registry Act) eliminated the registration of non-restricted firearms. Further amendments were later introduced related to restricted and prohibited weapons (Bill C-42, 2015) and to the licensing, tracing and transportation of firearms (Bill C-71, 2019).
In 2020, following the mass shooting in Nova Scotia, the federal government amended regulations by Order in Council to reclassify as prohibited over 1,500 models and variants of assault-style firearms, particularly semi-automatic rifles.
End of text box 1
Start of text box 2
Text box 2
Data gaps related to firearms
It is important to recognize that there are limitations in our knowledge about firearms used in crime. There is little information currently collected about the characteristics of these firearms, such as details about the exact type of gun, who owned it (e.g., accused, victim, or someone else), how it was stored, or whether the owner was licensed. In addition, while some police services collect information on shootings, there is no consistent definition of a shooting applied by police services in Canada, nor are there consistent criteria used to assess whether a shooting actually occurred (e.g., witness heard shots fired, bullet casings found).
Of particular concern, there is currently little information available to determine the source of firearms used in crime: for example, whether a gun used in a crime was stolen, illegally purchased or smuggled into the country. This information is sometimes not recorded by police services, recorded inconsistently or, in some cases, the information is simply not available. For example, not all firearms are recovered from firearm-related homicides; consequently, only some of these guns are available for tracing.Note The Royal Canadian Mounted Police (RCMP) Canadian National Firearms Tracing Centre and the Firearms Tracing and Enforcement database (FATE) administered by the Ontario Provincial Police provide support to law enforcement agencies when tracing information is required to support a criminal investigation or a prosecution. However, no province requires that investigators send all crime guns for tracing. Finally, success rates of firearm tracing can vary widely due to factors such as damaged or defaced serial numbers or firearms, the route of the firearm over its lifecycle, or method or area of manufacture.
Aside from information about crime guns, there are a number of additional gaps in our knowledge of the nature of firearm-related violence in Canada. The extent to which organized crime is involved in firearm-related violence is currently unclear. Patterns in the ethnicity, Indigenous identity (with the exception of homicide data), and socioeconomic characteristics of both victims and persons accused of firearm-related violence are also unknown.
In light of these data gaps, the Canadian Centre for Justice and Community Safety Statistics (CCJCSS) at Statistics Canada carried out a feasibility study in consultation with key stakeholders and identified information that could potentially be collected from police services using the Uniform Crime Reporting (UCR) Survey. Consequently, the CCJCSS has made a number of revisions to the UCR Survey starting in 2021. It should be noted that it may take a few years for these changes to be fully implemented by police services in a way that allows the reporting of this information to the UCR.
These changes include:
- collecting information on the number of firearms recovered, seized or stolen in a criminal incident;
- improving measures related to “shootings” by developing a standard definition to be used by police services and adding a variable to the UCR Survey to identify whether a firearm was discharged in an incident; and
- developing a standard definition for a “crime gun” to be used by police services to identify a) firearms (as defined under the Criminal Code) that are used or suspected to be used in the commission of a criminal offence, regardless of whether the firearm was possessed legally; or b) a firearm that has an obliterated, altered or removed serial number.
In addition to working to improve data collection for information directly related to firearms, going forward, Statistics Canada is also committed to working with the policing community and key organizations to enable police to report statistics on Indigenous and ethno-cultural groups in police-reported crime statistics for victims and accused persons (see Collection of data on Indigenous and ethno-cultural groups in Canada’s official police-reported crime statistics).
End of text box 2
Overview of firearm-related violent crime in 2020
This section provides an overview of firearm-related violent crime reported by police in 2020, with a discussion of geographic differences.
Firearm-related violent crime represents less than three percent of violent crime in Canada
Firearm-related violent crime represents a small proportion of police-reported violent crime in Canada. In 2020, police provided information on 8,344 victims in criminal incidents where a firearm was present (29 victims per 100,000 population or 2.8% of victims of violent crime).Note Another 21% of victims were involved in incidents where another weapon was the most serious weapon used or present, such as a knife or blunt instrument, or where physical force was used as the weapon or threat. That being said, just over three-quarters (77%) of victims of violent crimes involved an incident where no weapon was present.Note
Firearm-related violent crime highest in Saskatchewan, Manitoba and the Territories
As with violent crime generally, rates of firearm-related violent crime in 2020 were highest in Saskatchewan, Manitoba and the Territories (Table 1). The Northwest Territories and Nunavut had the highest rates, but rates in the Territories can vary considerably from year to year due to low counts and low populations. The high rates of firearm-related violent crime in Saskatchewan and Manitoba were mainly due to high rates of robbery and major assaults where a firearm was present.Note Among the provinces, Saskatchewan reported the second highest combined rate of firearm-related homicide and attempted murder in 2020 (second to Nova Scotia where the high rate was due to the mass shooting in April 2020).Note
However, because non-firearm-related violent crime was also high in the aforementioned areas, these high rates of firearm-related violent crime may be a reflection of overall high rates of violence (Table 2). For example, in 2020, rates of both firearm-related violent crime and violent crime where a firearm was not present were high in the Territories. As a result, the proportion of all incidents involving a firearm was relatively low (fewer than 2% in all three Territories). The provinces where the proportion of violent crime that was firearm-related was highest were Saskatchewan (3.9%), Alberta (3.4%) and Ontario (3.2%).
This was also the case among major cities. As in 2019, the census metropolitan areas (CMAs) with the highest rates of firearm-related violent crime in 2020 were Regina, Brantford, Winnipeg and Saskatoon (Table 3). However, the CMAs with the highest proportions of violent crimes where a firearm was present were Regina (5.5%), Brantford (4.8%), Toronto (4.6%), Saskatoon (4.3%), Winnipeg (4.2%) and Windsor (4.2%) (Table 4).
For some CMAs, high rates of firearm-related violent crime reflected overall high rates of violent crime in communities (Chart 1). This, however, was not always the case. For example, it is worth noting that Toronto had a relatively low rate of firearm-related violent crime, but these firearm-related crimes accounted for a relatively high proportion of all violent crime.
Chart 1 start
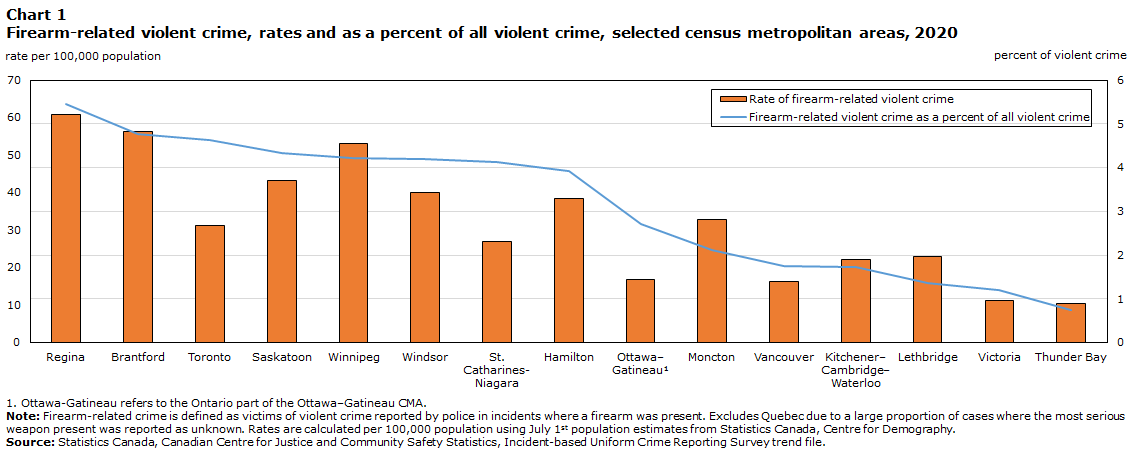
Data table for Chart 1
| Census Metropolitan Area | Firearm-related violent crime as a percent of all violent crime | Rate of firearm-related violent crime |
|---|---|---|
| percent of violent crime | rate per 100,000 population | |
| Regina | 5 | 61 |
| Brantford | 5 | 56 |
| Toronto | 5 | 31 |
| Saskatoon | 4 | 43 |
| Winnipeg | 4 | 53 |
| Windsor | 4 | 40 |
| St. Catharines- Niagara |
4 | 27 |
| Hamilton | 4 | 39 |
| Ottawa– GatineauData table for Chart 1 Note 1 |
3 | 17 |
| Moncton | 2 | 33 |
| Vancouver | 2 | 16 |
| Kitchener– Cambridge– Waterloo |
2 | 22 |
| Lethbridge | 1 | 23 |
| Victoria | 1 | 11 |
| Thunder Bay | 1 | 10 |
Source: Statistics Canada, Canadian Centre for Justice and Community Safety Statistics, Incident-based Uniform Crime Reporting Survey trend file. |
||
Chart 1 end
Rates of firearm-related violent crime higher in rural compared to urban areas in most provinces
Firearm-related crime in rural areas differs by province and territory. As in previous years, rates of firearm-related violent crime in 2020 were higher in rural areas than in urban centres in most provinces (Table 1). In 2020, the only provinces where rural areas had lower rates of firearm-related crime than in urban areas were Prince Edward Island, Nova Scotia and Ontario.Note A variety of factors can help to explain the higher rates in these areas. For example, more firearm ownership may contribute to higher rates in rural communities, as firearms may be required for hunting or farming, and therefore a firearm may be more often present when an offence is committed.
In many provinces, while rates of firearm-related violence were higher in rural areas (particularly in the rural North), violence that involved firearms was proportionally more frequent in urban areas (Table 2). In particular, in 2020, the urban jurisdictions where firearms were the most common (as a proportion of violent crimes) were urban centres in Saskatchewan (4.6% of violent crime), Manitoba (3.5%) and Ontario (3.4%).Note The rural areas where these proportions were the highest were in Alberta, where firearms were more frequently present in crime in southern rural areas (4.4%) and northern rural areas (3.8%), compared to urban areas (3.2%). Proportions were also high (over 3%) in rural Saskatchewan (3.5% in the rural South and 3.4% in the North), although lower than in urban areas.
Trends in firearm-related violent crime
Increase in firearm-related violent crime since 2013, with large increase in 2015 followed by a gradual climb
Between 2009 and 2013, the rate of victims of firearm-related violent crime in Canada decreased, following a similar trend in overall violent crime. However, firearm-related violent crime started an upward climb in 2014, with the largest increase documented between 2014 and 2015 (Chart 2, Table 1).
Chart 2 start

Data table for Chart 2
| Year | Firearm-related violent crime | All violent crime |
|---|---|---|
| rate of firearm-related violent crime per 100,000 population | rate of violent crime per 100,000 population | |
| 2009 | 29 | 1,262 |
| 2010 | 23 | 1,246 |
| 2011 | 22 | 1,148 |
| 2012 | 22 | 1,093 |
| 2013 | 19 | 994 |
| 2014 | 21 | 937 |
| 2015 | 25 | 956 |
| 2016 | 26 | 955 |
| 2017 | 28 | 983 |
| 2018 | 27 | 1,015 |
| 2019 | 29 | 1,106 |
| 2020 | 29 | 1,065 |
|
Note: Firearm-related crime is defined as victims of violent crime reported by police in incidents where a firearm was present. Excludes Quebec due to a large proportion of cases where the most serious weapon present was reported as unknown. Rates are calculated per 100,000 population using July 1st population estimates from Statistics Canada, Centre for Demography. Source: Statistics Canada, Canadian Centre for Justice and Community Safety Statistics, Incident-based Uniform Crime Reporting Survey trend file. |
||
Chart 2 end
The increase in 2015 was reflected in most jurisdictions. For this reason, this analysis compares average rates for the two six-year periods before and after the 2015 increase (2009 to 2014 and 2015 to 2020). Combining the data into two six-year periods (before and after the notable increase in 2015) allows for the examination of changes related to this overall increase.
Using this approach, the rate of firearm-related violent crime in Canada was found to be 20% higher in the six years from 2015 to 2020 than over the previous six years (2009 to 2014). Rates increased most in the rural North and South, with the highest rates reported in the rural North (Chart 3).Note
Chart 3 start
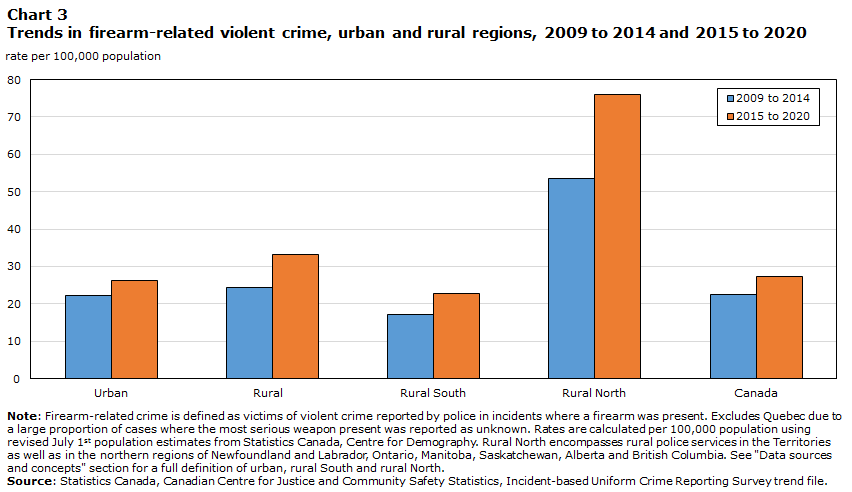
Data table for Chart 3
| Years | Rate of victims of firearm-related violent crime | ||||
|---|---|---|---|---|---|
| Urban | Rural | Rural South | Rural North | Canada | |
| rate per 100,000 population | |||||
| 2009 to 2014 | 22 | 24 | 17 | 53 | 23 |
| 2015 to 2020 | 26 | 33 | 23 | 76 | 27 |
|
Note: Firearm-related crime is defined as victims of violent crime reported by police in incidents where a firearm was present. Excludes Quebec due to a large proportion of cases where the most serious weapon present was reported as unknown. Rates are calculated per 100,000 population using revised July 1st population estimates from Statistics Canada, Centre for Demography. Rural North encompasses rural police services in the Territories as well as in the northern regions of Newfoundland and Labrador, Ontario, Manitoba, Saskatchewan, Alberta and British Columbia. See "Data sources and concepts" section for a full definition of urban, rural South and rural North. Source: Statistics Canada, Canadian Centre for Justice and Community Safety Statistics, Incident-based Uniform Crime Reporting Survey trend file. |
|||||
Chart 3 end
The largest increases between the two six-year periods examined in this study were seen in Saskatchewan (+93%), the Northwest Territories (+87%) and Manitoba (+44%).Note These jurisdictions also recorded higher average rates of firearm-related crime between 2015 and 2020 than elsewhere, along with Nunavut (Chart 4).
Chart 4 start
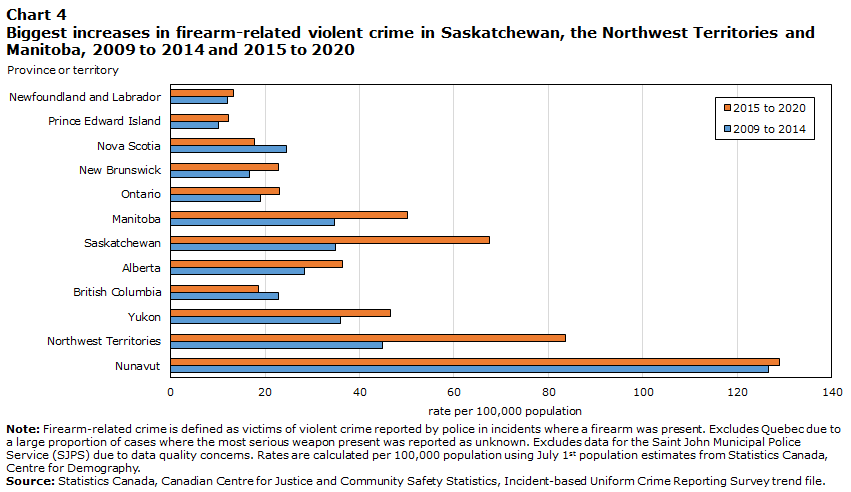
Data table for Chart 4
| Years | Nunavut | Northwest Territories | Yukon | British Columbia | Alberta | Saskatchewan | Manitoba | Ontario | New Brunswick | Nova Scotia | Prince Edward Island | Newfoundland and Labrador |
|---|---|---|---|---|---|---|---|---|---|---|---|---|
| rate per 100,000 population | ||||||||||||
| 2009 to 2014 | 127 | 45 | 36 | 23 | 28 | 35 | 35 | 19 | 17 | 25 | 10 | 12 |
| 2015 to 2020 | 129 | 84 | 47 | 19 | 36 | 67 | 50 | 23 | 23 | 18 | 12 | 13 |
|
Note: Firearm-related crime is defined as victims of violent crime reported by police in incidents where a firearm was present. Excludes Quebec due to a large proportion of cases where the most serious weapon present was reported as unknown. Excludes data for the Saint John Municipal Police Service (SJPS) due to data quality concerns. Rates are calculated per 100,000 population using July 1st population estimates from Statistics Canada, Centre for Demography. Source: Statistics Canada, Canadian Centre for Justice and Community Safety Statistics, Incident-based Uniform Crime Reporting Survey trend file. |
||||||||||||
Chart 4 end
Among Canada’s largest cities (CMAs), the biggest increases between the two time periods were reported in Regina (+136%), Brantford (+74%), Kingston (+59%) and Winnipeg (+55%). Toronto, which accounted for 22% of Canada’s victims of firearm-related violent crime in 2020, reported a 35% increase between the two time periods.
While rates of firearm-related violent crime increased in most jurisdictions, there were also notable declines between the two time periods reported in Nova Scotia (-27%) and British Columbia (-19%). Similarly, large decreases were reported in the CMAs of Halifax (-41%), Vancouver (-30%), Kelowna (-25%), Abbotsford–Mission (-24%), Victoria (-19%) and London (-17%). Much of this drop was due to a decline in robberies and major assaults where a firearm was present.Note
In 2020, the first year of the COVID-19 pandemic, there was no change in the rate of firearm-related crime nationally compared to 2019, but rates increased in some areas and decreased in others
At the national level, all measures of crime, including violent crime, declined in 2020, the first year of the COVID-19 pandemic (Moreau 2021). Between 2019 and 2020, there was no consistent change in rates of violent crime across the country. In 2020, the first year of the pandemic, violent crime increased in some jurisdictions and fell in others; this was also true of firearm-related crime. While the overall rate of victims of firearm-related violent crime in Canada remained unchanged at 29 per 100,000 population, there were some notable changes in certain jurisdictions.
Notable increases in rates of firearm-related violent crime were reported in 2020 in southern rural British Columbia (+34%), the northern rural part of Ontario (+32%), rural Alberta (+32% in the North and +31% in the South), the Northwest Territories (+23%) and Nova Scotia (+22%) (Table 1). The rate in urban Prince Edward Island increased 294%, from 3 to 12 victims. In Nova Scotia, some of the increase in firearm-related violent crime can be attributed to the multiple victim shooting incident in April 2020, as well as a 30% increase in the rate of firearm-related violent crime in Halifax (Table 3).
At the same time, rates of firearm-related violent crime fell substantially between 2019 and 2020 in Nunavut (‑49%), Newfoundland and Labrador (-20%), Manitoba (-16%) and urban Saskatchewan (-19%). Again, it is worth noting that rates can vary considerably in jurisdictions where the number of victims is small.Note That being said, increases were noted in 15 of Canada’s largest cities (CMAs) and decreases were reported in the 13 other CMAs included in the study.Note
Start of text box 3
Text box 3
Measuring firearm-related crime
This analysis primarily uses a definition of firearm-related violent crime based on the number of victims of violent offences where the most serious weapon present in the incident was a firearm and the police deemed its presence as relevant to the incident.Note Additional measures of crime involving firearms can also be calculated using other information provided by police.
Statistics Canada collects data on all crimes reported to the police through the Uniform Crime Reporting (UCR) Survey. The UCR collects a range of information related to firearms including: Criminal Code violations specific to firearms, whether a firearm was present in the commission of a violent offence and whether a victim sustained an injury caused by a firearm. Below are the specific details collected through the UCR.
Most serious weapon present: indicates the most serious weapon present and deemed by police to have been relevant during the commission of a violent crime, regardless of whether or not the weapon was used, and whether or not a victim was involved. This variable captures incidents where a firearm was used against a victim causing injury, used against a victim without causing injury (e.g., as a threat) or was present during the offence but was not used in any manner.
Weapon causing injury: indicates the type of weapon used during the commission of a violent offence if the victim suffered a physical injury.Note
In this article, firearm-related violent crime refers to victims of violent crimes in incidents where the most serious weapon present in the incident was a firearm and where police deemed the presence of the firearm relevant to the incident. Of note, for an incident to be considered firearm-related, a firearm need only be present during the commission of the offence, not necessarily used. It excludes violent offences such as discharging a firearm with intent where there was no victim identified.Note
In addition, firearm-specific violent offences refer to Criminal Code offences which, by definition, involve firearms. These include the offences of discharging a firearm with intent, pointing a firearm, or use of a firearm in the commission of an indictable offence. These offences may be examined where the firearm-specific violent offence is the most serious violation, or where it is any violation reported in a criminal incident. It should be noted that police are not required to provide a victim record for these offences.Note
The UCR collects information on violations identified in each criminal incident. One incident can involve multiple offences. In order to ensure comparability, the most serious offence in the incident is determined by a standard classification rule used by all police services. In addition, where there is a victim record, police report the most serious violation committed against the victim.Note As a result, it is possible to measure the number of victims of firearm-specific violent offences (the main method for this report) as well as incidents where a firearm-specific violent offence was reported as any violation in the incident.
A comparison of trends using these various measures shows similar trends in the number of victims of violent crime that in some way involve a firearm (Chart 5).Note
Chart 5 start
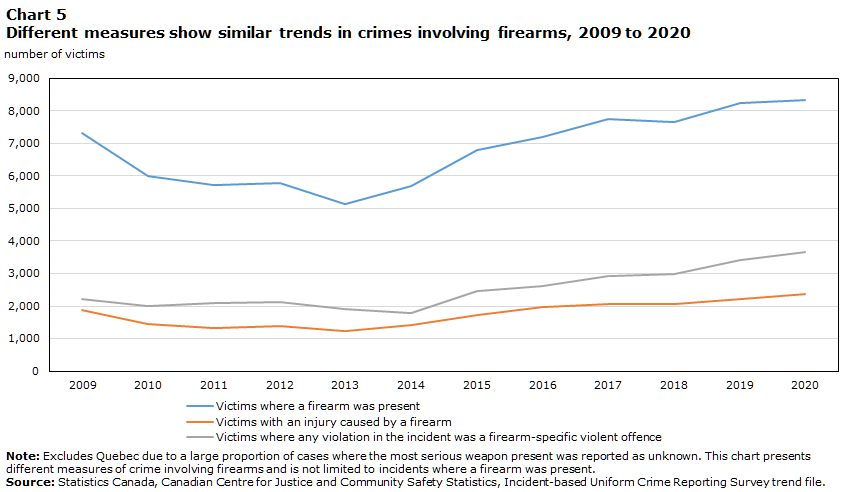
Data table for Chart 5
| Measure of firearm-related crime | 2009 | 2010 | 2011 | 2012 | 2013 | 2014 | 2015 | 2016 | 2017 | 2018 | 2019 | 2020 |
|---|---|---|---|---|---|---|---|---|---|---|---|---|
| number of victims | ||||||||||||
| Victims where a firearm was present | 7,305 | 5,997 | 5,707 | 5,776 | 5,126 | 5,681 | 6,809 | 7,201 | 7,744 | 7,648 | 8,256 | 8,344 |
| Victims with an injury caused by a firearm | 1,877 | 1,452 | 1,318 | 1,375 | 1,224 | 1,413 | 1,738 | 1,964 | 2,064 | 2,070 | 2,201 | 2,364 |
| Victims where any violation in the incident was a firearm-specific violent offence | 2,205 | 1,998 | 2,104 | 2,115 | 1,894 | 1,787 | 2,455 | 2,628 | 2,931 | 2,989 | 3,423 | 3,675 |
|
Note: Excludes Quebec due to a large proportion of cases where the most serious weapon present was reported as unknown. This chart presents different measures of crime involving firearms and is not limited to incidents where a firearm was present. Source: Statistics Canada, Canadian Centre for Justice and Community Safety Statistics, Incident-based Uniform Crime Reporting Survey trend file. |
||||||||||||
Chart 5 end
Information is also available for non-violent weapons offences, including those that involve firearms, such as illegal possession, unsafe storage of a firearm, weapons trafficking or improper documentation of a firearm.
In addition to these measures using the UCR, information is also collected through the Homicide Survey where a firearm (or other weapon) is used to commit the homicide (see Text box 4).
End of text box 3
Much of the increase in firearm-related violent crime due to increases in discharging a firearm with intent
Firearm-related violent crime between 2009 to 2014 and 2015 to 2020 increased in most jurisdictions in Canada and no specific geographic region disproportionately explains the change.
Similarly, the overall increase in firearm-related violent crime was not disproportionately impacted by the types of firearm present in these crimes. In both time periods, the majority (59%) of firearm-related violent crimes involved a handgun as the most serious firearm present, and these crimes accounted for a similar proportion of the increase (59%). In other words, there was no disproportionate increase in handgun crime to explain the growth of firearm crime overall.
However, an examination of the offences reported in these crimes shows that the increase in firearm-related violent crime reflects a notable change in the type of crimes these represent (Chart 6). Nationally, over half of the increase in the rate of firearm-related violent crime was due to a substantial increase (+96%) between the two time periods in the three firearm-specific violent offences: discharging a firearm with intent,Note pointing a firearm and use of a firearm in an indictable offence.Note Together, these violations accounted for 11% of victims of firearm-related violent crime between 2009 and 2014 and 19% between 2015 and 2020. More notably, victims of these offences have increased from less than one in ten (8%) firearm-related violent crimes in 2009 to more than one in five in 2019 (21%) and in 2020 (22%). In particular, the average rate of discharging a firearm with intent was more than three times higher between 2015 and 2020 compared to the earlier period (increasing from 0.63 per 100,000 population to 2.07). The increase in this specific violation accounted for almost one-third of the overall increase in firearm-related violent crime between the two periods.
Chart 6 start
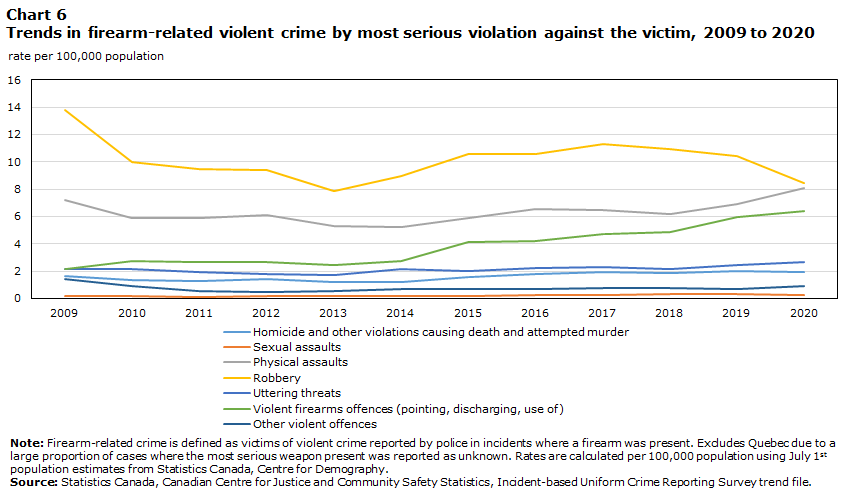
Data table for Chart 6
| Most serious violation against the victim | 2009 | 2010 | 2011 | 2012 | 2013 | 2014 | 2015 | 2016 | 2017 | 2018 | 2019 | 2020 |
|---|---|---|---|---|---|---|---|---|---|---|---|---|
| rate per 100,000 population | ||||||||||||
| Homicide and other violations causing death and attempted murder | 1.7 | 1.3 | 1.3 | 1.4 | 1.2 | 1.2 | 1.5 | 1.8 | 1.9 | 1.9 | 2.0 | 1.9 |
| Sexual assaults | 0.2 | 0.2 | 0.1 | 0.2 | 0.2 | 0.2 | 0.2 | 0.2 | 0.2 | 0.3 | 0.3 | 0.3 |
| Physical assaults | 7.2 | 5.9 | 5.9 | 6.1 | 5.3 | 5.2 | 5.9 | 6.5 | 6.5 | 6.2 | 6.9 | 8.1 |
| Robbery | 13.8 | 10.0 | 9.5 | 9.4 | 7.8 | 8.9 | 10.6 | 10.6 | 11.3 | 10.9 | 10.4 | 8.4 |
| Uttering threats | 2.2 | 2.2 | 1.9 | 1.8 | 1.7 | 2.1 | 2.0 | 2.2 | 2.3 | 2.1 | 2.4 | 2.7 |
| Violent firearms offences (pointing, discharging, use of) | 2.2 | 2.8 | 2.7 | 2.7 | 2.5 | 2.7 | 4.1 | 4.2 | 4.7 | 4.8 | 6.0 | 6.4 |
| Other violent offences | 1.4 | 0.9 | 0.5 | 0.5 | 0.5 | 0.7 | 0.7 | 0.7 | 0.8 | 0.7 | 0.7 | 0.9 |
|
Note: Firearm-related crime is defined as victims of violent crime reported by police in incidents where a firearm was present. Excludes Quebec due to a large proportion of cases where the most serious weapon present was reported as unknown. Rates are calculated per 100,000 population using July 1st population estimates from Statistics Canada, Centre for Demography. Source: Statistics Canada, Canadian Centre for Justice and Community Safety Statistics, Incident-based Uniform Crime Reporting Survey trend file. |
||||||||||||
Chart 6 end
In addition to the increase in firearm-specific violent offences, there were increases in the presence of firearms for all major categories of violent offences. In particular, changes in the rates of firearm-related robberies had an impact on firearm-related violent crime in many jurisdictions.
It is important to note that police are not required to provide information on victims for these firearm-specific violent offences as well as some other violent offences. Because the measure of firearm-related crime is based on victim counts, the reporting of victim information by police services and any changes in those reporting practices will have an impact on the results. For example, part of the increase in victims of firearm-specific violent offences observed in 2015 can be attributed to improvements made in the reporting of victim information for these offences by the Toronto Police Service (TPS). In particular, for incidents involving discharging a firearm with intent, prior to 2013, the TPS did not provide information on victims of this offence. Starting in 2013, the TPS made improvements to their reporting on these incidents which were fully implemented in 2015. While this change in reporting has a notable impact on the increase in the number of victims of firearm-specific violent offences reported, the impact on national rates of firearm-related violent crime overall was relatively small.
Notable increase in rates of firearm-specific violent offences, especially discharging a firearm with intent
The firearm-specific violent offences referred to in this article are discharging a firearm with intent (Criminal Code section 244), pointing a firearm (Criminal Code s. 87) and the use of a firearm in the commission of an indictable offence (Criminal Code s. 85). The large increase in these offences between the two periods was driven primarily by increased rates of discharging a firearm with intent, for which rates increased considerably in 2014 and 2015 and then continued to climb, along with the rate of victims of pointing a firearm. While the largest increase in firearm-specific violent offences occurred in 2015, rates continued to increase thereafter (Chart 7). Between 2015 and 2020, rates of victims of these offences increased 55% nationally.
Chart 7 start
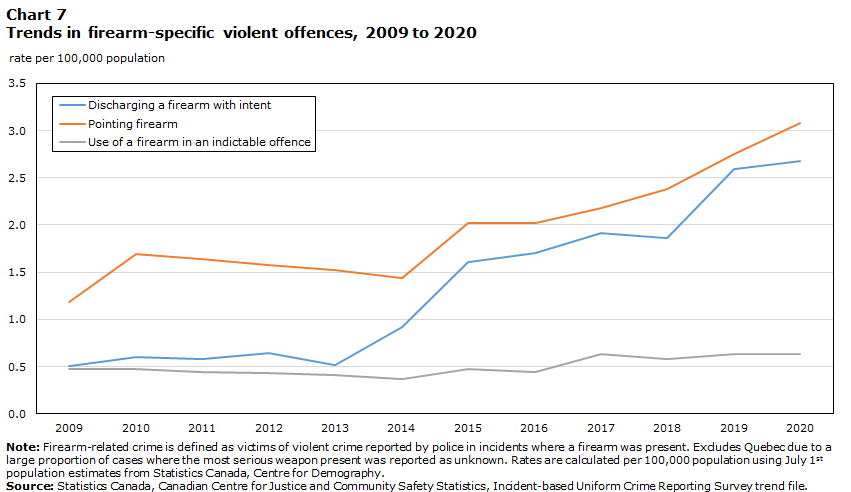
Data table for Chart 7
| Firearm-specific violent offence | 2009 | 2010 | 2011 | 2012 | 2013 | 2014 | 2015 | 2016 | 2017 | 2018 | 2019 | 2020 |
|---|---|---|---|---|---|---|---|---|---|---|---|---|
| rate per 100,000 population | ||||||||||||
| Discharging a firearm with intent | 0.5 | 0.6 | 0.6 | 0.6 | 0.5 | 0.9 | 1.6 | 1.7 | 1.9 | 1.9 | 2.6 | 2.7 |
| Pointing firearm | 1.2 | 1.7 | 1.6 | 1.6 | 1.5 | 1.4 | 2.0 | 2.0 | 2.2 | 2.4 | 2.8 | 3.1 |
| Use of a firearm in an indictable offence | 0.5 | 0.5 | 0.4 | 0.4 | 0.4 | 0.4 | 0.5 | 0.4 | 0.6 | 0.6 | 0.6 | 0.6 |
|
Note: Firearm-related crime is defined as victims of violent crime reported by police in incidents where a firearm was present. Excludes Quebec due to a large proportion of cases where the most serious weapon present was reported as unknown. Rates are calculated per 100,000 population using July 1st population estimates from Statistics Canada, Centre for Demography. Source: Statistics Canada, Canadian Centre for Justice and Community Safety Statistics, Incident-based Uniform Crime Reporting Survey trend file. |
||||||||||||
Chart 7 end
The increase in firearm-specific violent offences before and after 2015 was greatest in urban areas. Over half of the increase in this category of offence was reported in urban areas in Ontario (an increase of 244% between the two periods). As noted above, changes in the reporting of victim records by the Toronto Police Service explain some of this change. Increases in Hamilton and Windsor also had an impact.
There were also notable increases (more than doubling) in urban areas in Manitoba (+167%), Saskatchewan (+129%) and Alberta (+105%).Note Rates of these offences also more than doubled in northern rural Newfoundland and Labrador (+181%) and northern rural Saskatchewan (+132%). At the same time, there was a decline between the two periods in urban areas in Nova Scotia (-14%) and British Columbia (-4%).Note
In 2020, four in ten victims of firearm-related violent crime were victims of an incident involving a firearm-specific violent offence
In 2020, police reported 1,858 victims where a firearm-specific violent offence was the most serious violation against the victim (22% of firearm-related violent crime). In addition, for another 1,568 victims of firearm-related violent crime (19%), a firearm-specific violent offence was identified as another violation in the incident.Note Most of this latter group were victims of a major assault (levels 2 or 3) (37%) or robbery (31%).Note
In total, police reported information on 3,426 victims where there was a firearm-specific violent offence reported as any violation in the incident. Of these, 1,200 victims of firearm-related violent crime were in an incident involving discharging a firearm with intent (14% of all victims of firearm-related crime).Note
For one-third (33%) of victims where any violation was a firearm-specific violent offence, the incident also involved a non-violent weapons offence, primarily for possession of a weapon.
For 1.9% of victims of firearm-related crime in 2020, there was also a drug violation reported in the incident. Where any violation in the incident was a firearm-specific violent offence, the proportion of crimes involving a drug offence was similar (2.2%).
Two-thirds of victims (66%) where any violation was a firearm-specific violent offence had no physical injury. Another 19% sustained minor injuries not requiring medical treatment other than first aid, and 9% sustained a major injury.Note Overall, among those who sustained injuries, a firearm was most often the cause of the injury (for 70% where the injury was minor and 89% where it was a major injury).
Compared to firearm-related crimes generally, injuries were more frequent when discharging a firearm was reported as any violation in the incident: about half (51%) of these victims had no injury, 22% sustained a minor injury and 19% a major injury.Note In addition, when injured, a firearm was more often the cause of the injury (81% for minor injuries and 98% for major injuries) compared to all victims of firearm-related crime. See the section on “Characteristics of victims of firearm-related violent crime” for a more general discussion of injuries among victims of firearm-related crime.
Characteristics of firearm-related violent crime
This section focusses on the characteristics of firearm-related violent crime, examining the types of offences involved, with a particular focus on homicides committed with a firearm (Text box 4). It also examines the types of firearm present and how this differs in urban and rural regions. A text box on non-violent firearm offences is also provided (Text box 5).
Majority of firearm-related violent crime is robbery or major assault
The majority of victims of firearm-related violent crime in Canada in 2020 were victims of robbery (29%) or major assault (23%).Note Firearm-specific violent offences accounted for another 22% of victims of firearm-related violent crime.Note
Among all offences other than those specific to firearms, the violations that were most likely to involve a firearm were homicides and other violations causing death and attempted murder (45% in 2020, combined) and robberies (18% in 2020; Table 5). Moreover, as with firearm-related violent crime overall, firearms have become more common in these crimes. The proportion of homicides and other violations causing death and attempted murder involving a firearm grew from 36% of victims of these offences between 2009 and 2014 to 43% between 2015 and 2020. Among robberies, the proportion involving the presence of a firearm increased from 14% to 19%. Among major assaults, there was little change (3.2% to 3.3%).
Firearms were present less often among other violent offences, accounting for 2.2% of victims of uttering threats in 2020, and less than 1% of sexual offences, common assault and other assaults.
Start of text box 4
Text box 4
Firearm-related homicides
In addition to information from the Uniform Crime Reporting (UCR) Survey, Statistics Canada also collects information on homicides in Canada in a separate survey. This text box uses data from the Homicide Survey, including detailed information on the characteristics of victims and accused as well as gang-related homicides. This section also includes information on firearm-related homicides reported in Quebec.
In 2020, police reported a total of 743 homicide victims in Canada or a rate of 1.95 per 100,000 population. For 277 of these victims, a firearm was used to commit the homicide (for a rate of 0.73 homicides per 100,000 population). After a gradual decrease between 2009 and 2013, the rate of firearm-related homicides has increased since 2013, with a single decline in 2018 (Chart 8). As a result, the proportion of homicides that involved a firearm rose from 26% of all homicides in 2013 to 37% in 2020.
Chart 8 start

Data table for Chart 8
| Type of homicide | 2009 | 2010 | 2011 | 2012 | 2013 | 2014 | 2015 | 2016 | 2017 | 2018 | 2019 | 2020 |
|---|---|---|---|---|---|---|---|---|---|---|---|---|
| number of homicide victims | ||||||||||||
| Homicides committed with a firearm | 182 | 175 | 159 | 171 | 134 | 155 | 180 | 223 | 267 | 251 | 262 | 277 |
| All other homicides | 429 | 382 | 449 | 377 | 375 | 369 | 431 | 393 | 400 | 409 | 425 | 466 |
|
Note: Other homicides include homicides committed with any other weapon (e.g., knife, club, blunt instrument), as well as homicides committed without the use of a weapon (e.g., physical force). Includes homicides where the weapon used was unknown. Source: Statistics Canada, Canadian Centre for Justice and Community Safety Statistics, Homicide Survey. |
||||||||||||
Chart 8 end
In 2020, the province with the highest rate of firearm-related homicide was Nova Scotia (2.45) due to the mass shooting in April 2020, which accounted for 22 homicide victims. This mass shooting had a significant impact on the firearm-related homicide number and rate in both Nova Scotia and nationally. Among the provinces, Saskatchewan (1.53) and Alberta (1.31) also reported high rates of firearm-related homicides in 2020 (Table 6; Table 7).Note Between 2019 and 2020, the rate of firearm-related homicides in Canada increased 5% (with 15 additional victims). This increase was driven primarily by the increases in Nova Scotia and Alberta. In contrast, almost every other province saw decreases in the number of firearm-related homicides.
Between 2009 to 2014 and 2015 to 2020, there was a 40% increase in the rate of firearm-related homicides, a greater increase than what was observed for firearm-related violent crime overall (+20%). This increase was greatest in the rural North (+54%) and in urban areas (+43%). While increases were reported in most provinces, the most notable increases between the two periods were in Saskatchewan (+165%) and New Brunswick (+138%).Note Note In contrast, rates of firearm-related homicides decreased between the two time periods in Newfoundland and Labrador (-70%), Prince Edward Island (-53%) and Quebec (-5%).Note
Handguns were the most common type of firearm in homicides in both time periods in this study, but they were proportionally less frequently used in homicides between 2015 and 2020 (54%) than in the previous six-year period (63%). Instead, the proportion of homicides committed with a rifle or shotgun increased between the two time periods (from 28% to 31% of firearm-related homicides). This shift occurred in urban as well as rural areas. However, it is worth noting that, as with firearm-related violent crime generally, handguns were much more likely to be used in firearm-related homicides in urban areas (62% between 2015 and 2020) than in the rural South (22%) or rural North (9%).
Among homicides that had been solved, there were notable differences between male and female victims of firearm-related homicides when it came to the relationship of the accused to the victim. Between 2015 and 2020, among male victims of firearm-related homicides, the accused was most often a friend, neighbour or casual acquaintance (40%), shared a criminal relationship (24%) or was a stranger (23%) to the victim.Note Female victims, however, were more likely to be victims of intimate partner violence, as the accused was most often a current or former spouse (41%) or other intimate partner (14%). Another 15% of female victims were victims of another family member, 14% were victims of a friend, neighbour or casual acquaintance and 11% were killed by a stranger. Females were more likely to be killed by a spouse, intimate partner or other family member in the rural South (84% combined) and the rural North (81%), compared to urban areas (62%).
Between 2015 and 2020, about seven in ten firearm-related homicides in urban areas (73%) and in the rural South (69%) were premeditated (first-degree murder). This was less common in the rural North (54%), where proportionally more homicides were second-degree murder (41% compared to 25% in urban areas and in the rural South). This pattern reflects regional differences in homicides generally.
In urban areas, where a motive was identified, almost half (46%) of firearm-related homicides between 2015 and 2020 were motivated by a settling of accounts or debts, or related to illegal drug trade activities (compared to 19% in the rural South and 17% in the rural North).Note In rural areas, homicides resulting from an argument or quarrel, or frustration, anger or despair were proportionally more frequent than in urban areas (50% in the rural South and 53% in the rural North compared to 25% in urban areas).
Almost three-quarters (72% or 107 homicides) of the 148 gang-related homicides reported in 2020 were committed with a firearm, the lowest proportion since 2013.Note Put differently, gang activity was confirmed or suspected in 39% of all firearm-related homicides. Overall, gang-related homicides committed with a firearm represented 14% of all homicides in 2020, compared to 20% the year before and 19% in 2018.
Most (63%) gang firearm-related homicides in 2020 were committed with a handgun. In both periods examined in this report, a handgun was the most common firearm used in gang-related firearm-related homicides, but they were proportionally fewer after 2015 (76% of gang-related homicides between 2009 and 2014 and 67% between 2015 and 2020). Instead, rifles or shotguns (9% between 2009 and 2014 compared to 14% in the later period) or an unknown type of firearm (from 14% to 19% in the later period) became more common in gang-related homicides committed with a firearm.Note
In 2020, the firearm was recovered in just 39% of firearm-related homicides (109 of 277 firearm-related homicides). Of those where the firearm was recovered, 69% were sent for tracing. For 60% of the 75 firearms sent for tracing in 2020, the origin was unknown, meaning they had either not received the results or the trace was unsuccessful. Another 18.7% originated from Canada, 18.6% from the US and 2.7% from other countries.
Nationally, firearm-related homicides account for about one in five firearm-related fatalities. According to the 2019 vital statistics death database (the latest year for which figures are available), there were a total of 708 deaths in Canada from firearm-related injuries compared to 680 in 2018. Among these, 75% were suicides, 23% were homicides and 2% were classified as accidental (Statistics Canada 2020).
End of text box 4
Firearm-related violent crimes in urban areas most often involve handguns, while rifles or shotguns are more often used in rural areas
In 2020, for most victims of firearm-related violent crime in urban areas (63%) and in most CMAs, the incident involved handguns (Table 8).Note Handguns were the most common firearm present in Toronto (86% of firearm-related violent crime), Windsor (80%), Ottawa (78%) and Barrie (78%). The CMAs with the highest rates of handgun-related crime were Windsor, Brantford, Hamilton, Toronto and Winnipeg (Table 9).
In contrast, rifles and shotguns were most frequently present in the commission of a firearm-related violent crime in rural areas (46% in the rural South and 39% in the rural North). While rates of handgun-related crimes were generally higher in urban areas than in rural areas, the highest rates of handgun-related crime in Canada were reported in northern Saskatchewan, which is all rural, and the Northwest Territories. Moreover, rates of handgun-related crime in Canada’s rural North were considerably higher between 2015 and 2020 compared to the previous six-year period (Chart 9).
Chart 9 start
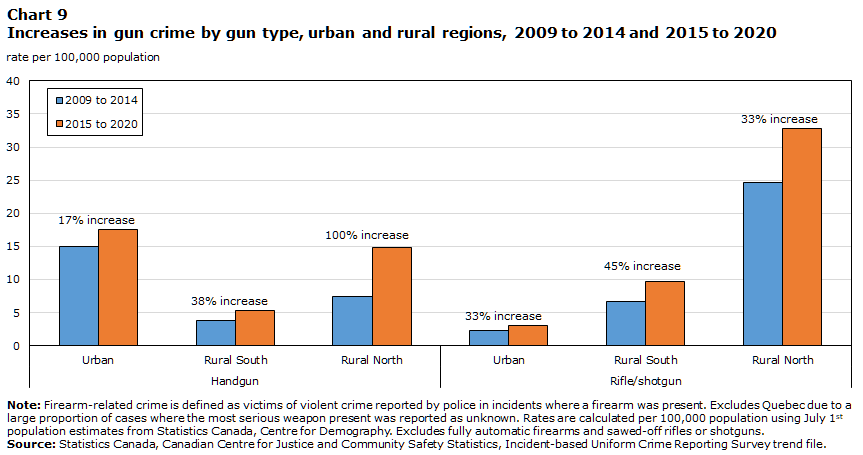
Data table for Chart 9
| Gun type | Region | 2009 to 2014 | 2015 to 2020 |
|---|---|---|---|
| rate per 100,000 population | |||
| Handgun | Urban | 15 | 18 |
| Rural South | 4 | 5 | |
| Rural North | 7 | 15 | |
| Rifle/shotgun | Urban | 2 | 3 |
| Rural South | 7 | 10 | |
| Rural North | 25 | 33 | |
|
Note: Firearm-related crime is defined as victims of violent crime reported by police in incidents where a firearm was present. Excludes Quebec due to a large proportion of cases where the most serious weapon present was reported as unknown. Rates are calculated per 100,000 population using July 1st population estimates from Statistics Canada, Centre for Demography. Excludes fully automatic firearms and sawed-off rifles or shotguns. Source: Statistics Canada, Canadian Centre for Justice and Community Safety Statistics, Incident-based Uniform Crime Reporting Survey trend file. |
|||
Chart 9 end
Crimes involving other firearms (i.e., sawed-off rifles or shotguns, or fully automatic firearms) were relatively rare, accounting for 5% of firearm-related violent crime in urban areas, 8% in the rural South, and 5% in the rural North.
Other firearm-like weapons, such as a pellet gun or flare gun, or an unknown type of firearms, accounted for 23% of firearm-related violent crime in Canada in 2020. These were also proportionally more frequent in the rural South (29%) and rural North (32%) than in urban areas (20%). Between 2009 to 2014 and 2015 to 2020, rates of crimes involving firearm-like weapons increased 6% in urban areas, 4% in the rural South and 26% in the rural North.
In 2020, handguns accounted for the majority of firearm-related violent crime in robberies (75% in 2020), homicides, other violations causing death and attempted murders (60% combined), sexual offences (54%) and firearm-specific violent offences (51%) (Table 10).
Start of text box 5
Text box 5
Non-violent weapons offences
Not all crime involving firearms is classified as violent according to police reported data. In addition to the information on weapons present in the commission of a violent criminal offence, the Uniform Crime Reporting (UCR) Survey also captures information on non-violent weapons offences, including those that involve firearms, such as illegal possession, unsafe storage of a firearm, weapons trafficking or improper documentation of a firearm. In 2020, police reported more than 17,000 non-violent weapons offences.Note This represented 60 incidents per 100,000 population, a 3% increase from 2019. The vast majority (92%) of these violations were offences related to illegal possession of weapons and breach offences for weapons possession contrary to an order.
Rates of weapons possession offences have been increasing since 2013 (Chart 10). Other non-violent weapons offences declined or remained stable over this period, with the exception of weapons trafficking, including unauthorized importing or exporting, which increased in both 2019 and 2020.
Chart 10 start
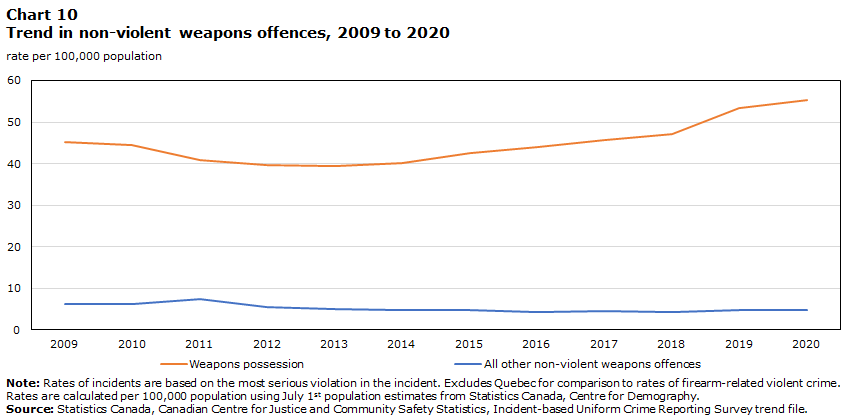
Data table for Chart 10
| Non-violent weapon offences | 2009 | 2010 | 2011 | 2012 | 2013 | 2014 | 2015 | 2016 | 2017 | 2018 | 2019 | 2020 |
|---|---|---|---|---|---|---|---|---|---|---|---|---|
| rate per 100,000 population | ||||||||||||
| Weapons possession | 45.3 | 44.4 | 40.8 | 39.6 | 39.5 | 40.2 | 42.5 | 44.0 | 45.6 | 47.1 | 53.4 | 55.2 |
| All other non-violent weapons offences | 6.2 | 6.3 | 7.4 | 5.6 | 5.1 | 4.8 | 4.8 | 4.4 | 4.5 | 4.2 | 4.8 | 4.9 |
|
Note: Rates of incidents are based on the most serious violation in the incident. Excludes Quebec for comparison to rates of firearm-related violent crime. Rates are calculated per 100,000 population using July 1st population estimates from Statistics Canada, Centre for Demography. Source: Statistics Canada, Canadian Centre for Justice and Community Safety Statistics, Incident-based Uniform Crime Reporting Survey trend file. |
||||||||||||
Chart 10 end
Rates of non-violent weapons offences higher in the rural North
As with the rates of firearm-related violent crime which were three times higher in the rural North than in urban areas in 2020, rates of non-violent weapons offences were similarly higher in these areas (Text table 1). Overall, rates of police-reported weapons offences were not notably different in the rural South than in urban areas. However, compared to urban areas, rates of unsafe storage of a firearm were 3.5 times higher in the rural South and eight times higher in the rural North.
| Violation | Urban | Rural South | Rural North | Canada |
|---|---|---|---|---|
| rate | ||||
| Weapons possession | 52.5 | 51.2 | 151.3 | 55.2 |
| Unsafe storage | 1.8 | 6.1 | 13.9 | 2.6 |
| Trafficking import export | 0.7 | 1.1 | 2.0 | 0.8 |
| Other weapons offences | 1.2 | 2.5 | 4.3 | 1.4 |
| Total | 56.2 | 60.9 | 171.5 | 60.1 |
|
Note: Rates are calculated per 100,000 population using revised July 1st population estimates from Statistics Canada, Centre for Demography. Source: Statistics Canada, Canadian Centre for Justice and Community Safety Statistics, Incident-based Uniform Crime Reporting Survey trend file. |
||||
Breaking and entering to steal a firearm has been dropping since 2016
In 2020, there were 713 incidents of breaking and entering where the incident was specifically committed in order to steal a firearm. This represented a rate of 2.4 incidents per 100,000 population and includes breaking and entering to steal a firearm as well as specifically breaking and entering a motor vehicle in order to steal a firearm. Rates of these offences increased between 2009 and 2016, from 291 incidents reported in 2009 to 1,111 incidents reported in 2016. Since then rates have been generally decreasing (Chart 11).
Chart 11 start

Data table for Chart 11
| Violation | 2009 | 2010 | 2011 | 2012 | 2013 | 2014 | 2015 | 2016 | 2017 | 2018 | 2019 | 2020 |
|---|---|---|---|---|---|---|---|---|---|---|---|---|
| rate per 100,000 population | ||||||||||||
| Break and enter to steal a firearm | 1.1 | 2.0 | 2.3 | 2.8 | 2.8 | 3.0 | 3.6 | 4.0 | 3.5 | 3.1 | 3.2 | 2.4 |
|
Note: Rates of incidents are based on the most serious violation in the incident. Includes the Criminal Code offences of break and enter to steal a firearm and break and enter of a motor vehicle to steal a firearm. Excludes Quebec for comparison to rates of firearm-related crime. Rates are calculated per 100,000 population using July 1st population estimates from Statistics Canada, Centre for Demography. Source: Statistics Canada, Canadian Centre for Justice and Community Safety Statistics, Incident-based Uniform Crime Reporting Survey trend file. |
||||||||||||
Chart 11 end
End of text box 5
Characteristics of victims of firearm-related violent crime
This section examines the age and gender of victims of firearm-related violent crime, as well as whether they were injured. In addition, it looks at the relationship of the accused to the victim, with a focus on intimate partner violence (IPV).
Most victims of firearm-related violent crime are male, but female victims account for a higher proportion of victims in rural than in urban areas
Victims of violent crimes involving firearms were more often male. In 2020, male victims accounted for two-thirds (67%) of victims of firearm-related violent crime (Table 11).Note In comparison, among victims of non-firearm-related violent crime, 46% were male and 54% were female. In rural areas, victims of firearm-related crime were more likely to be female (39% in both the rural South and the rural North) than in urban areas (31%).
There was little difference in the age distribution of female and male victims, with 36% of male victims and 34% of female victims under 25 years of age. However, male and female victims of firearm-related violent crime were more likely to be young adults aged 18 to 24 years (25% of male and 22% of female victims) compared to victims where no firearm was present (15% and 18%, respectively).
Most victims of firearm-related violent crime sustain no injuries
Overall, most victims of violent crime were not injured, and very few injuries resulting from violent crime were caused by firearms. In 2020, there were almost 122,000 victims of violent crime who sustained injuries as a result of their victimization;Note of these, almost 2,000 (1.6%) had injuries caused by a firearm.
In 2020, over four in five (83%) victims of firearm-related violent crime (where a firearm was present) either had no injury (61%) or sustained a minor injury that required no professional medical treatment or only some first aid (22%) (Table 12).Note Among victims where no firearm was present, 54% had no injury and 37% sustained a minor injury. Although victims of firearm-related crime were less likely to be injured than victims where no firearm was present, they were more likely to sustain a serious injury or die (Chart 12).Note
Among victims of firearm-related violent crime who did sustain an injury or die, the majority (71%) of injuries were caused by a firearm.Note For victims where no firearm was present, the most common cause of an injury or death was physical force (73% of injured victims). Even among victims of firearm-related crime who sustained a minor injury requiring no medical attention, the majority (61%) were caused by a firearm. For the 8% of victims who experienced a serious injury requiring medical treatment, 85% had injuries caused by a firearm. Almost all (99%) deaths in firearm-related violent crimes were caused by a firearm.
Overall, in 2020, among victims of firearm-related violent crime, 32% of male and 20% of female victims sustained an injury caused by a firearm. There was a small increase in the proportion of victims of firearm-related violent crime who were injured by a firearm, from 24% between 2009 and 2014 to 27% between 2015 and 2020.
Chart 12 start

Data table for Chart 12
| Level of injury | Firearm present | No firearm present |
|---|---|---|
| percent | ||
| No injury | 61 | 54 |
| Minor injury | 22 | 37 |
| Serious injury or death | 11 | 2 |
| Unknown injury | 6 | 7 |
|
Note: Firearm-related crime is defined as victims of violent crime reported by police in incidents where a firearm was present. Excludes Quebec due to a large proportion of cases where the most serious weapon present was reported as unknown. A minor injury is defined as a physical injury that required no professional medical treatment or only some first aid. No injury includes victims where no injury was reported whether or not a weapon or physical force was used. Injury is considered unknown when the extent of injuries to the victim could not be determined though weapons or physical force were used against the victim. Chart for no firearm present includes victims where presence of a firearm was unknown. Source: Statistics Canada, Canadian Centre for Justice and Community Safety Statistics, Incident-based Uniform Crime Reporting Survey trend file. |
||
Chart 12 end
Perpetrator in firearm-related violent crime most frequently a stranger in 2020
The perpetrator in firearm-related violent crimes was most frequently a stranger to the victim (for 55% of male victims and 41% of female victims) (Table 13; Chart 13).Note This was driven, however, by the nature of firearm-related violent crime in urban areas. Instead, in the rural South, the perpetrator was a stranger to 31% of male victims and 22% of female victims; in the rural North, the perpetrator being a stranger was even less common (23% and 14%, respectively). This may be related to the fact that many communities in the rural North are relatively small and strangers are fewer.
Chart 13 start
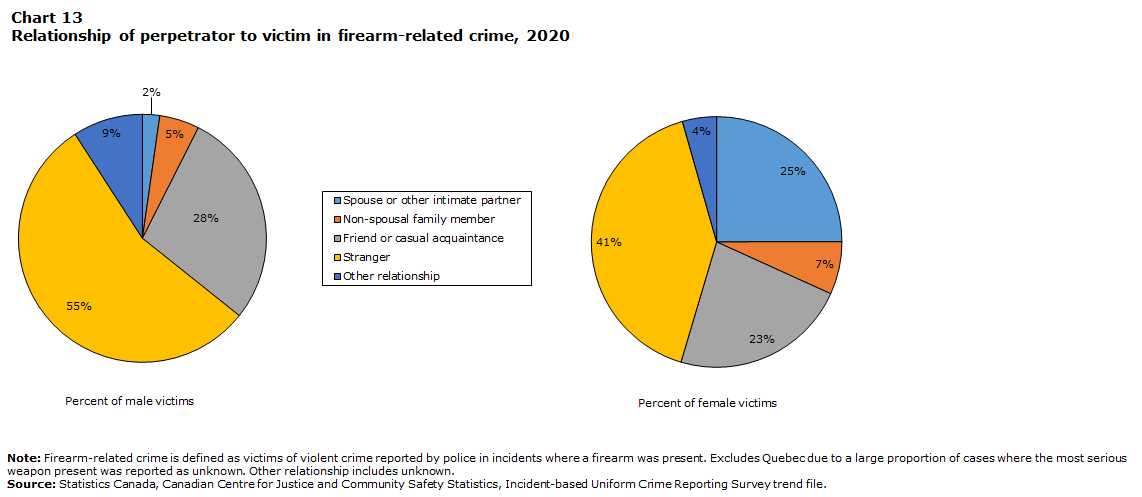
Data table for Chart 13
| Relationship of accused to victim | Male victims | Female victims |
|---|---|---|
| percent | ||
| Spouse or other intimate partner | 2 | 25 |
| Non-spousal family member | 5 | 7 |
| Friend or casual acquaintance | 28 | 23 |
| Stranger | 55 | 41 |
| Other relationship | 9 | 4 |
|
Note: Firearm-related crime is defined as victims of violent crime reported by police in incidents where a firearm was present. Excludes Quebec due to a large proportion of cases where the most serious weapon present was reported as unknown. Other relationship includes unknown. Source: Statistics Canada, Canadian Centre for Justice and Community Safety Statistics, Incident-based Uniform Crime Reporting Survey trend file. |
||
Chart 13 end
In the rural North, the perpetrator was frequently a friend or acquaintance (for 44% of male victims and 28% of female victims in 2020). However, as with violent crime generally and compared with other regions, the perpetrator in the rural North was more often a family member other than a spouse: 13% of male victims of firearm-related violent crime and 15% of females were victimized by a non-spousal family member.
Perpetrators in firearm-related violent crimes were more likely to be a stranger compared to those in crimes where no firearm was present in the incident. Among victims of non-firearm-related crime, the perpetrator was identified as a stranger for 35% of male and 15% of female victims. Of these crimes, the perpetrator was much more likely to be a spouse or other intimate partner or a non-spousal family member for both male and female victims.
One in four female victims of firearm-related violent crime victimized by a current or former spouse or other intimate partner
Overall, 1% of violent crimes committed by a current or former spouse or other intimate partner in 2020 were firearm-related. Female victims in incidents where a firearm was present were more likely than males to be victims of intimate partner violence (IPV) in all regions, but most notably in rural areas.
One in four (25%) female victims of firearm-related violent crime were victimized by a current or former spouse or other intimate partner. In contrast, 2.2% of male victims of firearm-related violent crime in 2020 were similarly victims of intimate partner violence. In contrast, a higher proportion of victims of non-firearm-related violent crime were victimized by a spouse or other intimate partner (42% of female and 13% of male victims). This is partially attributable to the fact that comparatively fewer non-firearm-related violent crimes are committed by strangers.
It is worth noting that, for both male and female victims of firearm-related violent crime, the proportion involving IPV was higher in 2020 than in previous years. In particular, the proportional increase between 2019 and 2020 was the result of an increase in the number of victims of IPV combined with a drop in number of victims where the perpetrator was a stranger, possibly the result of pandemic restrictions. During the six-year period from 2009 to 2014, 18% of female and 1.6% of male victims of firearm-related violent crime were victims of IPV. On average, between 2015 and 2020, 22% of female and 1.7% of male victims of firearm-related violent crime were victims of IPV.
For women, firearm-related IPV was most frequent in rural areas. In 2020, there were 8.1 female victims of firearm-related IPV per 100,000 female population in the rural South, and 31 per 100,000 in the rural North (compared to 4.1 in urban areas). IPV accounted for nearly one-third (32%) of female victims of firearm-related crime in the rural South and 38% in the rural North. This was also the pattern in previous years. Although IPV for male victims was also higher in rural areas, rates were low compared to females (1.4 per 100,000 males in the rural South, 2.8 in the rural North and 0.9 in urban areas).Note
About half (48%) of firearm-related intimate partner violence in 2020 involved physical assault (34% major assaults levels 2 or 3), 17% were firearm-specific violent offences, and another 15% were uttering threats. In contrast, 47% of firearm-related violent crimes committed by a stranger were incidents of robbery.
Characteristics of individuals accused in violent incidents where a firearm was present
This section presents information on the clearance (or solve) rates for firearm-related violent crime. It then examines the characteristics of individuals accused in incidents where a firearm was present (regardless of whether information on a victim was provided), including the proportion of accused who were charged.
Clearance rates for firearm-related violent crime lower in urban than in rural areas
The majority (58%) of incidents involving a victim of firearm-related violent crime are solved (with at least one accused identified in the incident). However, this differs by region. In 2020, 83% of firearm-related violent crimes in the rural North and 72% in the rural South were solved or cleared. Clearance rates were notably lower in urban areas (54%), for all types of offences. Between the two time periods in this analysis, there was little change in the percentage of firearm-related violent crimes that were cleared by police. Only in the rural South was there a decline in the proportion of firearm-related crime cleared by police (from 83% between 2009 and 2014 to 79% between 2015 and 2020).
It should be noted that crimes are generally less likely to be solved in urban areas, not just when a firearm is present. These differences may be related to community size. Previous analysis has shown that clearance rates decrease as community size increases (Hotton Mahony and Turner 2012). In smaller, rural communities, for example, police officers may be more likely to know the individuals involved and can therefore clear or solve the case.
The fact that the accused in urban areas was more likely to be a stranger and that rates of family and IPV were higher in rural areas could also play a role. In this context, clearance rates for firearm-related violent crime were highest where the perpetrator was a family member (82% in 2020) and lowest where the perpetrator was a stranger (46%).
Individuals accused in firearm-related violent crime more often male
In 2020, 5,955 individuals were accused in police-reported violent incidents where a firearm was present.Note Individuals accused in firearm-related violent crimes were predominantly male (87% in 2020), and this proportion differed little by region (Table 14). In comparison, 77% of individuals accused in non-firearm-related violent crime in 2020 were male.
As in other years, rates of firearm-related violent crime in 2020 were highest among young males aged 18 to 24 years (110 accused per 100,000 population) and male youth aged 12 to 17 (75 per 100,000) compared to older male adults (29 per 100,000 aged 25 and older). Rates among women followed the same pattern, but were notably lower across all age groups (Table 14). In all, there were 5 female accused per 100,000 females compared to 36 male accused per 100,000 males of all ages.
Although rates of males accused in non-firearm-related violent crime also followed a similar age pattern, they tended to be older: 44% of males accused in firearm-related violent crimes in 2020 were between 12 and 24 years of age compared to 24% in non-firearm-related violent crimes. This was also the case for females, where 42% of female accused in firearm-related violent crimes were under age 25 compared with 31% in non-firearm-related crime.
Overall, 38% of all individuals accused in firearm-related violent crimes in Canada in 2020 were young males 12 to 24 years of age. In contrast, among individuals accused in violent crimes where no firearm was present, 19% were males under age 25.
Between 2009 and 2014, half (50%) of individuals accused in firearm-related crimes in Canada were young males (12 to 24 years of age) compared to 43% over the period between 2015 and 2020. For non-firearm-related violent crime, young men accounted for 27% of accused between 2009 and 2014 and 22% in the later period. Over time, these proportions have been declining in part because of an overall decline in youth crime during this period.
In Canada, children under the age of 12 cannot be held criminally responsible for violations of the law. They can, however, be identified by police as accused. There were 23 children “accused” of firearm-related crimes in 2020, comprising less than 0.5% of individuals accused in firearm-related violent crime.Note
Most individuals accused in firearm-related violent crimes are charged
Most (87%) individuals who were accused in firearm-related violent crime in 2020 were charged. Male accused (88%) were more likely than females (82%) to be charged. Youth (aged 12 to 17 years) were less likely to be charged than young adults or older individuals (Table 15).Note Youth were least likely be charged in firearm-related incidents of common assault or uttering threats.
For all age groups, males accused in firearm-related crime were less likely to be charged in rural areas, both North and South. Among female accused, charging rates did not differ notably by region.
Start of text box 6
Text box 6
Firearm-related violent crimes involving organized crime or street gangs
The Uniform Crime Reporting (UCR) Survey started collecting information from police on organized crime and street gang activity in 2016.Note While not all police services are yet able to provide this information, as of 2020, police services representing 93% of the Canadian population did so.
In 2020, where this information was reported, 6% of firearm-related violent crimes were identified by police as confirmed or suspected to be committed by, and for the benefit of, a criminal organization or street gang.Note In these incidents, most (75%) of the victims involved were male.
Homicide, other violations causing death, and attempted murder (combined) accounted for over one quarter (27%) of firearm-related crimes that were identified as confirmed or suspected to have been committed for the benefit of organized crime or gang activity. Robbery (22%) and discharging a firearm with intent (21%) were the next most frequent offences.Note For information specific to gang-related homicides, see “Firearm-related homicides”.
Less than half (47%) of these crimes were cleared by police, with an accused identified. Firearm-related organized or gang-related crimes were least likely to be solved for discharging a firearm with intent (43%), homicide, other violations causing death, or attempted murder (34% combined) and uttering threats (30%).
In 2020, 343 individuals, or 6% of those accused in firearm-related crimes, were accused in incidents that police confirmed or suspected to be committed by, and for the benefit of a criminal organization or street gang. As with firearm-related crime generally, most (85%) of these accused were male, 45% of which were aged 12 to 24. Most (92%) of these individuals were charged.
End of text box 6
Summary
In 2020, 2.8% of victims of violent crime were victimized in a firearm-related incident, that is, an incident where a firearm was present and police deemed it was relevant to the crime. Though firearms are present in a minority of criminal incidents, the rate of firearm-related violent crime has been increasing in recent years.
Between 2009 and 2013 the rate of victims of firearm-related violent crime in Canada decreased, following a similar trend in violent crime overall. However, starting in 2014, rates of victims of firearm-related violent crime increased notably, with the largest increase between 2014 and 2015. This increase has been observed across most jurisdictions in Canada.
Much of the increase observed can be attributed to increases in certain types of crime, most notably, the Criminal Code offences of discharging a firearm with intent, pointing a firearm and use of a firearm in an indictable offence, which nearly doubled between the two-time periods examined in this study, 2009 to 2014 and 2015 to 2020.
Many characteristics of firearm-related violent crime have remained consistent over the 12-year time frame examined in this study. For example, handguns continue to account for the majority of firearms present in firearm-related violent crime.
The nature of firearm-related violent crime is quite different between urban and rural areas in Canada. In urban areas, firearm-related violent crime most commonly involves handguns, while in rural areas, the firearm present is most commonly a rifle or shotgun.
Generally speaking, while the accused person is most often a stranger in incidents of firearm-related violent crime, this was less often the case in rural areas. Of note, one in four women who were victims of a firearm-related violent crime in 2020 were victimized by a current or former spouse or other intimate partner, compared with 2% of men.
Statistics Canada continues to work with police services across the country to improve data on firearm-related violent crime. One relevant improvement is the development of standard classification of data involving street crime and organized gang activity. In 2020, data from police services covering 93% of the population of Canada found that 6% of victims of firearm-related violent crime were involved in an incident linked to a criminal organization or street gang.
Detailed data tables
Table 4 Victims of police-reported violent crime, by type of weapon, census metropolitan areas, 2020
Data sources and concepts
Uniform Crime Reporting Survey
The Uniform Crime Reporting (UCR) Survey was established in 1962 with the co-operation and assistance of the Canadian Association of Chiefs of Police. The survey is a compilation of police-reported crimes that have been reported to federal, provincial/territorial and municipal police services in Canada.
One incident can involve multiple offences. Counts of victims presented in this article are based upon the most serious violation against the victim. The most serious violation is determined by police according to standardized classification rules in the UCR which consider, for instance, whether or not the offence is violent as well as the maximum penalty imposed by the Criminal Code.
Incident-based Uniform Crime Reporting Survey trend file
The Incident-based Uniform Crime Reporting (UCR2) Survey trend file is a microdata survey that captures detailed information on crimes reported to and substantiated by police, including the characteristics of victims, accused persons and incidents. Coverage from the UCR2 between 2009 and 2020 is estimated at 99% of the population of Canada and includes only those police services who have consistently responded to the survey in order to allow for comparisons over time.
Quebec is excluded from the analysis of Uniform Crime Reporting Survey data in this study due to data quality issues; specifically, there was a large proportion of incidents where the most serious weapon present was reported as unknown. As a result, the analysis of data from the UCR in this article represents 77.4% of the total Canadian population.
Excludes data for the Saint John Municipal Police Service (SJPS). Starting in 2016, the decision was taken by the Canadian Centre for Justice and Community Safety Statistics in communication with the SJPS, to remove all microdata records submitted by SJPS (with the exception of their hate crime incidents) from analytical files for revised 2016 data onwards, as well as from the microdata trend file which begins in 2009, due to data quality concerns.
Homicide Survey
The Homicide Survey collects police-reported data on the characteristics of all homicide incidents, victims and accused persons in Canada. The Homicide Survey began collecting information on all homicides in 1961.
Whenever a homicide becomes known to police, the investigating police service completes the survey questionnaires, which are then sent to Statistics Canada. There are cases where homicides become known to police months or years after they occurred. These incidents are counted in the year in which they become known to police. Information on persons accused of homicide are only available for solved incidents (i.e., where at least one accused has been identified). Accused characteristics are updated as homicide cases are solved and new information is submitted to the Homicide Survey.
Information collected through the victim and incident questionnaires are also updated accordingly as a result of a case being solved.
The Homicide Survey recently underwent a redesign to improve data quality and enhance relevance. Changes were made to existing questions and additional questions have been added for the 2019 reporting period.
Urban and rural regions
Rural police services are those where the majority of the population served lives outside of a census metropolitan area (CMA) or census agglomeration (CA). Urban police services are those where the majority of the population lives within a CMA or CA. A CMA or a CA is formed by one or more adjacent municipalities centered on a population centre (known as the core). A CMA requires a total population of at least 100,000 of which 50,000 or more must live in the core. A CA must have a core population of at least 10,000. To be included in the CMA or CA, other adjacent municipalities must have a high degree of integration with the core, as measured by commuting flows derived from previous census place of work data, where 50% or more of the population commutes into the core. It should be noted that information was not available for all police services to determine whether they were rural or urban.
Rural North and rural South: Rural North includes all rural police services in the Territories or in the Provincial North. Provincial North encompasses the northern regions of Newfoundland and Labrador, Quebec, Ontario, Manitoba, Saskatchewan, Alberta and British Columbia (North and South - Variant of SGC 2016). Rural South refers to rural police services in the southern regions of these provinces as well as Prince Edward Island, Nova Scotia and New Brunswick.
Types of firearm
For the purposes of the UCR and Homicide Surveys, a firearm is any barrelled weapon from which any shot, bullet, or other missile can be discharged and is capable of causing serious bodily injury or death to a person. Different types of firearms are distinguished as such by the two surveys (presented in descending order of seriousness according to the hierarchy for determining most serious weapon):
Fully automatic firearm: Any firearm that allows continuous and rapid firing of bullets with one pull of the trigger.
Sawed-off rifle or shotgun: Any rifle or shotgun with a barrel length which has been altered to less than 457 millimetres, or with an overall weapon length of less than 660 millimetres.
Handgun: Any firearm designed to be held and fired by the action of one hand.
Rifle or shotgun: Any long-barrelled firearm with a barrel length greater than or equal to 457 millimetres, or with an overall length of 660 millimetres or more.
Firearm-like weapon: Any weapon capable of propelling any object through a barrel by means of gunpowder, compressed carbon dioxide, pumped air, or any other means. Includes, for example, flare guns or pellet guns. For UCR data, this category also includes all unknown types of firearms.
References
Hotton Mahony, T. and J. Turner. 2012. “Police-reported clearance rates in Canada, 2010.” Juristat. Statistics Canada Catalogue no. 85-002-X.
Moreau, G. 2021. “Police-reported crime statistics in Canada, 2020.” Juristat. Statistics Canada Catalogue no. 85-002-X.
Statistics Canada. 2020. Table 13-10-0156-01. Deaths, by cause: External causes of morbidity and mortality (V01 to Y89).
- Date modified: