
Police-reported hate crime in Canada, 2020

Archived Content
Information identified as archived is provided for reference, research or recordkeeping purposes. It is not subject to the Government of Canada Web Standards and has not been altered or updated since it was archived. Please "contact us" to request a format other than those available.
Description: Police-reported hate crime in Canada, 2020
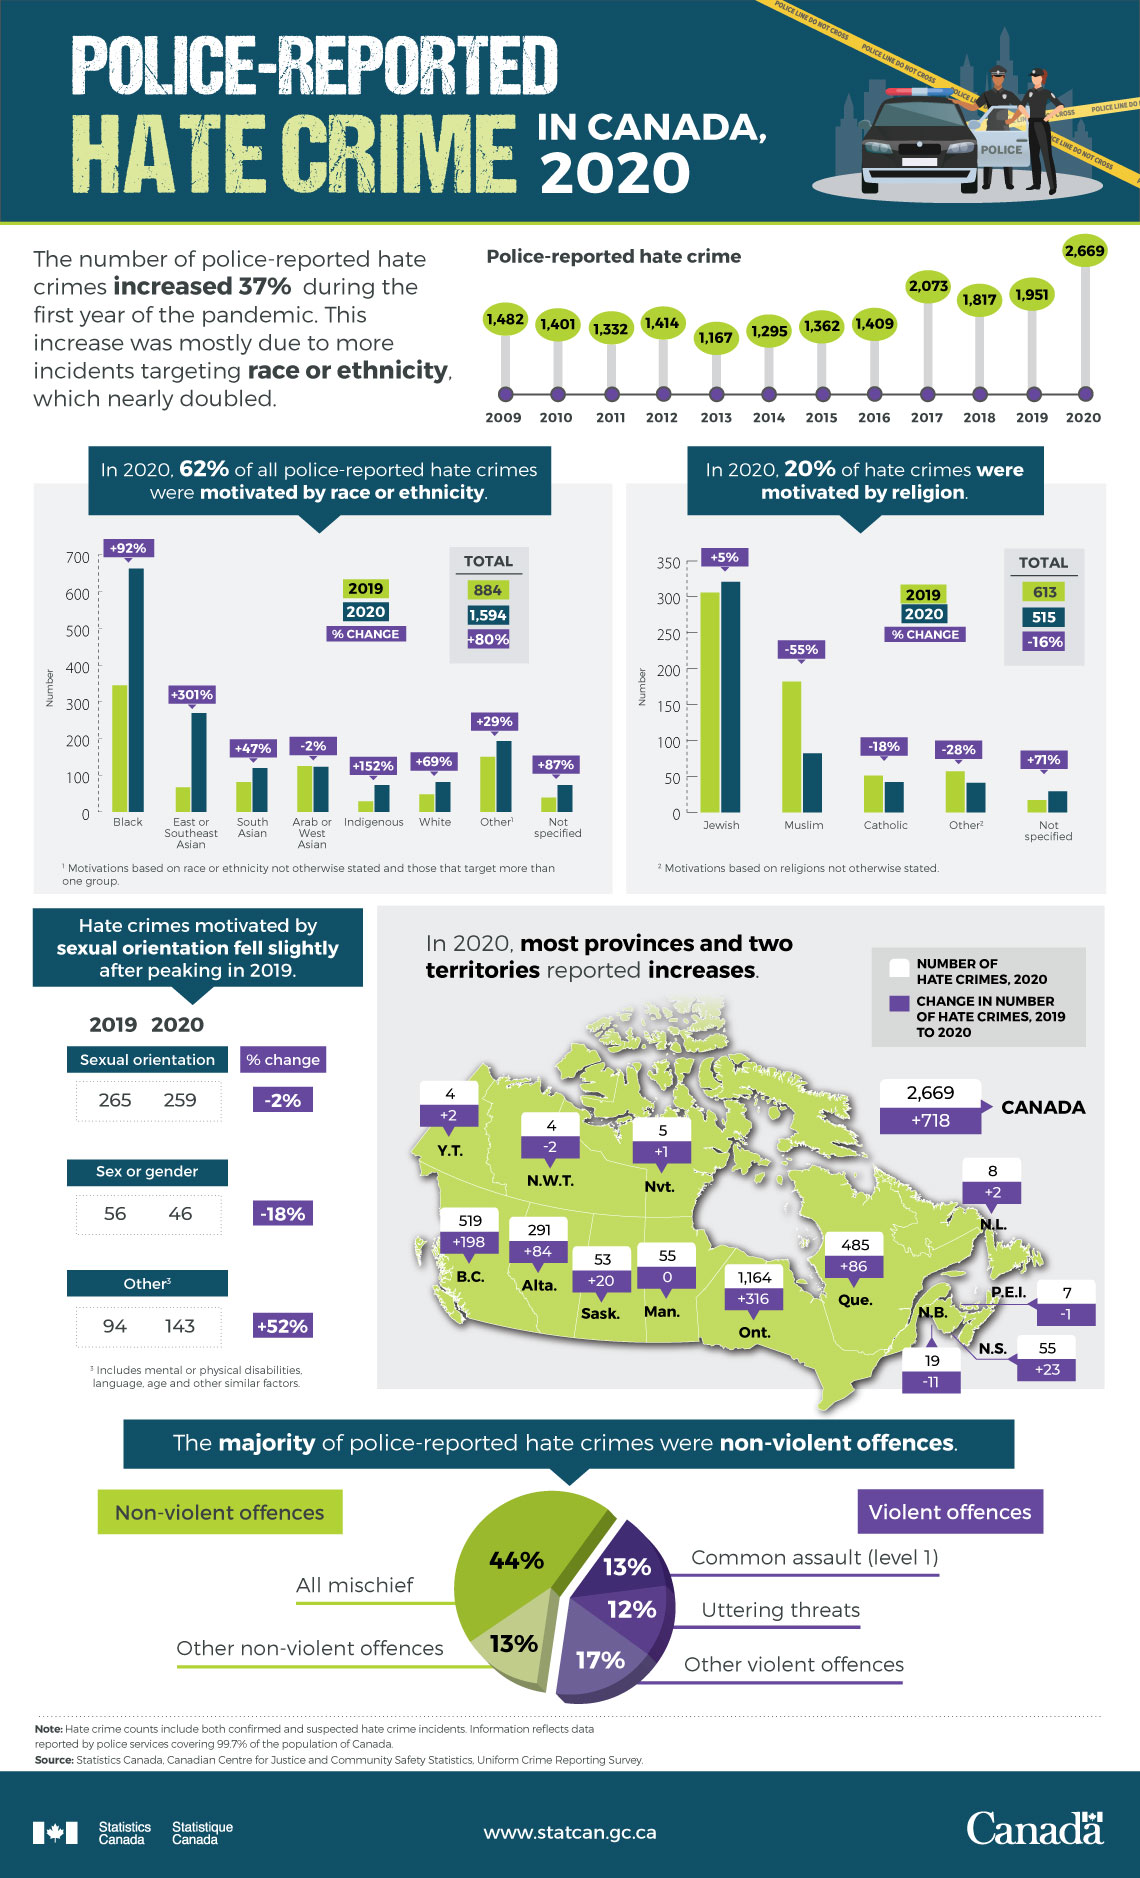
The number of police-reported hate crimes increased 37% during the first year of the pandemic. This increase was mostly due to more incidents targeting race or ethnicity, which nearly doubled.
| Year | Number |
|---|---|
| 2009 | 1,482 |
| 2010 | 1,401 |
| 2011 | 1,332 |
| 2012 | 1,414 |
| 2013 | 1,167 |
| 2014 | 1,295 |
| 2015 | 1,362 |
| 2016 | 1,409 |
| 2017 | 2,073 |
| 2018 | 1,817 |
| 2019 | 1,951 |
| 2020 | 2,669 |
In 2020, 62% of all police-reported hate crimes were motivated by race or ethnicity.
| Race/ethnicity | 2019 | 2020 | Percentage change |
|---|---|---|---|
| number | |||
| Black | 345 | 663 | +92 |
| East or Southeast Asian | 67 | 269 | +301 |
| South Asian | 81 | 119 | +47 |
| Arab or West Asian | 125 | 123 | -2 |
| Indigenous | 29 | 73 | +152 |
| White | 48 | 81 | +69 |
| OtherTable 2 Note 1 | 150 | 193 | +29 |
| Not specified | 39 | 73 | +87 |
| Total | 884 | 1,594 | +80 |
|
|||
In 2020, 20% of hate crimes were motivated by religion.
| Religion | 2019 | 2020 | Percentage change |
|---|---|---|---|
| number | |||
| Jewish | 306 | 321 | +5 |
| Muslim | 182 | 82 | -55 |
| Catholic | 51 | 42 | -18 |
| OtherTable 3 Note 1 | 57 | 41 | -28 |
| Not specified | 17 | 29 | +71 |
| Total | 613 | 515 | -16 |
|
|||
Hate crimes motivated by sexual orientation fell slightly after peaking in 2019.
| Motivation | 2019 | 2020 | Percentage change |
|---|---|---|---|
| number | |||
| Sexual orientation | 265 | 259 | -2 |
| Sex or gender | 56 | 46 | -18 |
| OtherTable 4 Note 1 | 94 | 143 | +52 |
|
|||
In 2020, most provinces and two territories reported increases.
| Province or territory | Number of hate crimes, 2020 | Change in number of hate crimes, 2019 to 2020 |
|---|---|---|
| Canada | 2,669 | +718 |
| Newfoundland and Labrador | 8 | +2 |
| Prince Edward Island | 7 | -1 |
| Nova Scotia | 55 | +23 |
| New Brunswick | 19 | -11 |
| Quebec | 485 | +86 |
| Ontario | 1,164 | +316 |
| Manitoba | 55 | 0 |
| Saskatchewan | 53 | +20 |
| Alberta | 291 | +84 |
| British Columbia | 519 | +198 |
| Yukon | 4 | +2 |
| Northwest Territories | 4 | -2 |
| Nunavut | 5 | +1 |
| 0 true zero or a value rounded to zero | ||
The majority of police-reported hate crimes were non-violent offences.
| Type of crime | Percentage |
|---|---|
| Non-violent offences | 57 |
| All mischief | 44 |
| Other non-violent offences | 13 |
| Violent offences | 43 |
| Common assault (level 1) | 13 |
| Uttering threats | 12 |
| Other violent offences | 17 |
Note: Hate crime counts include both confirmed and suspected hate crime incidents. Information reflects data reported by police services covering 99.7% of the population of Canada.
Source: Statistics Canada, Canadian Centre for Justice and Community Safety Statistics, Uniform Crime Reporting Survey.
- Date modified: