
Publications
Healthy people, healthy places
+Demographic change
+Health status
+Health behaviours
+Environment
Perceived health

Archived Content
Information identified as archived is provided for reference, research or recordkeeping purposes. It is not subject to the Government of Canada Web Standards and has not been altered or updated since it was archived. Please "contact us" to request a format other than those available.
Perceived health is an indicator of overall health status. Respondents were asked to rate their health as excellent, very good, good, fair, or poor.
Respondents were instructed that "health" means not only the absence of disease or injury, but also includes their overall physical, mental and social well-being. The degree to which individuals consider all these aspects of health in their responses may vary.
Importance of indicator
Perceived health is a subjective measure of overall health status. Individuals' self-assessment of their health may include aspects that are difficult to capture clinically, such as incipient disease, disease severity, physiological and psychological reserves, and social function. Studies have demonstrated that this is a reliable and valid measure, associated with functional decline, morbidity and mortality. As well, perceived health is often more effective than clinical measures for predicting help-seeking behaviours and health service use. Perceived health is a relative measure—evidence suggests that people assess their health in relation to their circumstances and expectations, and their peers1,2,3,4,5,6,7,8,9.
Background
As well as physical health and health behaviours, factors that may contribute to differences in perceived health include age, sex, education, income, and psycho-social characteristics4.
Compared with men, women tend to consider a broader set of factors when rating their overall health. They are more likely to consider the presence of non-life-threatening illness and psychological factors5.
When people rate their health, they think not only of their current situation, but also of trajectories, declines and improvements2.
People with a very strong sense of community belonging had much higher odds of reporting excellent or very good perceived health, compared with those whose sense of community belonging was weak, even when other potentially confounding factors were taken into account (age, sex, marital status, socio-economic factors, chronic conditions, employment status, geography)10.
Among institutionalized seniors, perceived health was associated with mortality. Over a six-year period, those with positive self-perceived health were less likely to die than were those with more negative perceptions, even when age, sex and the presence of chronic conditions were taken into account6.
Highlights and graphs
Time trend

- The age–standardized percentage of people reporting excellent or very good perceived health rose slightly between 2003 and 2005 and remained stable thereafter.
- The differences in the percentages of males and females reporting excellent or very good perceived health was not significant, except in the year 2003.
Note: Age–standardized, direct method to 1991 Canada population.
Age group and sex
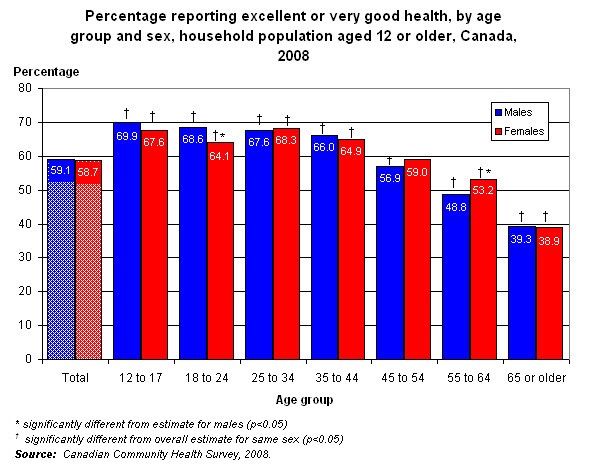
- Close to 60% of Canadians aged 12 or older reported excellent or very good health in 2008.
- In most age groups, the percentages of males and females rating their health as very good or excellent were similar. The only exceptions were at ages 18 to 24, among whom males were slightly more likely than females to report excellent or very good health (68.6% versus 64.1%), and at ages 55 to 64, among whom females were more likely than males to this level of perceived health (53.2% versus 48.8%).
- Not surprisingly, the percentage of people reporting their health as very good or excellent declined with age, likely because the prevalence of chronic conditions and functional limitations tends to increase with advancing age and affects health perceptions.
Province

- Manitoba, Saskatchewan, British Columbia, Northwest Territories and Nunavut reported lower percentages of very good or excellent perceived health than did Canadians overall, even when the different age structures in the provinces and territories was taken into account.
- Residents of Newfoundland and Labrador and Alberta were significantly more likely to report very good or excellent perceived health than were Canadians overall.
Note: Age–standardized, direct method to 1991 Canada population.
References
1. Idler EL, Kasl SV. Self-ratings of health: do they also predict change in functional ability? Journal of Gerontology: Social Science 1995; 50B(6): S344-S353.
2. Idler EL, Benyamini Y. Self-rated health and mortality: a review of twenty-seven community studies. Journal of Health and Social Behaviour 1997; 38: 21-37.
3. Benyamini Y, Idler EL. Community Studies Reporting Association Between Self-Rated Health and Mortality Additional Studies, 1995 to 1998. Research on Aging 1999; 21: 392-401.
4. Shields M., Shooshtari S. Determinants of self-perceived health. Health Reports (Statistics Canada, Catalogue 82-003) 2001; 13(1): 35-52.
5. Benyamini Y, Leventhal EA, Leventhal H. Gender differences in processing information for making self assessments of health. Psychosomatic Medicine 2000; 62(3): 354-64.
6. Ramage-Morin PL. Successful aging in health care institutions. Health Reports (Statistics Canada, Catalogue 82-003) 2006; 16(Suppl.): 47-56.
7. Bowling A. Just one question: If one question works, why ask several? Journal of Epidemiology and Community Health 2005; 59: 342-345.
8. Smith P, Frank J. When aspirations and achievements don't meet. A longitudinal examination of the differential effect of education and occupational attainment on declines in self-rated health among Canadian labour force participants. International Journal of Epidemiology 2005; 34(4): 827-34.
9. Fleishman JA, Zuvekas SH. Global self-rated mental health: associations with other mental health measures and with role functioning. Medical Care 2007; 45(7): 602-609.
10. Shields M. Community belonging and self-perceived health. Health Reports (Statistics Canada, Catalogue 82-003) 2008; 19(2): 51-60.
Other studies
Orpana HM, Lemyre L, Kelly S. Do stressors explain the association between income and declines in self-rated health? A longitudinal analysis of the National Population Health Survey. International Journal of Behavioral Medicine. 2007; 14(1):40-7.
Tremblay S, Dahinten S, Kohen D. Factors related to adolescents self-perceived health. Health Reports (Statistics Canada, Catalogue 82-003) 2003; 14(Suppl.): 7-16.
- Date modified: