
Income Research Paper Series
Statistics Canada’s Quality of Life Statistics Program:
April 2021 to March 2023
Skip to text
Text begins
Acknowledgements
This report was produced by the members of Statistics Canada’s Quality of Life Statistics Program team in consultation with partners at the Treasury Board of Canada Secretariat, the Department of Finance and the Privy Council Office.
Introduction
The Quality of Life Framework for Canada was introduced in April 2021 alongside its companion publication Measuring What Matters: Toward a Quality of Life Strategy for CanadaNote . As described in Budgets 2021 and 2022, the Quality of Life Framework is about supporting inclusive and sustainable growth, to meaningfully improve the well-being of people who live in Canada. To achieve this vision, as of December 2021, the President of the Treasury Board was mandated to lead the implementation of the Quality of Life Framework more broadly across government, with the Department of Finance, the Privy Council Office and Statistics Canada as core partners.
Statistics Canada’s role as a core partner is to develop a statistics program based upon the architecture of the Quality of Life Framework as it was released in Budget 2021. That same Budget established Statistics Canada’s mandate to do so, announcing $13.8 million in funding over five years and $2.3 million ongoing to enable the agency to:
- improve Quality of Life measures and address key data gaps; and,
- bring together key economic, social, and environmental datasets and develop a user interface to support decision-making and budgeting.
The goal of the new Quality of Life Statistics Program (located within Statistics Canada’s Centre for Income and Socioeconomic Well-being Statistics) is to develop the infrastructure of data and metadata needed to support the Government of Canada as it continues to better integrate quality of life measures into a variety of decision-making and reporting processes, under the leadership of the Treasury Board of Canada Secretariat.
The Quality of Life Statistics Program has similar goals to international approaches such as those used in New Zealand and ScotlandNote . The program is advancing its commitments through three primary responsibilities:
- defining Quality of Life indicators and associated measures within Canada’s Quality of Life Framework;
- identifying and filling data gaps for Quality of Life indicators, including gaps in the availability of disaggregated data for diverse population segments; and,
- developing and regularly updating Canada’s online Quality of Life Hub to ensure that all Canadians have access to the most relevant information on Quality of Life in a variety of formats in one place.
As the Quality of Life Statistics Program continues to mature, Statistics Canada intends to keep stakeholders informed of progress on the above responsibilities through a series of brief reports, documenting key milestones. This first progress report provides an update on Statistics Canada’s key activities from April 2021 to March 2023, approximately the first two years of this initiative.
Statistics Canada welcomes interested parties to provide feedback. Comments or questions about this initiative can be directed to the Quality of Life Statistics Program team at Statistics Canada by sending an email to: statcan.stc.wellbeing-bienetre.stc.statcan@statcan.gc.ca.
The Quality of Life Framework for Canada
The Quality of Life Framework is comprised of 84 indicators organized across five domains: Prosperity, Health, Society, Environment and Good Governance. Two of the indicators, Life satisfaction and Sense of meaning and purpose, are included in the Framework as overarching indicators but are not categorized within the five domains.
The Framework also features two cross-cutting lenses: a Fairness and Inclusion lens, and a Sustainability and Resilience lens. The Fairness and Inclusion lens is intended to promote greater equity and equality by assessing the distribution of all outcomes across different sub-populations. The Sustainability and Resilience lens promotes long-term thinking by considering the trajectory of key indicators associated with each domain to identify risks and ensure policy choices today are contributing to a higher quality of life in the future.

Description of Figure 1
The title of the infographic is “Architecture of the Quality of Life Framework for Canada.”
This image illustrates the Quality of Life Framework for Canada. The Framework is represented as a circular graphic with the term “Quality of Life” in a circle at its centre. The circular graphic is divided into five segments which represent each of the five domains of the Framework: Prosperity, Health, Society, Environment and Good governance. Each domain is represented by an icon: the Prosperity domain by an image of a line graph, Health by a heart and heartbeat (electrocardiogram) line, Society by a group of people, Environment by trees and Good governance by a courthouse. The two lenses of the framework, Fairness and Inclusion and Sustainability and Resilience, encircle the image, represented by curved arrows.
Source: Department of Finance Canada.
Of the 84 Quality of Life indicators, twenty are considered as “headline indicators.” Together, these represent a “snapshot” view of the Framework and were chosen to provide users with a sense of the types of data they might find within the Framework more broadly.
Data for Quality of Life indicators will be provided by existing Statistics Canada programs, datasets and surveys, as well as by new surveys and new survey questions, administrative data and other modern data collection methods. Other data from government or non-government sources will also be considered for inclusion in the future.

Description of Figure 2
The title of this infosheet is “Infosheet: Quality of Life Framework for Canada”.
Source: Statistics Canada.
This infosheet shows the domains, subdomains, indicators and cross-cutting lenses of the Quality of Life Framework for Canada.
It is divided into five sections, one for each domain of the Framework:
- Prosperity
- Health
- Society
- Environment
- Good governance
In each domain's section, indicators are listed, categorized by subdomain. The number of subdomains and indicators varies between domains.
Indicators that are headline indicators are identified with a star. Headline indicators are intended to provide a high-level assessment of overall quality of life in Canada.
Prosperity
The Prosperity domain is represented by an image of a line graph.
The subdomain “Income and growth” includes the following indicators:
- Household income (headline indicator)
- Gross domestic product (GDP) per capita
- Productivity
- Access to high-speed Internet
- Household wealth
- Investment in in-house research and development
- Public net financial liabilities-to-GDP ratio
- Firm growth
The subdomain “Employment and job quality” includes the following indicators:
- Employment (headline indicator)
- Labour underutilization
- Wages
- Precarious or gig work
- Job satisfaction
The subdomain “Skills and opportunity” includes the following indicators:
- Youth not in employment, education or training (NEET) (headline indicator)
- Access to early learning and child care
- Child, student and adult skills
- Postsecondary attainment
- Future outlook
The subdomain “Economic security and deprivation” includes the following indicators:
- Housing needs (headline indicator)
- Poverty (headline indicator)
- Protection from income shocks
- Financial well-being
- Homelessness
- Food security
Health
The Health domain is represented by a heart and heartbeat (electrocardiogram).
The subdomain “Healthy people” includes the following indicators:
- Health-adjusted life expectancy (headline indicator)
- Self-rated mental health (headline indicator)
- Self-rated health
- Physical activity
- Functional health status
- Children vulnerable in early development
- Fruit and vegetable consumption/healthy eating environments
The subdomain “Healthy care systems” includes the following indicators:
- Timely access to primary care provider
- Unmet health care needs
- Unmet needs for mental health care
- Long-term care (access and quality)
- Access to supplementary health insurance
- Unmet needs for home care
- Cost-related non-adherence to prescription medication
Society
The Society domain is represented by a group of people.
The subdomain “Culture and identity” includes the following indicators:
- Sense of pride/belonging to Canada
- Positive perceptions of diversity
- Indigenous languages
- Knowledge of official languages
- Participation in culture or religious practices, recreation or sport
The subdomain “Social cohesion and connections” includes the following indicators:
- Sense of belonging to local community (headline indicator)
- Someone to count on (headline indicator)
- Trust in others
- Volunteering
- Satisfaction with personal relationships (family and friends)
- Loneliness
- Accessible environments
The subdomain “Time use” includes the following indicators:
- Time use (headline indicator)
- Satisfaction with time use
Environment
The Environment domain is represented by trees.
The subdomain “Environment and people” includes the following indicators:
- Air quality (headline indicator)
- Drinking water (headline indicator)
- Climate change adaptation (headline indicator)
- Natural disasters and emergencies
- Satisfaction with local environment
- Walkable communities
- Access to public transit
The subdomain “Ecological integrity and environmental stewardship” includes the following indicators:
- Greenhouse gas emissions (headline indicator)
- Conserved areas (headline indicator)
- Canadian species index
- Water quality in Canadian rivers
- Natural capital
- Waste management
- Marine and coastal ecosystems
Good governance
The Good governance domain is represented by a courthouse.
The subdomain “Safety and security” includes the following indicators:
- Personal safety (headline indicator)
- Crime Severity Index
- Perceptions of neighbourhood safety after dark
- Childhood maltreatment
- Household emergency preparedness
The subdomain “Democracy and institutions” includes the following indicators:
- Confidence in institutions (headline indicator)
- Voter turnout
- Representation in senior leadership positions
- Canada's place in the world
- Misinformation/trust in media
- Indigenous self-determination
The subdomain “Justice and human rights” includes the following indicators:
- Discrimination and unfair treatment (headline indicator)
- Cyberbullying
- Access to fair and equal justice (civil and criminal)
- Resolutionm of serious legal problems
- Incarceration rate
“Life satisfaction” and “Sense of meaning and purpose” are headline indicators, separate from the other five domains.
Cross-cutting lenses
The Fairness and Inclusion lens is intended to inform policy and program development, leading to greater equity and equality, by assessing the distribution of outcomes for different populations in Canada.
The Sustainability and Resilience lens promotes long-term thinking by considering the trajectory of indicators in order to identify risks, build resilience and ensure that policy choices are contributing to a higher quality of life not only now but in the years ahead.
Quality of Life Framework for Canada image
The infosheet also shows an image which illustrates the Quality of Life Framework for Canada. The Framework is represented as a circular graphic with the term “Quality of Life” in a circle at its centre. The circular graphic is divided into five segments which represent each of the five domains of the framework: Prosperity, Health, Society, Environment and Good governance. Each domain is represented by an icon: the Prosperity domain by an image of a line graph, Health by a heart and heartbeat (electrocardiogram) line, Society by a group of people, Environment by trees and Good Governance by a courthouse. The two lenses of the framework, Fairness and Inclusion and Sustainability and Resilience, encircle the image, represented by curved arrows.
Defining indicators
Concepts, definitions, and measurement
Quality of Life indicators can be thought of as having three parts: a concept, a definition and measurement. A fundamental part of Statistics Canada’s role is to develop definitions for each of the 84 Quality of Life indicators/concepts and ensure each one is measured accordingly. This has been a major focus for the first two years of the Quality of Life Statistics Program.
Consider, for example, the indicator Protection from income shocks within the Prosperity domain. The concept of protection from sudden drops in income is potentially broad, and several different definitions could have been appropriate. However, as a result of the consultative process outlined in the paragraphs below, the following definition for Protection from income shocks was identified for the purposes of calculating Quality of Life statistics:
Proportion of individuals living in households who have enough savings to maintain well-being for three months (asset resilience).
Given this definition, the Protection from income shocks indicator can be measured using the Survey of Financial Security, which provides estimates of the proportion of the people in Canada who live in a household with liquid assets that are at least equal to the low-income measure after tax (LIM-AT) for at least three months.
Indicators which represent established, standardized concepts used at Statistics Canada and/or federally or internationally may be easier to define and endorse within the Quality of Life governance structure than definitions for certain other indicators. For example, the indicator Self-rated mental health was straightforward to define, as it is part of Statistics Canada’s harmonized survey content and is used in many ongoing surveys. In comparison, definitions for other indicators, such as Child, student, and adult skills, will require more intensive consultation and research, including several expert-level conceptual discussions before a decision can be made regarding the most important component of the concept to measure. In other cases, such as Marine and coastal ecosystems, there may be multiple definitions endorsed for the single indicator/concept, with each definition providing unique insights.
In addition, data for an indicator and its associated definition(s) may come from different data sources and be measured in different ways. Some indicators may be primarily dependent on surveys for their statistics, while others might be dependent on administrative sources or linked survey-administrative files. The process for determining indicator definitions typically includes providing information to the Quality of Life governance committee on proposed data sources before the indicator definitions are endorsed.
Anticipating that Quality of Life indicators may serve multiple policy needs, wherever possible, they are defined to report a spectrum of outcomes, to allow analysts to use data to view/calculate whatever statistics may be most relevant to them (e.g., a mean, median, measures of dispersion, etc.). Detailed metadata, including the definition and appropriate measurement information, is critical in ensuring that data users understand and can easily interpret Quality of Life statistics. Statistics Canada makes every effort to ensure that such metadata are comprehensive, clear and of the highest quality.
Process
To establish a definition for an indicator, Statistics Canada begins by undertaking research to determine whether a standard already exists for the indicator within the Agency’s own programs, within other frameworks or internationally. Statistics Canada’s harmonized metadata and quality standards are used for guidance throughout this work, with interpretability of metadata being a key priority: definitions must be clear and well understood by policy-makers as well as the general population of Canada. Indicators are also defined to ensure comparability and flexibility, so that they may be used in conjunction with data for different populations, across different data sources and over time.
Furthermore, efforts are made to align the indicators in the Quality of Life Framework with those used within a variety of other strategies, priorities and policy frameworks that exist across government. Some of these include the Gender Results Framework, the Canadian Indicators Framework (used to assess Canada’s domestic progress on the United Nations Sustainable Development Goals), the Federal Sustainability Strategy, the Social Inclusion Framework, and many others.
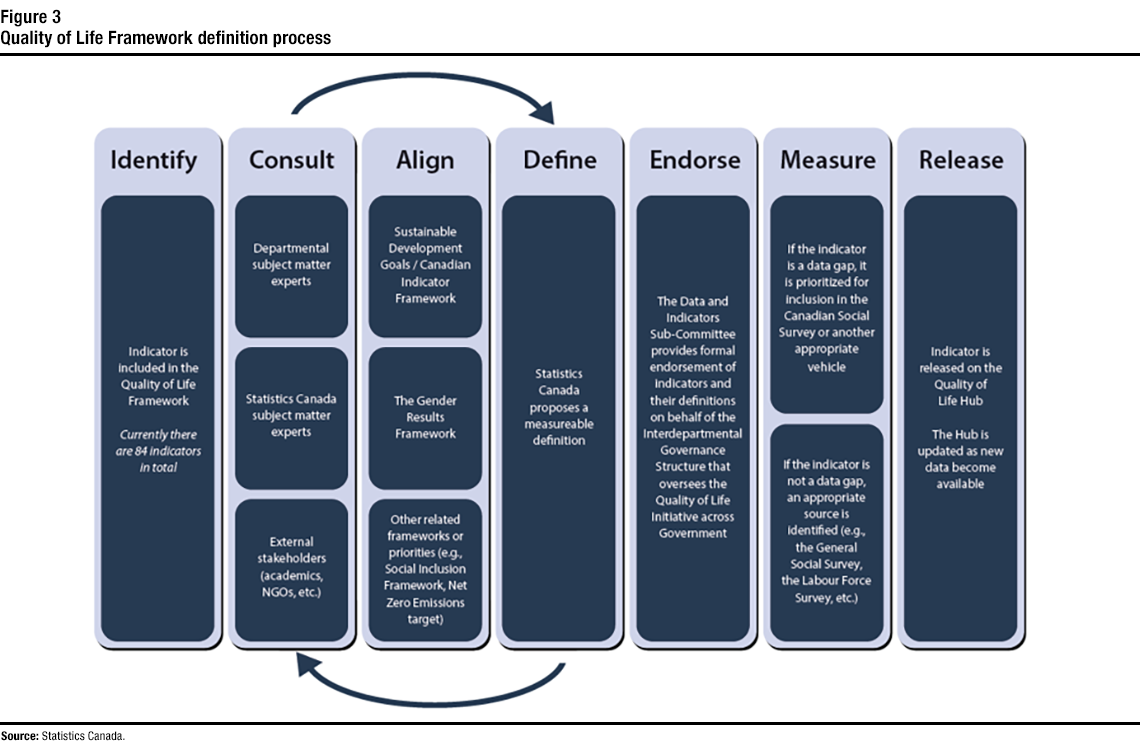
Description of Figure 3
The title of this infographic is “Quality of Life Framework definition process.”
This figure illustrates the different steps taken in the indicator definition process. Each step is represented by a block which includes the title of the step along with its description.
The first step is “Identify” with the description: “Indicator is included in the Quality of Life Framework. Currently there are 84 indicators in total.”
The second step is “Consult,” which has three components: “Departmental subject matter experts”, “Statistics Canada subject matter experts”, and “External stakeholders (academics, NGO’s, etc.).”
The third step is “Align,” which has three components: “Sustainable Development Goals/Canadian Indicator Framwork,” “The Gender Results Framework,” and “Other related frameworks or priorities (e.g. Social Inclusion Framework, Net Zero Emmissions target).”
The fourth step is “Define,” which is described as: “Statistics Canada proposes a measurable definition”. There are two arrows, where one flows from the second step of “Consult” to the fourth step of “Define”, while the other arrow is the opposite, flowing from the fourth “Define” step to the second “Consult” step.
The fifth step is “Endorse,” which is described as: “The Data and indicators Sub-Committee provides formal endorsement of indicators and their definitions on behalf of the interdepartemental Governance Structure that oversees the Quality of Life Initiative across Government.”
The sixth step is “Measure”, which includes two components: “If an Indicator is a data gap, it is prioritized for inclusion in the Canadian Social Survey or another appropriate vehicle,” and “If the indicator is not a data gap, an appropriate source is identified (e.g. the General Social Survey, the Labour Force Survey, etc.).”
The seventh and final step is “Release”, which is described as: “The indicator is released on the Quality of Life Hub. The Hub is updated as new data become available”.
After initial research on potential indicator definitions and framework alignment has been completed, recommended definitions are drafted, and data sources and any other considerations are identified. The resulting documentation is then subject to an iterative consultative process. Consultations are held among subject matter experts within Statistics Canada, across the federal government, and outside of government (within NGOs and academia) to seek feedback on the proposed definition and to understand possible alternatives, key informative data sets, possibilities for data disaggregation and data limitations. Expert opinion and recommendations are considered and implemented: this may involve revising the initial definition or drafting a new one, researching different data sources not previously identified, or seeking advice from other experts.
Once recommended indicator definitions have been agreed to by experts both internal and external to Statistics Canada, they are brought to the federal interdepartmental Director and Director General-level governance bodies for endorsement. Once an indicator has an endorsed definition, the indicator and associated metadata are then eligible for release on the Quality of Life Hub.
Status
Since the introduction of the Quality of Life Framework in April 2021, a great deal of progress has been made in developing, endorsing and publishing indicator definitions. As of March 2023, 77 of the 84 indicator definitions have been endorsed and a metadata page for most of these has been released on the Quality of Life Hub. Definitions for the seven remaining indicators are at various stages of development and it is anticipated that these will receive endorsement by the end of the 2023-2024 fiscal year. These remaining indicators are: Child, student, and adult skills; Homelessness; Children vulnerable in early development; Long-term care; Natural capital; Canada’s place in the world; and Indigenous self-determination.
Identifying data gaps
Collection gaps and dissemination gaps
Statistics Canada’s Quality of Life Statistics Program is responsible for identifying data gaps with the intention of informing data collection and dissemination priorities for quality of life. Overall, four criteria have been established for the identification of data gaps, with these four criteria falling into two main categories: data collection gaps and data dissemination gaps.
The four criteria for identifying data gaps include an examination of situations where:
- data have not been collected on a concept at all in the past;
- data have been collected in the past but not for certain populations (for example, populations in the territories of Canada);
- data have been collected in the past but not recently or regularly (for example, not for 7 or more years); and/or
- data have been collected in the past but not published recently or regularly (for example, some survey data may have been released for use on microdata files but not in a more accessible analytical or tabular format).
Any indicators for which any of the above bullets 1 through 3 are true, are considered as “data collection gaps,” whereas any indicators for which only the fourth bullet is true, are considered as “data dissemination gaps.”
Once the above gap identification process has been completed for an indicator, the Quality of Life Statistics Program team then begins to establish options, timelines and recommendations for how best to fill data gaps quickly and with the highest quality data, whether those data are held by Statistics Canada or another federal government department or organization. Data collection gaps can necessitate the inclusion of a new question on a survey, a change in a survey’s target population, the development of an administrative or linked survey-to-administrative data source, or other potential courses of action. In comparison, data dissemination gaps generally necessitate the production of a table, data visualization or analytical piece for release by Statistics Canada or by a federal partner.
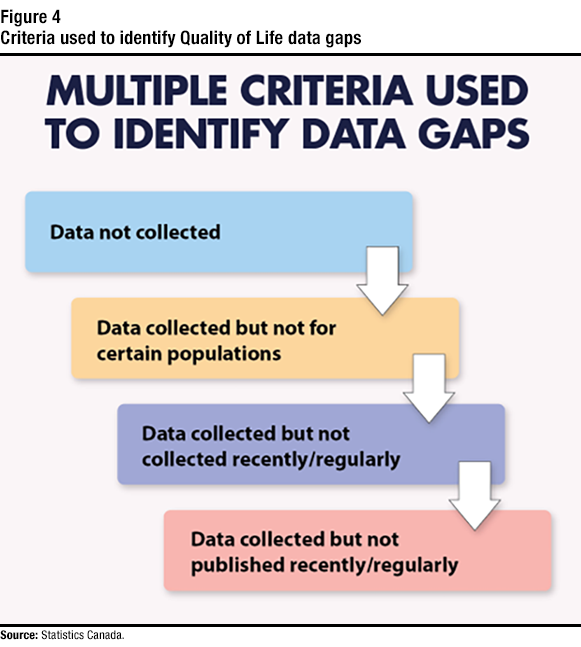
Description of Figure 4
The title of this infographic is “Criteria used to identify Quality of Life data gaps.”
Source: Statistics Canada.
This figure illustrates the criteria used to identify data gaps, with four different boxes. There are white arrows facing down on the right hand side of each box, indicating the flow through the criteria.
The first box in blue that states “Data not collected.” The second box in yellow states “Data collected but not for certain populations”. The third box in purple states “Data collected but not collected recently/regularly.” The fourth and finalbox in pink states “Data collected but not published recently/regularly.”
In some situations, data gaps can be challenging to identify and/or rectify quickly. For example, a data gap for an indicator may exist even if there is a survey that collects data for that indicator, if the survey’s sample size cannot provide reliable estimates of that indicator for a particular detailed segment of the population or a small area of geography. Often, it is not known if such a data gap will exist for that population segment or area of geography until after survey data have been collected, processed, weighted, and analyzed. If the survey, survey methodology, or indicator is relatively new, or if the sample size falls within a particular mid-range, an accurate prediction about release may not be feasible to make in advance of collection. As such, both the identification and filling of certain data gaps are carefully monitored processes, which can take significant time to complete.
As was alluded to above, filling data gaps for specific population segments is an important part of the Quality of Life Statistics Program. All indicators in the Framework will be assessed under the Fairness and Inclusion lens to identify potential inequalities among Canadians and to ensure the Framework is as inclusive as possible to support and inform relevant policymaking. The Fairness and Inclusion lens aims to disaggregate Quality of Life data to the most granular level possible, where appropriate, to provide insights on the quality of life of various groups across society. This disaggregation may involve focusing on key populations of interest who are known to experience socioeconomic gaps of various kinds, including Indigenous people, children and youth, lone parents, seniors, veterans, persons with disabilities, racialized groups, and the LGBTQ2+ population. It is also a priority to disaggregate data at the provincial and territorial level as well as for cities and rural communities.
Fortunately, efforts to fill data gaps through the use of the Fairness and Inclusion lens is an activity which is aligned with the implementation of Statistics Canada’s Disaggregated Data Action Plan (DDAP). Funding for DDAP was announced in Budget 2021 to support more representative data collection methods and enhance statistics on diverse populations to allow for intersectional analyses. Several different projects at Statistics Canada are underway using DDAP funds, many of which will allow the Quality of Life Statistics Program to better inform on Canadians’ well-being with different backgrounds and life experiences in the coming years.
Status
Between April 2021 and March 2023, Statistics Canada identified many data collection and data dissemination gaps for Quality of Life indicators. A number of these gaps have already been successfully filled, while efforts to fill the remainder are ongoing.
The Canadian Social Survey (CSS) is one of many data sources that provides statistics on quality of life. Since the Framework’s inception, the CSS has already been used to fill data collection gaps for Canada’s population living in the 10 provinces for eight indicators for which data had not been collected previously, or for which data had not been collected recently:
- Loneliness
- Sense of meaning and purpose
- Someone to count on
- Future outlook
- Satisfaction with time use
- Satisfaction with local environment
- Financial well-being
- Data on emergency preparedness, related to the Household emergency preparedness indicator (collected before the final definition was endorsed)

Further, a collection data gap for Misinformation/trust in media will be filled by a future iteration of the CSS in the coming year. In addition to filling data gaps through the CSS, other survey vehicles have been used to fill data collection gaps for quality of life. Specifically, the Survey on Access to Health Care and Pharmaceuticals During the Pandemic (SAHCPDP) has filled the gap in data on Cost-related non-adherence to prescription medication by collecting more detailed data on this topic than was previously available. The 2023 National Justice Survey (NJS) will include a new question on civil law (excluding family law) that will fill a data collection gap for Access to fair and equal justice (civil and criminal). The Survey Series on People and their Communities (SSPC) will help fill a number of data disaggregation gaps for Quality of Life indicators, with six indicators collected in its first iteration of the web panel and plans underway to collect additional indicators in future iterations.
Still, a number of data collection gaps remain for other indicators, and particularly for three indicators for which a final definition has not yet been endorsed:
- Canada’s place in the world (definition not yet endorsed)
- Child, student and adult skills (definition not yet endorsed)
- Children vulnerable in early development (definition not yet endorsed)
Data gaps also continue to exist for certain population segments and geographic regions, including smaller minority groups and the population living in Canada’s north, with methodological studies in place to see how these gaps might best be resolved in the future. More information on these data gaps and strategies for resolving them will be provided in a later iteration of this report.
Statistics Canada’s efforts with respect to filling data collection gaps are already yielding valuable insights into the quality of life of Canadians. In addition to fielding the new survey questions, the Quality of Life Statistics Program has been following through by disseminating collected data in aggregated format in analytical products such as The Daily, infographics and tables. Please see Appendix A for a list of selected quality of life analyses and other publications.
Of note, while important, early strides have been made with respect to filling key gaps using the CSS, it should be acknowledged that the CSS does not cover the territories. Ensuring the geographic representation of the north in key datasets that support the Quality of Life Framework remains an important and ongoing priority for Statistics Canada.
The Canadian Social Survey
The Canadian Social Survey (CSS) is one of Statistics Canada’s newer data collection projects. The CSS has been collected and disseminated on a quarterly basis since April 2021, providing data to understand social issues more rapidly than was generally possible in the past. As well, for certain analyses, multiple quarters of the CSS data can be pooled (combined) into a larger sample to examine issues at a more detailed level than is possible by using only a single quarter of the CSS.
The target population for the CSS is all non-institutionalized persons 15 years of age or older, living off-reserve in the 10 provinces of Canada. The CSS sample is cross-sectional. For each quarterly iteration of the survey, referred to as a “wave”, roughly 20,000 dwellings are randomly selected for the sample. Within each responding household from that sample, information is collected from one randomly selected household member aged 15 or older. All iterations of the Canadian Social Survey will be integrated with the Social Data Linkage Environment (SDLE) and the Census of Population, opening up the possibility of examining CSS data in conjunction with data collected through other statistical programs.
Some examples of standard sociodemographic data available from each wave of the CSS include:
- Geography (e.g., province of residence)
- Household size
- Sex at birth
- Gender
- Age
- Highest certificate, diploma or degree completed
- Main activity
- Marital status
- Indigenous Identity
- Place of birth, immigration, and citizenship
- Long-term conditions
- Sexual orientation
Quality of Life indicators that have been collected in various waves of the CSS are shown in Figure 5.
End of text box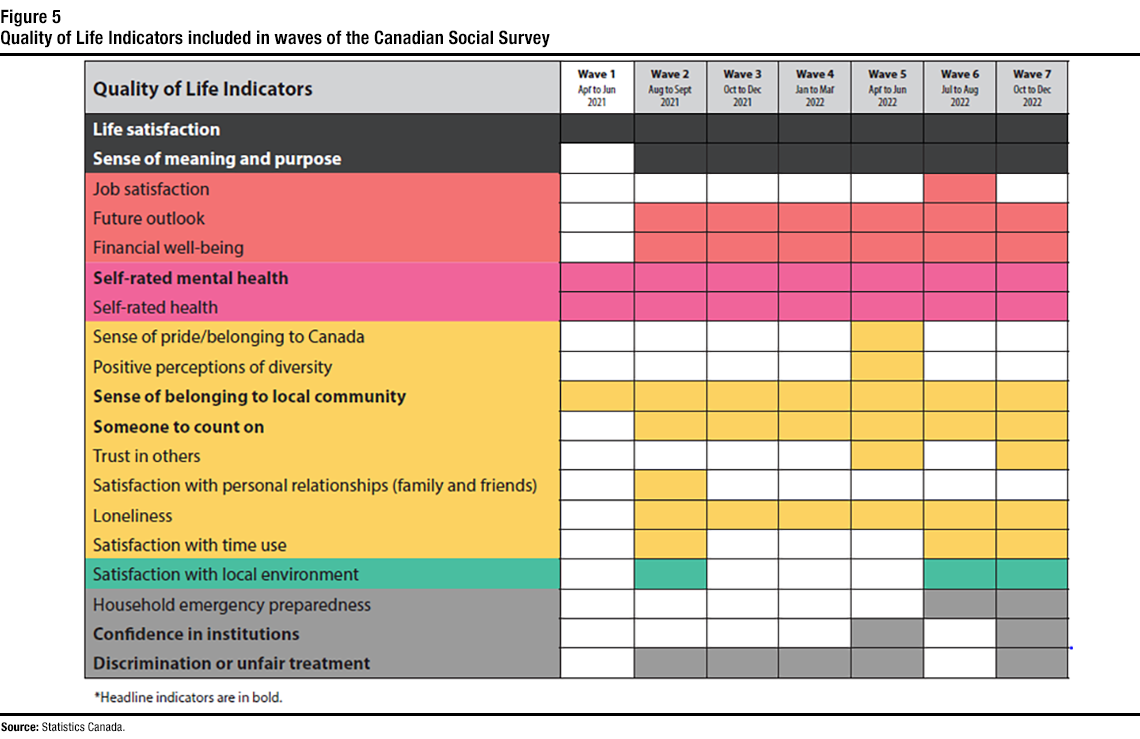
Description of Figure 5
The title of the infographic is “Quality of Life Indicators included in waves of the Canadian Social Survey.”
Source: Statistics Canada.
This chart illustrates Quality of Life indicators included in the Canadian Social Survey from waves one to seven. Indicators are listed in the far left-hand side column and are grouped by domain. The chart is made up of shaded squares, coloured according to the indicator’s domain, to show the waves of the Canadian Social Survey in which the indicator was collected. Headline indicators are listed in bold.
Life satisfaction and sense of meaning and purpose:
- Life satisfaction (headline indicator): included in waves 1 to 7
- Sense of meaning and purpose (headline indicator): included in waves 2 to 7
Prosperity domain:
- Job satisfaction: included in wave 6
- Future outlook: included in waves 2 to 7
- Financial well-being: included in waves 2 to 7
Health domain:
- Self-rated mental health (headline indicator): included in waves 1 to 7
- Self-rated health: included in waves 1 to 7
Society domain:
- Sense of pride/belonging to Canada: included in wave 5
- Positive perceptions of diversity: included in wave 5
- Sense of belonging to local community (headline indicator): included in waves 1 to 7
- Someone to count on (headline indicator): included in waves 2 to 7
- Trust in others: included in waves 5 and 7
- Satisfaction with personal relationships (family and friends): included in wave 2
- Loneliness: included in waves 2 to 7
- Satisfaction with time use: included in waves 2, 6, and 7
Environment domain:
- Satisfaction with local environments: included in waves 2, 6, and 7
Good governance domain:
- Household emergency preparedness: included in waves 6 and 7
- Confidence in institutions (headline indicator): included in waves 5 and 7
- Discrimination or unfair treatment (headline indicator): included in waves 2 to 4 and 7
Making Quality of Life data accessible: The online Quality of Life Hub
To fill data gaps, curate quality of life information, and make data and metadataNote accessible to policy-makers and all Canadians, Statistics Canada is developing an online Quality of Life Hub which provides information on the quality of life of people in Canada, taking into account fairness, inclusion, sustainability and resilience over time. The beta version of the Quality of Life Hub was released by Statistics Canada on March 30, 2022.
The Hub provides important information on the domains, subdomains, and indicators for the Quality of Life Framework. For each indicator that has been defined and endorsed, a Hub page has been published for that indicator. Figure 6 provides an example of the Hub page for the Employment indicator.
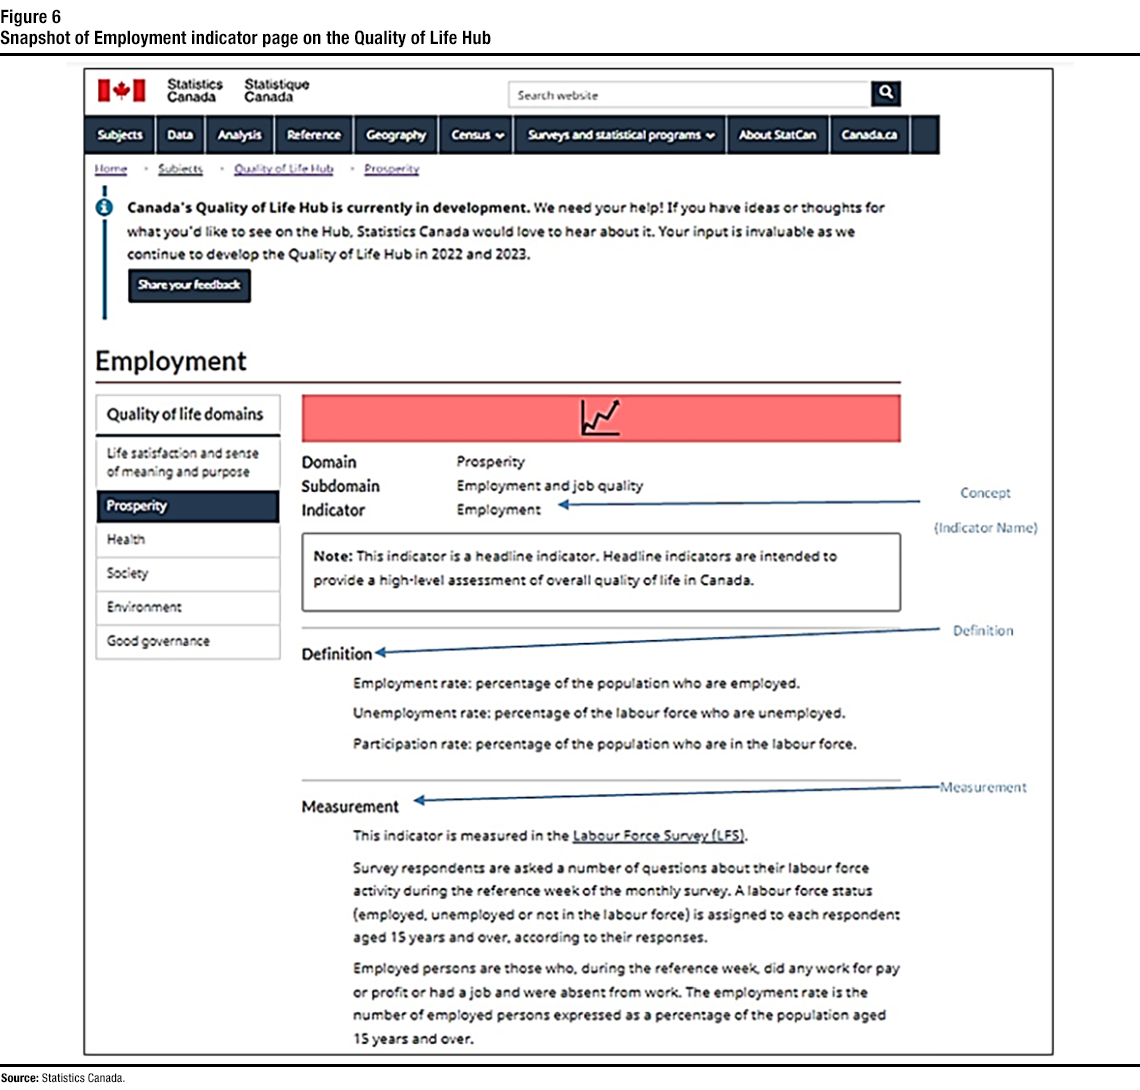
Description of Figure 6
The title of the infographic is "Snapshot of Employment indicator page on the Quality of Life Hub.”
Source: Statistics Canada.
This image is a screen capture of the Quality of Life Hub page for the Employment indicator.
The top left of the page displays a Canadian flag next to Statistics Canada/Statisique Canada.
On the top right of the page is a search bar that states “Search website” next to a looking glass icon.
9 headers are listed at the top of the page, starting with “Subjects”, “Data”, “Analysis”, “Reference”, “Geography”, “Census” with an arrow indicating a drop down list, “Surveys and statistical programs” also with an arrow indicating a drop down list, “About StatCan” and finally “Canada.ca”.
Underneath those headers are more links for the page’s breadcrumb trail: “Home”, “Subjects”, “Quality of Life Hub”, “Prosperity”.
There is a blue text box at the top of the page that states: “Canada's Quality of Life Hub is currently in development. We need your help! If you have ideas or thoughts for what you'd like to see on the Hub, Statistics Canada would love to hear about it. Your input is invaluable as we continue to develop the Quality of Life Hub.” Below the text is a darker blue box that states “Share your feedback” with a link to the feedback page.
The title of the Hub page is “Employment”.
The left hand side of the page is titled “Quality of life domains” and lists the domains found in the Framework starting with “Life satisfaction and sense of meaning and purpose”, followed by “Prosperity” (which is selected) then “Health”, “Society”, “Environment” and finally “Good governance”.
The main part of the webpage lists information about the Employment indicator, starting with:
Domain: Prosperity, Subdomain: Employment and job quality, Indicator: Employment, and a text box that states: “Note: This indicator is a headline indicator. Headline indicators are intended to provide a high-level assessment of overall quality of life in Canada.”
The next section is titled “Definition” and states: “Employment rate: percentage of the population who are employed. Unemployment rate: percentage of the labour force who are unemployed. Participation rate: percentage of the population who are in the labour force.”
The next section is titled “Measurement” and states: “This indicator is measured in the Labour Force Survey (LFS). Survey respondents are asked a number of questions about their labour force activity during the reference week of the monthly survey. A labour force status (employed, unemployed or not in the labour force) is assigned to each respondent aged 15 years and over, according to their responses. Employed persons are those who, during the reference week, did any work for pay or profit or had a job and were absent from work. The employment rate is the number of employed persons expressed as a percentage of the population aged 15 years and over.” Additionally, there is a blue arrow pointing to the Indicator name of Employment to note it is the Concept (indicator name), another blue arrow pointing to the Definition section of the web page and a third blue arrow pointing to the Measurement section of the web page.
The Hub also curates relevant data products, including tables, charts, visualizations, analytical reports and reference (methodological) documents in an easily accessible format for a variety of data users. It includes an interactive tool for visualizing selected indicators of quality of life in Canada measured from the CSS, including Life satisfaction, Sense of meaning and purpose, Loneliness, Someone to count on, Future outlook, Sense of belonging to local community, Self-rated health and Self-rated mental health. Data can be disaggregated by province and by a variety of sociodemographic characteristics.

In line with the Government of Canada’s Digital Standards, the Hub has been, and will continue to be, designed with users in mind to ensure good data stewardship, interpretability and accessibility so that the important information it provides can be widely understood and used by all who access the site inclusively. The Hub will be updated regularly based on input and suggestions from website users and Statistics Canada’s partners and stakeholders. Collaborating in this way is vital to the development of an agile, open and user-focused interface which is continuously updated and improved over time. A future version of the Hub is also envisioned which will allow users to interactively disaggregate and visualize multiple well-being statistics in a manner that drives evidence-based decision-making on priority subjects.
Articles, infographics, and tables
Statistics Canada regularly disseminates information for many Quality of Life indicators from its various Centres of expertise. Appendix A provides a list of selected articles and infographics which have been shared with the public online, including Canadians’ Well-being in Year One of the COVID-19 Pandemic, The Financial Resilience and Financial Well-being of Canadians During the COVID-19 Pandemic, and short analyses and infographics on various topics related to quality of life. Other releases have included analyses on indicators such as Future outlook, Sense of belonging to local community and Loneliness. Additional analytical products will be disseminated in the years ahead, with a focus on filling data gaps.
In addition to published articles and infographics, tables are key in enabling data users to find important information they need to make informed decisions. As such, a set of timely, standardized, and easy to interpret tables based on the quarterly CSS data were released in March 2022, followed by subsequent updates to include the latest CSS waves and an expanded set of tables by early 2023. Quality of Life indicators are presented by province and various sociodemographic characteristics. An emphasis has been placed on ensuring the tables are available in disaggregated formats. Please see Appendix B for a list of tables that have been released thus far. The Quality of Life Statistics Program will continue to develop tables based on data from the CSS and other surveys.
The year ahead
Work on the Quality of Life Framework for Canada has progressed quickly and will continue to evolve in the coming years. While the Framework and its indicators will remain evergreen to ensure continued relevance, at this early stage of its implementation, core partners are prioritizing stability in the design of the Framework as new users continue to become familiar with it. In the future, revisions and updates to the Framework will be managed using an iterative process led by the Treasury Board of Canada Secretariat and overseen by the interdepartmental governance. This will ensure that the Framework remains relevant to its various users.
In 2023-2024, Statistics Canada will continue working with partners to develop definitions and data standards for each indicator in the Framework. The majority of indicators already have metadata pages on the Hub; definitions for the remaining indicators are expected to be endorsed at meetings of the interdepartmental governance throughout 2023-24.
Ongoing development of the Fairness and Inclusion lens and Sustainability and Resilience lens will contribute to improving the disaggregation of Quality of Life data, filling persistent data gaps among key populations such as Indigenous communities and people living in the north, and developing a long-term perspective on the quality of life of Canadians.
Fairness and inclusion: Indigenous perspectives – Building on work already in progress
Engagement with Indigenous people, communities and organizations is critical to the success of Canada’s Quality of Life Statistics Program. Discussions will continue to be held with Indigenous partners, organizations, and communities to make the Quality of Life indicators culturally relevant and inclusive of First Nations people, Métis and Inuit and their experiences. Knowledge about the diverse lived experiences of First Nations people, Métis and Inuit will help to identify the best way forward to reflect Indigenous perspectives in the Quality of Life Framework. It will also support Statistics Canada and federal government partners, such as Indigenous Services Canada (ISC) and Crown-Indigenous Relations and Northern Affairs Canada (CIRNAC), to amplify work underway by Indigenous partners in the ownership, protection and management of their data, as well as allowing Statistics Canada to fill Indigenous data gaps where appropriate.
Access to reliable and culturally relevant data on Indigenous people is critical to building a complete portrait of Indigenous lived experiences, unmasking inequalities, and ensuring delivery of effective policies and programs. Indigenous-led data strategies can further support self-determination by providing First Nations, Inuit and Métis Nation governments and organizations with the data they need to support their communities. Budget 2021 allocated $73.5 million over three years to continue work toward the development and implementation of a First Nations Data Governance Strategy. Budget 2021 also allocated $8 million over three years to support Inuit and Métis baseline data capacity and the development of distinctions-based Inuit and Métis Nation data strategies.
End of text boxIn the year ahead, Statistics Canada will also continue to develop strategies and determine how best to fill Quality of Life data gaps using survey, administrative and other alternative data sources. Data linkage/integration, pooling and modelling techniques will be explored and supported where appropriate. Statistics Canada will continue to develop and contribute content related to quality of life to the CSS and other household surveys where possible, and to release data and insights on Quality of Life indicators through the Quality of Life Hub.
Work will continue to update and refine the Hub, including developing interactive data visualizations and data tables. Through an iterative process, the Hub will continually be reviewed and updated to add more features, taking into consideration feedback from users and partners. In this manner, policy makers, researchers and Canadians will have access to a comprehensive, current, coherent and easy-to-use tool with which to explore various indicators which impact their own quality of life and the quality of life of others across the country.

Conclusion
This progress report described the work undertaken to date to further refine and strengthen the Quality of Life Framework by Statistics Canada, in partnership with the Treasury Board of Canada Secretariat, the Department of Finance Canada, the Privy Council Office and the supporting intergovernmental governance structure. This is the first paper in a series that will provide updates on the progress of work relating to the Framework, its indicators, and its lenses.
In parallel, the Treasury Board of Canada Secretariat continues to work with key federal and external partners to further integrate Quality of Life considerations and data into government decision-making and reporting processes. Quality of Life implementation is being pursued within an existing landscape of government-wide requirements and initiatives. Engagement within government and with external partners is a priority as the approach continues to evolve to ensure coordination and alignment. Those interested in contributing to implementation work can send an email to: qualityoflife-qualitedevie@tbs-sct.gc.ca.
Users are welcome to ask questions or share their feedback. Those interested in contacting the Quality of Life Statistics Program at Statistics Canada, or being added to an email list to receive updates on new Quality of Life data and insights, are encouraged to do so by sending an email to: statcan.stc.wellbeing-bienetre.stc.statcan@statcan.gc.ca.
References
Budget 2022. “A Plan to Grow Our Economy and Make Life More Affordable.” https://budget.gc.ca/2022/home-accueil-en.html
Department of Finance Canada. April 19, 2021. Budget 2021. “Annex 4: Gender, Diversity, and Quality of Life Statement.” https://www.budget.gc.ca/2021/report-rapport/anx4-en.html
Department of Finance Canada. April 19, 2021. “Measuring What Matters: Toward a Quality of Life Strategy for Canada.” https://www.canada.ca/en/department-finance/services/publications/measuring-what-matters-toward-quality-life-strategy-canada.html
Office of the Prime Minister of Canada. December 16, 2021. “Deputy Prime Minister and Minister of Finance Mandate Letter.” https://pm.gc.ca/en/mandate-letters/2021/12/16/deputy-prime-minister-and-minister-finance-mandate-letter
Office of the Prime Minister of Canada. December 16, 2021. “Minister of Innovation, Science and Industry Mandate Letter.” https://pm.gc.ca/en/mandate-letters/2021/12/16/minister-innovation-science-and-industry-mandate-letter
Office of the Prime Minister of Canada. December 16, 2021. “President of the Treasury Board Mandate Letter.” https://pm.gc.ca/en/mandate-letters/2021/12/16/president-treasury-board-mandate-letter
Office of the Prime Minister of Canada. December 13, 2019. “Minister of Middle Class Prosperity and Associate Minister of Finance Mandate Letter.” https://pm.gc.ca/en/mandate-letters/2019/12/13/minister-middle-class-prosperity-and-associate-minister-finance-mandate
Appendix A: Selected analyses related to Quality of Life
Statistics Canada. March 07, 2023. The Daily. “More Canadians are finding it difficult to meet food, shelter and other necessary expenses.”
https://www150.statcan.gc.ca/n1/daily-quotidien/230307/dq230307b-eng.htm
Statistics Canada. August 19, 2022. StatsCAN Plus. “You can count on me.” https://www.statcan.gc.ca/o1/en/plus/1617-you-can-count-me
Statistics Canada. August 19, 2022. The Daily. “Almost half of Canadians report a strong sense of belonging to their local community.” https://www150.statcan.gc.ca/n1/daily-quotidien/220819/dq220819b-eng.htm
Statistics Canada. August 9, 2022. The Daily. “Having someone to count on, January to March, 2022.” https://www150.statcan.gc.ca/n1/daily-quotidien/220809/dq220809a-eng.htm
Statistics Canada. August 9, 2022. Infographics. “Having someone to count on.” https://www150.statcan.gc.ca/n1/pub/11-627-m/11-627-m2022042-eng.htm
Statistics Canada. May 17, 2022. The Daily. “Hopefulness is declining across Canada: having children or strong ties to a local community associated with a more hopeful outlook.” https://www150.statcan.gc.ca/n1/daily-quotidien/220517/dq220517d-eng.htm
Statistics Canada. May 3, 2022. Infographics. “Local Environments Lift Life Satisfaction.” https://www150.statcan.gc.ca/n1/pub/11-627-m/11-627-m2022028-eng.htm
Statistics Canada. March 30, 2022. The Daily. “Sense of meaning and purpose in Canada, October to December 2021.” https://www150.statcan.gc.ca/n1/daily-quotidien/220330/dq220330b-eng.htm
Statistics Canada. March 30, 2022. Infographics. “Sense of meaning and purpose in Canada.” https://www150.statcan.gc.ca/n1/pub/11-627-m/11-627-m2022019-eng.htm
Statistics Canada. November 24, 2021. The Daily. “Canadian Social Survey: Loneliness in Canada.” https://www150.statcan.gc.ca/n1/daily-quotidien/211124/dq211124e-eng.htm
Statistics Canada. November 24, 2021. Infographics. “Canadian Social Survey: Loneliness in Canada.” https://www150.statcan.gc.ca/n1/pub/11-627-m/11-627-m2021090-eng.htm
Statistics Canada. September 9, 2021. Income Research Paper Series. “The financial resilience and financial well-being of Canadians during the COVID-19 pandemic.” https://www150.statcan.gc.ca/n1/pub/75f0002m/75f0002m2021008-eng.htm
Statistics Canada. July 12, 2021. Analytical Studies Branch Research Paper Series. “Moving Forward on Well-being (Quality of Life) Measures in Canada.” https://www150.statcan.gc.ca/n1/pub/11f0019m/11f0019m2021006-eng.htm
Statistics Canada. May 26, 2021. Economic and Social Reports. “Neighbourhood characteristics and life satisfaction of individuals in lower-, middle-, and higher-income families in Canadian metropolitan areas.” https://www150.statcan.gc.ca/n1/pub/36-28-0001/2021005/article/00006-eng.htm
Statistics Canada. April 15, 2021. Income Research Paper Series. “Canadians’ Well-being in Year One of the COVID-19 Pandemic.” https://www150.statcan.gc.ca/n1/pub/75f0002m/75f0002m2021003-eng.htm
Appendix B: Selected Quality of Life data tables based on the Canadian Social Survey
Life satisfaction by gender and other selected sociodemographic characteristics
Sense of meaning and purpose by gender and other selected sociodemographic characteristics
Sense of meaning and purpose by gender and province
Future outlook by gender and province
Future outlook by gender and other selected sociodemographic characteristics
Loneliness by gender and province
Loneliness by gender and other selected sociodemographic characteristics
Having someone to count on by gender and province
Having someone to count on by gender and other selected sociodemographic characteristics
Sense of belonging to local community by gender and province
Sense of belonging to local community by gender and other selected sociodemographic characteristics
Satisfaction with time use by gender and province
Satisfaction with time use by gender and other selected sociodemographic characteristics
Satisfaction with local environment by gender and province
Satisfaction with local environment by gender and other selected sociodemographic characteristics
Satisfaction with personal relationships by gender and province
Confidence in institutions by gender and province
Confidence in institutions by gender and other selected sociodemographic characteristics
Trust in others by gender and province
Trust in others by gender and other selected sociodemographic characteristics
Sense of belonging to Canada by gender and province
Sense of belonging to Canada by gender and other selected sociodemographic characteristics
Perceived mental health by gender and province
Perceived mental health by gender and other selected sociodemographic characteristics
Perceived health by gender and province
Perceived health by gender and other selected sociodemographic characteristics
- Date modified: