
Income Research Paper Series
The financial resilience and financial well-being of Canadians during the COVID-19 pandemic
by Kirk Donaldson, Jonathan Fonberg, Andrew Heisz, Jennifer Kaddatz, Julie Kaplan, Eric Olson, Ian Walker
Statistics Canada
Eloise Duncan and Kujtim Koci
Seymour Management Consulting Inc.
Telling the story of financial well-being in Canada: a myriad of perspectives
As Canada begins the path to recovery from the health and economic impacts of the COVID-19 pandemic, there is a heightened awareness of the need for households to maintain or build their financial resilience. Global uncertainty, increasingly longer life spans, the changing nature of work, changing work-life patterns, housing affordability, high debt loads, and the impact of unplanned life events, amongst other factors, mean that many CanadiansNote are needing to manage and, where possible, improve their financial resilience. The unprecedented situation brought on by the global pandemic has had significant economic impacts on most people in Canada, challenged the finances of many households and exacerbated inequalities that existed before the crisis. While some families have profited financially from the pandemic, others have experienced a considerable downturn.
Although fiscal and monetary support have certainly supported many households to bridge over the crisis financially, there remain concerns over the financial vulnerability of some households and borrowersNote . The purpose of this report is to provide insights on the financial well-being and financial resilience of Canadians during the first year of the COVID-19 pandemic. The report provides evidence using data from widely different sources.
In the first section of this paper, data from Statistics Canada’s Labour Force Survey illuminate the question of how many Canadians live in a household facing difficulty meeting its key expenses during the pandemic, and, furthermore, which Canadians are experiencing such hardship. The second section of the paper explores trends in the weekly income of Canadians throughout the pandemic, looking at the manner in which fiscal supports have helped certain households stay afloat over the past year and a half. Finally, in the third section of the paper, information is presented from the Seymour Financial Resilience IndexTM which illuminates the manner in which many households have become more financially resilient during the pandemic, having increased their ability to get through financial hardship, stressors and shocks as a result of unplanned life events. Together, these different sources show the multifaceted nature of financial well-being in Canada.
The report is coauthored by Seymour Management Consulting Incorporated [Seymour Consulting] and Statistics Canada. It builds on the Statistics Canada report Canadians' Well-being in Year One of the COVID-19 Pandemic (Charnock et al., April 2021) and reports published by Seymour Consulting. In light of the intersections between economic, social and environmental factors impacting the well-being of Canadians and the fact that the pandemic has affected households unevenly, increasing understanding of households’ financial resilience can help policymakers and other stakeholders in advancing financial well-being and economic opportunities for Canadians.
Canadians report challenges in meeting their basic financial needs: Labour Force Survey
Beginning in April 2020, close to the start of the COVID-19 pandemic in Canada, Statistics Canada collected an additional question through its supplement to the Labour Force Survey (LFS). This new question asked respondents “How difficult or easy was it for your household to meet its financial needs in terms of transportation, housing, food, clothing and other necessary expenses?”, allowing to classify Canadians of all ages into different levels of perceived household financial security based on responses. The resulting data allow for simple and straightforward analysis of the financial well-being of Canadians (based on their household’s perceived situation) during a year-long period during the COVID-19 pandemic and highlight the differences between diverse groups of Canadians.
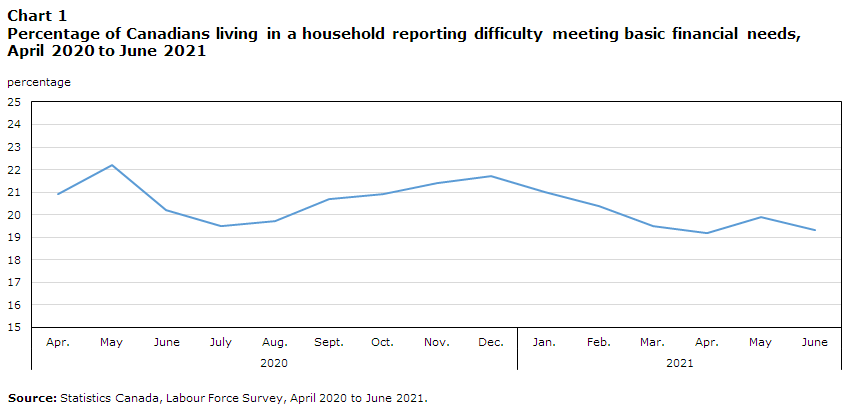
Between April 2020 and June 2021, LFS dataNote revealed fluctuations by month in terms of the share of persons living in households reporting difficulty in meeting their financial needs (Chart 1). The peak of those in households reporting that meeting their needs in terms of necessary expenses was either “difficult” or “very difficult” was observed in May 2020 at 22.2%. However, as the number of COVID-19 cases lowered nationally in JulyNote the share of those in households experiencing hardship in terms of meeting financial needs decreased to 19.5%. This proportion subsequently rose again with the onset of the second wave in fall 2020, reaching 21.7% in December 2020; a level close to the observed peak in May 2020. In the first half of 2021, the proportion trended downward again, ending up at 19.3% in June.
Looking at financial difficulty in the context of employment data, it is perhaps not surprising that adults aged 15 and over who had lost their jobs or begun to work reduced hours were more likely to be living in a household reporting difficulty in meeting their financial needs. For example, in May 2020, among individuals aged 15 and over, those who were unemployed (34.1%) or working fewer hours than normal for reasons likely due to the pandemic (27.6%) were more likely to be in a household facing financial hardship than those whose employment was unaffected by the pandemic (16.2%). At that time, there was no significant difference between the estimates for unemployed individuals and those who worked reduced hours. However, by September, unemployed individuals (42.6%) were more likely to report financial hardship than those who worked fewer hours (32.9%). This difference remained in June 2021. This finding may reflect the pandemic depleting the financial resources of some Canadians over time.
Data table for Chart 1
| percentage | |
|---|---|
| 2020 | |
| Apr. | 20.9 |
| May | 22.2 |
| June | 20.2 |
| July | 19.5 |
| Aug. | 19.7 |
| Sept. | 20.7 |
| Oct. | 20.9 |
| Nov. | 21.4 |
| Dec. | 21.7 |
| 2021 | |
| Jan. | 21.0 |
| Feb. | 20.4 |
| Mar. | 19.5 |
| Apr. | 19.2 |
| May | 19.9 |
| June | 19.3 |
| Source: Statistics Canada, Labour Force Survey, April 2020 to June 2021. | |
While the general trend of reporting difficulty meeting financial needs which was observed between April 2020 and June 2021 was somewhat consistent across demographic groups, some segments of Canadian society have been particularly vulnerable to the financial impacts of the pandemic. Not all Canadians have access to the same financial resources and these difficulties were often magnified and intensified by the pandemic experience (Charnock et al., April 2021; Statistics Canada, October 2020). Among the groups who reported heightened levels of difficulty were persons living in single parent households, seniors, immigrants to Canada, persons identified as visible minorities and Indigenous peoplesNote .
Regardless of demographic or diversity group, household composition is related to financial resources. This was apparent during the pandemic and was illuminated in the LFS data, as those living in single parent households were significantly more likely to experience financial hardship than those living in non-single parent households in all months in the period from April 2020 to June 2021. In May 2020, 33.3% of people living in single parent households faced financial hardship compared to only 21.3% for those in non-single parent households.
Financial resources are also often linked to a person’s age and life trajectory, with older Canadians having had more opportunity to develop financial resources than younger cohorts. In addition, many older adults in Canada are supported at least in part by government programs such as Old Age Security, the Canada Pension Plan and the Guaranteed Income Supplement (Government of Canada, January 2020). Accordingly, while Canadians of all age groups were at risk of experiencing financial difficulties during the pandemic, those aged 65 and older were less likely to live in a household that reported financial hardship in the LFS question on that topic. For example, in May 2020 when the peak of financial difficulties reached 22.2% for persons of all ages, 17.3% of seniors aged 65 and older were in a household that experienced difficulties. In comparison, the proportion was 26.2% among 15 to 24 year olds, 23.9% among 35 to 44 year olds and 23.7% among 0 to 14 year oldsNote .
Financial resources are frequently linked, too, to a person’s status as a newcomer to Canada with immigrants, particularly more recent immigrants, sometimes struggling to find work and create business connections and thus not having had the same opportunities to build up financial resources. In addition, those who have lived in Canada for less than a decade are not always eligible for government income supports in Canada.Note In May 2020, among individuals aged 15 or older, nearly three-in-ten (27.8%) immigrants compared with two-in-ten (19.1%) Canadian-born adults lived in a household reporting that meeting its needs in terms of necessary expenses was either “difficult” or “very difficult”Note . This gap between the Canadian-born and immigrants has persisted throughout the pandemic thus far.
Trends in the reporting of financial difficulties from the summer of 2020 onwards among persons designated as visible minorities and Indigenous peoples were generally consistent with trends for the general populationNote . Nevertheless, among the population aged 15 to 69 years, the share of persons whose household experienced difficulty meeting its financial needs was significantly higher for persons designated as visible minoritiesNote or reporting Indigenous identityNote than for other Canadians. For example, in July 2020, nearly three-in-ten persons designated as a visible minority (29.2%) and nearly three-in ten Indigenous people (28.7%) lived in a household that reported experiencing hardship compared to fewer than two-in-ten (15.9%) Canadians belonging to neither group.
Some visible minority groups are likely to experience a higher degree of financial challenges than others in Canada, and even amongst persons designated as visible minorities there can be considerable gaps in overall financial well-being. For example, a recent Labour Force Survey article focussing specifically on Asian-CanadiansNote Note (Statistics Canada, May 2021) indicated that South Asian Canadians were twice as likely to live in a household reporting difficulty meeting essential financial needs (29.6%), compared with Canadians who are not a visible minority (15.7%) during the three months ending in April 2021. Lower average hourly earnings for both South Asian men ($30.69) and women ($25.91), compared with men ($32.78) and women ($29.06) that are not a visible minority, were likely a contributing factor to these financial difficulties. In comparison, Filipino Canadians seemed to struggle even more, with more than two-fifths (40.3%) of Filipino Canadians living in a household reporting financial difficulties during the three months ending in April 2021. On average, Filipino Canadians earned $23.63 per hour, compared with $30.95 for Canadians not designated as a visible minority. In other words, Filipino workers earned on average $0.76 for every dollar earned by non-visible minority workers.
Canadians worry about their finances: The Financial Consumer Agency of Canada
The Financial Consumer Agency of Canada (FCAC) has been conducting surveys on financial well-being to learn more about the worries that Canadian adults have about their financial situation and how Canadian households are adapting their financial behaviours under the stress of the COVID-19 pandemic.
The FCAC’s online dashboard compares the survey results from the monthly COVID-19 Financial Well-Being SurveyNote with those of their 2019 Canadian Financial Capability Survey to provide insight into how Canadians’ financial behaviors, capabilities and knowledge have changed since the onset of the pandemic.
Their survey results have shown increased fiscally responsible behaviour in that there was a statistically significant rise from 49% in 2019 to 56% of households using a budget during the pandemic. About half (51%) of households reported a financial impact due to the COVID-19 pandemic and the increase in budget use may be a response to these financial impacts. Looking further at those impacts, 35% of Canadian households who had debt said it had increased and 67% of households whose debt increased attributed it to COVID-19. Moreover, 37% of households reported they have accessed their savings to cope with the impacts of COVID-19Note . One area of concern is the increase in households who are short on money at the end of the month, which rose from 19% in 2019 to 28% during the pandemic.
More information on the COVID-19 Financial Well-Being Survey and the 2019 Canadian Financial Capability Survey is available on the FCAC’s website.
Pandemic relief programs have helped many households: Statistics Canada’s weekly income estimates
The COVID-19 pandemic has led to considerable work interruptions for many family and individual households in Canada since March of 2020. In turn, many households have sought out assistance to help them meet essential living expenses (Barnhart et al., March 2021; Barnhart et al., July 2021).
According to Statistics Canada’s Labour Force Survey (LFS), in June 2020, almost 3 in 10 (29%) Canadians aged 15 to 69 reported receiving some kind of assistance from the federal government. At the same time, results suggested that relief benefits programs likely offset a surge of low income during the pandemic for a large portion of families in Canada.
To develop this conclusion, Statistics Canada developed an experimental weekly family earnings estimate and an experimental weekly family income estimate, combining information from the monthly LFS, income tax data, and administrative data on payments made to families through government programs. The government transfers included in the experimental income estimate were Employment Insurance (EI) benefits, General and Harmonized Sales Tax Credits, Canada Child Benefits and provincial child benefits, and programs specifically targeted to pandemic relief – the Canada Emergency Response Benefit (CERB), Canada Emergency Student Benefit, Canada Recovery Benefit, Canada Recovery Sickness Benefit and Canada Recovery Caregiving Benefit. The results were available only for families with no members aged 65 and over, as income from seniors benefits and pensions had not been factored into the estimates.
According to these experimental estimates, while median weekly family earnings (wages, salaries and self‑employment income) fell significantly from February 2020 to April 2020 (‑22%), median weekly family income, which includes income from CERB and other pandemic relief programs, was relatively unchanged, reflecting the positive effect of the pandemic relief programs (Chart 2).
The report also defined low-weekly family earnings and low-weekly family income. Low-income thresholds were developed based upon having 50% of the respective provincial median income observed in 2019, adjusted for family size. Similar to the results on weekly earnings and income, a surge in the proportion of persons having low weekly family earnings, was offset by increases in government transfers.
Specifically, the share of persons in families with family earnings below the low-income threshold rose from 28.4% in February to 39.3% in April (an increase of 10.9 percentage points). With the addition of EI, CERB and other relief benefits introduced in the latter part of 2020, there was only a slight increase in the share of individuals whose family income was below the provincial threshold between March and April 2020. Further, the share of persons in families with family income (including pandemic benefits) below the low-income threshold actually fell from February to April 2020, from 23.3% to 19.8%, reflecting the impact of the pandemic relief programs. The experimental low-weekly income rate then climbed during the second half of 2020 as the CERB program was replaced by a combination of new programsNote and a revamped employment insurance program, but remained below its pre-pandemic level, sitting at 17.2% in March 2021.

Data table for Chart 2
| Using weekly earnings | Using weekly incomeData table for Chart 2 Note 1 | |
|---|---|---|
| percentage | ||
| 2020 | ||
| Jan. | 28.7 | 23.4 |
| Feb. | 28.4 | 23.3 |
| Mar. | 33.1 | 19.5 |
| Apr. | 39.3 | 19.8 |
| May | 33.4 | 15.2 |
| June | 29.2 | 14.8 |
| July | 28.6 | 16.8 |
| Aug. | 28.0 | 16.3 |
| Sept. | 26.8 | 16.4 |
| Oct. | 27.7 | 18.3 |
| Nov. | 27.4 | 18.7 |
| Dec. | 26.9 | 17.7 |
| 2021 | ||
| Jan. | 28.3 | 18.3 |
| Feb. | 27.7 | 17.6 |
| Mar. | 26.3 | 17.2 |
Source: Statistics Canada, Experimental estimates of family weekly income, January 2020 to March 2021 (catalogue number 75F0002M2021006). |
||
The LFS results presented earlier showed that single-parent households tended to have more difficulty in meeting their essential expenses. The experimental weekly income estimates for different family types suggest that the drops in median weekly earnings observed from February to April 2020 were larger for single-parent families (-40.9%) than couple families with kids (-19.0%). However, these earning declines for single-parent families were offset by government transfers, including the CERB. Accordingly, although the share of persons living in single parent families with low weekly earnings had increased, the share of persons in single parent families with low weekly income was relatively unchanged at 35.9% in April 2020 compared to 39.7% in February 2020. Trends were similar for men and women, reflecting the fact that the family-based measures would mask gender differences in the pandemic-related economic shock.
Again mirroring the LFS data shown earlier, the weekly income estimates reveal that Canadians designated as visible minorities and Indigenous peoples have tended to face more difficult job market situations during the pandemic than persons who are not in a visible minority. For example, in March 2021, the low weekly-income rate remained higher for Indigenous peopleNote (23.2%), Black Canadians (19.5%), Chinese (23.7%) and South Asians (17.3%) than for persons who are not a visible minority (16.7%). Nevertheless, here again, the addition of government benefits appears to have made a large difference to some of Canada’s diverse populations.
Looking at family earnings without supplementation by government benefits, 41.1% of persons designated as a visible minority were in a low income position in May 2020 (the first month for which these data are available), with that number declining to 29.3% by March 2021. In comparison, when government benefits were included, 16.2% were observed to be in a low income position in May 2020 and 18.3% in March 2021.
The financial resilience of households: based on the Seymour Financial Resilience IndexTM
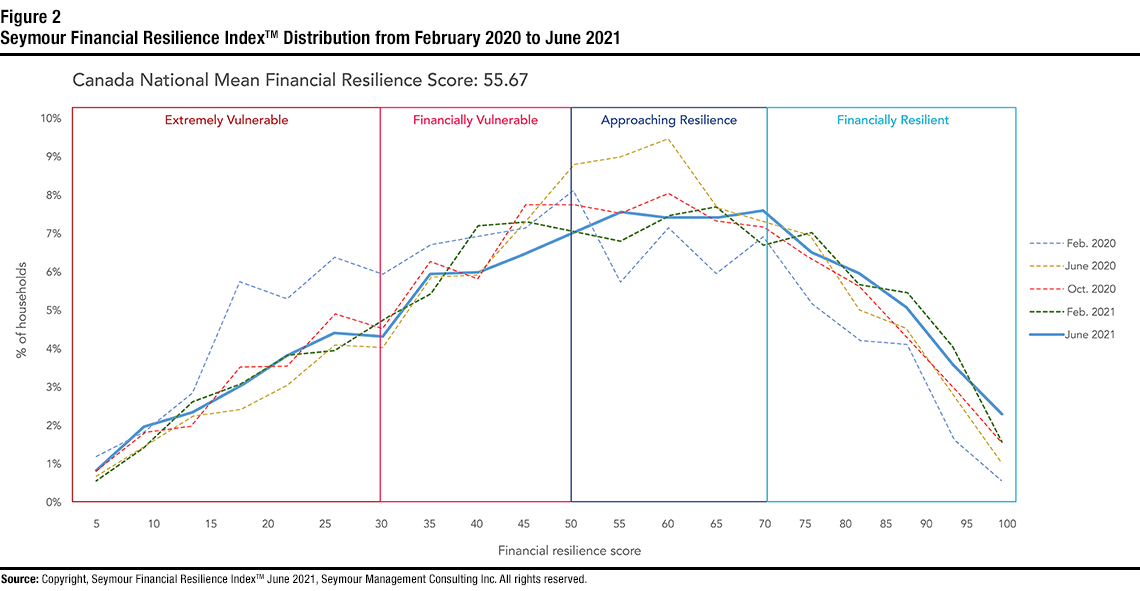
The Seymour Financial Resilience IndexTM measures and tracks households’ financial resilience, defined as their ability to get through financial hardship, stressors and shocks as a result of unplanned life eventsNote . The Index has a baseline of February 2020 (pre-pandemic) and measures and tracks households’ financial resilience every four months through June 2021 (to date)Note . Households’ financial resilience is based upon nine behavioural, resilience and sentiment indicators, including having a liquid savings buffer, financial stress over current and future financial obligations, social capital, confidence in ability to meet short term savings goals, a debt management composite indicator, a person’s self-reported credit score, and other indicators.
Based on these indicators, Canadians are scored from 0 to 100 in terms of their household’s financial resilience, creating four financial resilience segmentsNote . These segments are labelled as ‘Extremely Vulnerable’ (with a financial resilience score of 0 to 30); ‘Financially Vulnerable’ (with a score of 30.01 to 50); ‘Approaching Resilience’ (with a score of 50.01 to 70) and ‘Financially Resilient’ (with a score of 70.01 to 100)Note . Households’ financial resilience is measured at the national, provincial, demographic segment and individual household level.
The Index was motivated by results confirming that financial stress and financial vulnerability have been mainstream issues since well before the pandemic, based on Seymour Consulting’s national Financial Well-Being Studies conducted since 2017, and by the linkage between households’ financial well-being and their overall well-being.

Description for Figure 1
This figure is composed of two images side by side: one showing the mean financial resilience score for Canada on the left side, and another showing financial resilience segment populations on the right side.
The Mean Financial Resilience Score for Canada (image on the left side)
This image shows a map of Canada with the Canada Mean Financial Resilience Score of 55.67 in June 2021, represented as dark red dots covering just over half of Canada. The dark red dots fill the map image from the bottom up to a midway point in the image. The remaining top half of Canada is filled in with light red dots. The scores for February 2021, October 2020, June 2020, and the February 2020 baseline are listed along the right-hand side of the map.
Canada Mean Financial Resilience Scores (Index values):
- 55.67 in June 2021
- 55.69 in February 2021
- 54.53 in October 2020
- 55.58 in June 2020
- 49.58 in February 2020 (Baseline)
Financial resilience segment populations (image on the right side)
This image shows a map of Canada with four segments of financial vulnerability according to the Seymour Financial Resilience IndexTM. The segments are listed from left to right and colour-coded: Extremely Vulnerable (red), Financially Vulnerable (pink), Approaching Resilience (dark blue), and Financially Resilient (light blue). The percentage and number of people in each segment are listed under the map.
Percentage (and number) of people in each financial resilience segment:
- 16.5% Extremely Vulnerable (4.26 million people)
- 22.8% Financially Vulnerable (5.88 million people)
- 29.6% Approaching Resilience (7.64 million people)
- 31.1% Financially Resilient (8.03 million people)
Note for both images: Based on a population of 25.81 million Canadians aged 18 years old to 70 years old, July 2019 (Statistics Canada).
Source for both images: Copyright, Seymour Financial Resilience IndexTM June 2021, Seymour Management Consulting Inc. All rights reserved.
The national mean financial resilience score for Canada increased from 49.58 in February 2020 (pre-pandemic) to 55.67 in June 2021. Increases in the mean national financial resilience score for Canada signal improved financial resilience for households during the first year of the pandemic. In June 2021, 16.5% of households were found to be ‘Extremely Vulnerable’, 22.8% were ‘Financially Vulnerable’, 29.6% were ‘Approaching Resilience’ and 31.1% were ‘Financially Resilient’.
Data table for Figure 2
| Financial resilience segment | Financial Resilience Score | February 2020 | June 2020 | October 2020 | February 2021 | June 2021 |
|---|---|---|---|---|---|---|
| percent of households | ||||||
| Extremely Vulnerable | 0 to 5 | 1.2 | 0.7 | 0.8 | 0.6 | 0.9 |
| 5.01 to 10 | 1.8 | 1.5 | 1.8 | 1.4 | 2.0 | |
| 10.01 to 15 | 2.8 | 2.2 | 2.0 | 2.6 | 2.3 | |
| 15.01 to 20 | 5.8 | 2.4 | 3.5 | 3.1 | 3.0 | |
| 20.01 to 25 | 5.3 | 3.0 | 3.6 | 3.9 | 3.8 | |
| 25.01 to 30 | 6.4 | 4.1 | 4.9 | 4.0 | 4.4 | |
| Financially Vulnerable | 30.01 to 35 | 6.0 | 4.1 | 4.6 | 4.8 | 4.3 |
| 35.01 to 40 | 6.7 | 5.9 | 6.3 | 5.5 | 6.0 | |
| 40.01 to 45 | 7.0 | 5.9 | 5.8 | 7.2 | 6.0 | |
| 45.01 to 50 | 7.2 | 7.3 | 7.8 | 7.3 | 6.5 | |
| Approaching Resilience | 50.01 to 55 | 8.2 | 8.8 | 7.8 | 7.1 | 7.1 |
| 55.01 to 60 | 5.8 | 9.0 | 7.5 | 6.8 | 7.6 | |
| 60.01 to 65 | 7.2 | 9.5 | 8.1 | 7.5 | 7.5 | |
| 65.01 to 70 | 6.0 | 7.7 | 7.4 | 7.7 | 7.4 | |
| Financially Resilient | 70.01 to 75 | 7.0 | 7.4 | 7.2 | 6.7 | 7.6 |
| 75.01 to 80 | 5.2 | 7.0 | 6.4 | 7.1 | 6.5 | |
| 80.01 to 85 | 4.2 | 5.0 | 5.7 | 5.7 | 6.0 | |
| 85.01 to 90 | 4.1 | 4.5 | 4.3 | 5.5 | 5.1 | |
| 90.01 to 95 | 1.6 | 2.8 | 3.0 | 4.0 | 3.6 | |
| 95.01 to 100 | 0.5 | 1.0 | 1.6 | 1.6 | 2.3 | |
|
Note: Canada National Mean Financial Resilience Score, June 2021: 55.67. |
||||||
Figure 2 shows the changing distribution of Index values between February 2020 and June 2021. As of June 2021, 31.1% of households at the national level were ‘Financially Resilient’ up from 22.7% in February 2020. Over the same period, there was a decrease in the size of ‘Extremely Vulnerable’ households from 23.3% of the population in February 2020 to 16.5% as of June 2021.
The improvement in Canadians’ financial resilience since the onset of the pandemic is supported by many factors. These include Government COVID-19 financial support and changes in households’ consumer spending and financial behaviours amid lockdowns. Between February 2020 and June 2020, all nine Index indicators showed improvements. Between October 2020 and February 2021, two indicators that showed more significant improvement were ‘confidence in ability to meet short term savings goals’ and ‘change in household financial situation over the past 12 months’.
The data for June 2021 also reveal:
- Nationally, nearly a quarter of households (24.3%) reported having a liquid savings buffer of three weeks or less.
- 32.9% of the population had a negative or zero household savings rate and one in two reported that an unexpected life event or big expense over the past year had set them back financially.
- 22.6% of households reported that their debt levels feel somewhat or very unmanageable.
- 86.1% reported that the cost of living has increased for them in the past twelve months and 49.3% reported that housing affordability is a problem for them.
- 26% of households reported that someone in their household had lost their job as a result of COVID-19 and 37.7% of household responders reported that they or their partner had to work reduced hours as a result of the pandemic.
- 47.8% of renter households completely agreed and 26.8% somewhat agreed that that the rising cost of rent is a problem for them.
- 40.7% of households completely or somewhat agreed that they did not feel secure in their job or work situation.
- Just over a third (34%) of households had social capital (i.e. a partner, family member or close friend) that they would be prepared to turn to for financial support or advice in times of financial hardship, 30.4% had social capital but were not able or willing to access it, and 35.6% of households could only rely on themselves.
The Seymour Financial Resilience IndexTM is a proprietary regression model that builds on five years of national longitudinal financial well-being data for Canada. The Index is developed using data from the 2017-2021 Financial Well-Being studies, a 15-minute online survey conducted with 3,000 to 5,000 adult Canadians from a representative sample of the population by province, age, gender, and household income, with respondents recruited through the Angus Reid Forum and all survey design and analysis conducted by Seymour Consulting. The Financial Well-Being studies were originally conducted annually from 2017 to 2019. As of 2020, the studies are conducted every four months. The studies and Index measure and track the financial resilience of tier one bank customers, and the extent to which financial institutions and other organizations are helping to improve the financial wellness of their customers at the national, provincial, segment and individual household level. Households’ challenges in terms of access to financial products, services, information, support and advice are tracked for Canadians and specific populations, along with reported consumer and financial behaviours, financial and debt stressors and the extent to which financial stress impacts the overall well-being of households.
For more information, please refer to About the Seymour Financial Resilience IndexTM and Seymour Consulting's website.
Changes in behaviours help to maintain or improve financial resilience
The Financial Well-Being studies also ask questions about positive behaviours and strategies households may be using that could improve their financial resilience, and about more challenging behaviours or barriers impacting financial vulnerability. In many instances, households showed an increased incidence of these behaviours over the pandemic. Specifically, in June 2021,
- 62.1% of households reported having significantly reduced their non-essential expenses.
- 23.9% of households reported having established or built up an emergency savings fund, compared to 18% in October 2020.
- 22.3% of households reduced or consolidated their debt, compared to 15.2% in June 2020.
- 62.9% of households reported that they had become more creative around ways to make their money work harder, 35.7% found new ways to earn money and many households had taken steps to improve their financial literacy.
Linkages between financial well-being and other dimensions of quality of life
The linkages between financial well-being and other dimensions of quality of life are also measured through the 2017-2021 Financial Well-Being studies, providing insights by financial resilience segment and for demographic groups. These include renters, homeowners with and without a mortgage, single parent families, Indigenous Canadians, low income families and borrowers struggling with their debt manageability with high levels of stress over their current and future financial obligations. Respondents who scored as ‘Extremely Vulnerable’ through the Index were much more likely to report low financial well-being, emotional well-being and mental health, physical well-being, satisfaction with work, and feelings of connectedness with neighbours and community, and to have poorer relations with friends and family (Figure 3)Note .

Data table for Figure 3
| Aspect of life rated from 1 to 10 | Extremely Vulnerable | Financially Vulnerable | Approaching Resilience | Financially Resilient |
|---|---|---|---|---|
| number | ||||
| Financial well-being | 3.1 | 5.0 | 6.4 | 8.0 |
| Emotional well-being / mental health | 4.0 | 5.1 | 5.9 | 6.8 |
| Physical well-being | 4.7 | 5.4 | 6.1 | 6.8 |
| Satisfaction with work | 4.8 | 5.4 | 6.1 | 6.7 |
| Relationships with your friends and family | 5.8 | 6.3 | 6.8 | 7.4 |
| Feeling connected with your neighbours and community | 3.8 | 4.5 | 5.1 | 5.7 |
|
Note: Respondents are asked this question: “Following are six aspects that can contribute to your overall personal well-being. How would you rate each aspect of your life? Please use a scare of 1 to 10, where 1 is ‘Poor’ and 10 is ‘Excellent’”. Source: Copyright, Seymour Financial Resilience IndexTM 2021, Seymour Management Consulting Inc. All rights reserved. |
||||
The Index also affirms that employment has a positive relationship with financial resilience. As of February 2021, mean financial resilience scores were 51.42 for part time workers and 58.66 for full time workers. Underemployed and unemployed Canadians and those impacted by job losses and/or reduced hours had lower mean financial resilience scoresNote . According the Index, more retired Canadians and full-time employed Canadians became ‘Financially Resilient’ between June 2020 and February 2021.
In addition, data show that home ownership does not always equate to financial resilience. As of February 2021, 67% of Canadian homeowners with a mortgage were not ‘Financially Resilient’ while 18% of homeowners without a mortgage were ‘Extremely Vulnerable’ or ‘Financially Vulnerable’. In addition, 23.1% of homeowners with a mortgage reported having a “bit too much” or “far too much” debt than is manageable. In the same month, 18.9% of renters were ‘Financially Resilient’.
The financial resilience gap and inequities for Canadians
The Seymour Financial Resilience IndexTM highlights a ‘financial resilience gap’ for Canadians. There are inequities for households evidenced through the Index, which in turn impact the financial well-being and overall well-being of Canadian individuals and families. For example, as of February 2021,
- 83% of ‘Extremely Vulnerable’ and 65% of ‘Financially Vulnerable’ households reported facing significant financial hardship, compared to 36% of ‘Approaching Resilience’ and 11% of ‘Financially Resilient’ households.
- 53% of ‘Extremely Vulnerable’ and 50% of ‘Financially Vulnerable’ households were impacted by reduced hours as a result of the pandemic, compared to 41.5% and 23.5% of ‘Approaching Resilience’ and ‘Financially Resilient’ households respectively as of February 2021. More people from financially vulnerable segments also experienced job loss.
- 37.2% of ‘Extremely Vulnerable’ Canadians reported that their household income had decreased in the last year by more than 25%, compared to 6% among ‘Financially Resilient’ households.
- 58% of ‘Extremely Vulnerable’ households also reported that their household was unable to meet their essential expenses (shelter, food, utilities and transport) compared to 2% of ‘Financially Resilient’ households.
- 43% of ‘Financially Vulnerable’ households had a zero or negative household savings rate, compared to 3.3% of ‘Financially Resilient’ households.
- 70% of ‘Extremely Vulnerable’ Canadians drew down their savings and 26.4% used a food bank compared to rates of 10.5% and 1% respectively for ‘Financially Resilient’ households.
Women and single-parent families
As of June 2021, the mean financial resilience score was 53.41 for women compared to 57.9 for men, highlighting a continued ‘financial resilience gender gap’. Single parent families are also more financially vulnerable. The mean financial resilience score for single parent families was 50.26 (compared to 59.94 for married couples) with this having increased from 43.68 in June 2020 to 46.51 in February 2021. Mean financial resilience also improved for female single parent families from 36.06 in February 2020 to 46.52 in June 2021Note .
There was a two-point increase in the mean financial resilience score of women at the national level from October 2020 to February 2021, with this improvement primarily attributable to millennial women (defined as those born between 1982 and 2002), who increased their mean financial resilience score from 51.5 in October 2020 to 55.2 in February 2021. In February 2021, seven out of ten millennial women reported having significantly reduced their non-essential expenses and 28.4% reported having reduced or consolidated their debt, up ten percentage points over October 2020. Many millennial women also set up or built an emergency savings fund, up from 23.2% in October 2020 to 34.6% in February 2021.
The financial resilience of households can improve or deteriorate within a short timeframe
Seymour Consulting conducts longitudinal analysis to track changes in households’ financial resilience for the same households that answer multiple Financial Well-Being study surveys. This provides evidence of how Canadians’ financial resilience can improve or deteriorate within a few months, as a result of their behavioural changes, planned or unplanned life events causing improvements or setbacks and factors such as accessing social capital or financial education, help or advice.
Between June 2020 and February 2021, 21% of households who answered both Financial Well-Being studies surveys ‘slipped down’ one or two financial resilience segments and became ‘Extremely Vulnerable’, 16% of households moved up one or more segments to become ‘Financially Resilient’ and 63% of households stayed in the same segment. Households who slipped down a financial resilience segment were more likely to have been impacted by job losses or reduced working hours as a result of COVID-19 impacts. Households who significantly reduced their non-essential expenses were more likely to move up segments compared to those who did not reduce these expenses. Working on debt consolidation, setting up emergency funds, taking steps to improve financial literacy and meeting with financial advisors also seemed to have had a positive impact on the ability of households to improve their financial resilience score.
In conclusion: A summary of financial well-being during the COVID-19 pandemic
This report provides insights on the financial resilience and financial well-being of households in Canada during the first year of the pandemic. By examining the question through several lenses and data sources, the financial well-being of Canadians is revealed to be complex and multifaceted.
The Seymour Financial Resilience IndexTM highlights that, at the national level, households’ financial resilience the first year of the pandemic has increased with the Index value rising from 49.58 in February 2020 to 54.53 in February 2021. Over the same one-year period, there has been a decline of Canadians living in ‘Extremely Vulnerable’ households from 23.3% to 15.5% of the population. The improvement in Canadians’ financial resilience since the onset of the pandemic has been supported by the swift introduction of government COVID-19 financial support and by changes in household consumer spending and financial behaviours. Nevertheless, while 30.5% of Canadians are in ‘Financially Resilient’ households and can endure financial shocks with little effect to their overall financial resilience based on the February 2021 Index, close to seven in ten show indication of financial vulnerability on some level in the face of future shocks. Index data reveal differences across financial resilience segments, provinces, demographic groups and other dimensions.
Statistics Canada’s addition of a new question to the monthly Labour Force Survey (LFS)’s supplement as of April 2020 allowed for analysis of the financial well-being of Canadians throughout the COVID-19 pandemic. At the national level, the proportion of Canadians living in households who reported it was “difficult” or “very difficult” to meet financial needs in terms of necessary expenses followed the waves of the pandemic, peaking at 22.2% in May 2020 and again at 21.7% in December 2020. The proportion of Canadians experiencing financial hardship during the pandemic varied between population groups. Seniors were less likely to report financial difficulty, while individuals who were unemployed or working fewer hours than normal, living in a single parent household, immigrants, visible minorities or Indigenous were more likely.
Results from Statistics Canada’s Experimental family weekly income estimates show that a potentially large surge in low-income caused by a decline in earnings between February and April 2020 was offset by government pandemic relief programs, such that, after including benefits such as the Canadian Emergency Response Benefit (CERB), there was no increase in the share of persons having low weekly family income. Nevertheless disparities across group remain notable, with persons in lone-parent families, Black and Chinese Canadians and members of First Nations having higher weekly low income rates than others over the pandemic.
Appendix 1: Measuring what matters: Financial well-being and the Quality of Life Framework for Canada
Measuring What Matters, a publication accompanying Canada’s 2021 federal government budget released on April 19, 2021, presented the first iteration of the Quality of Life Framework for Canada which the Department of Finance Canada and Statistics Canada have been mandated to develop together (Department of Finance, April 2021).
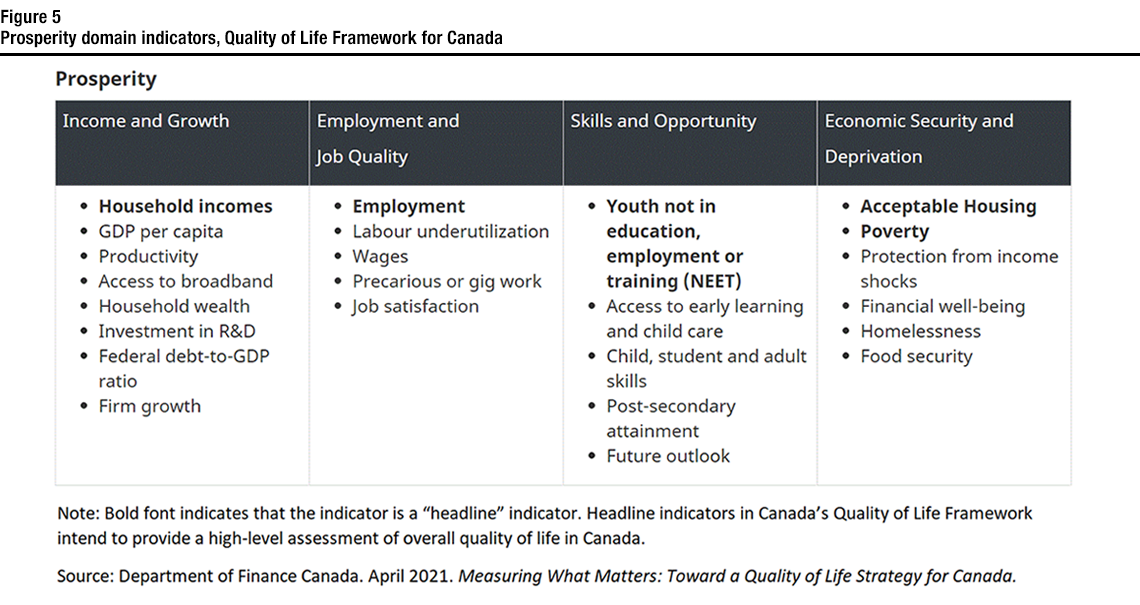
The Quality of Life Framework includes five domains – Prosperity, Health, Society, Good Governance and the Environment – encircled by the ideals of Fairness and Inclusion and Sustainability and Resilience (Figure 4). Each domain includes various subdomains and a number of indicators key to the well-being of people in Canada. Overall, the framework includes more than 80 indicators and 19 headline indicators. The headline indicators in Canada’s Quality of Life Framework intend to provide a high-level assessment of overall quality of life in Canada when a short list of indicators is preferable to the complete list of indicators. The Prosperity domain includes a subdomain called “Economic Security and Deprivation” which includes the headline indicator “Financial Well-being” (Figure 5).
Statistics Canada is actively leading the development of technical definitions and metadata for indicators in the Quality of Life Framework. A technical definition for a financial well-being indicator is expected to be completed by 2022 in consultation with the Department of Finance and experts from within and outside of the federal government.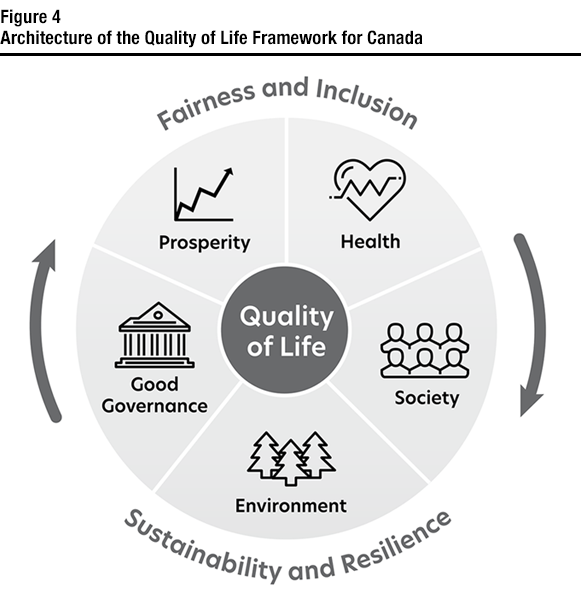
Description for Figure 4
This image illustrates the Quality of Life Framework for Canada. It is represented as a circular graphic with the term 'Quality of Life' in a circle at its centre. The circular graphic is divided into five segments which represent each of the five domains of the framework: Prosperity, Health, Society, Environment, and Good Governance. The Prosperity domain is represented by an image of a line graph, the Health domain with a heart and heartbeat (electrocardiogram) line, Society by a group of people, Environment by trees, and Good Governance by a building resembling a courthouse. The two lenses of the framework, Fairness and Inclusion and Sustainability and Resilience, encircle the image, represented by curved arrows.
Description for Figure 5
This figure shows the subdomains and indicators which make up the Prosperity domain of the Quality of Life Framework for Canada.
The four subdomains of the Prosperity domain are shown in four columns: Income and Growth, Employment and Job Quality, Skills and Opportunity, and Economic Security and Deprivation.
In each column, the subdomain’s indicators are listed. Within the list of indicators, headline indicators appear at the top in bolded font. A note at the bottom of the image indicates that headline indicators in Canada’s Quality of Life Framework intend to provide a high-level assessment of overall quality of life in Canada.
Under the subdomain of Income and Growth, the indicators are:
- Household incomes (headline)
- GDP per capita
- Productivity
- Access to broadband
- Household wealth
- Investment in R&D
- Federal net debt-to-GDP ratio
- Firm growth
Under the subdomain of Employment and Job Quality, the indicators are:
- Employment (headline)
- Labour underutilization
- Wages
- Precarious or gig work
- Job satisfaction
Under the subdomain of Skills and Opportunity, the indicators are:
- Youth not in education, employment or training (NEET) (headline)
- Access to early learning and child care
- Child, student and adult skills
- Post-secondary attainment
- Future outlook
Under the subdomain of Economic Security and Deprivation, the indicators are:
- Acceptable housing (headline)
- Poverty (headline)
- Protection from income shocks
- Financial well-being
- Homelessness
- Food security
Source: Department of Finance Canada. April 2021. Measuring What Matters: Toward a Quality of Life Strategy for Canada.
References
Bank of Canada. May 2021. Financial System Review Summary—2021.
Barnhart, Brennan, Kimberley Beck, Wesley Benjamin, Chris Birrell, Samir Djidel, Andrew Heisz, and Eric Olson. March 23, 2021. Statistics Canada. Experimental estimates of family weekly income, update.
Barnhart, Brennan, Kimberley Beck, Wesley Benjamin, Chris Birrell, Samir Djidel, Andrew Heisz, and Eric Olson. July 28, 2021. Statistics Canada. Experimental estimates of family weekly income, January 2020 to March 2021.
Charnock, Sarah, Andrew Heisz, Jennifer Kaddatz, Russ Mann, and Nora Spinks. April 15, 2021. Statistics Canada. Canadians’ Well-being in Year One of the COVID-19 Pandemic.
Cherry, Libby. July 07, 2021. Bloomberg. Covid-19 Pushed 22 Million Out of Job Market in Major Economies.
Department of Finance Canada. April 2021. Measuring What Matters: Toward a Quality of Life Strategy for Canada.
Financial Consumer Agency of Canada. May 29, 2020. Canadians and their Money: Key Findings from the 2019 Canadian Financial Capability Survey.
Financial Consumer Agency of Canada. June 09, 2021. Summary of findings COVID-19 surveys: Financial impact of the pandemic on Canadians.
Government of Canada. January 01, 2020. What every older Canadian should know about: Income and benefits from government programs.
Government of Canada. July 08, 2021. Programs and services for seniors.
Government of Canada. July 13, 2021. COVID-19 daily epidemiology update.
Seymour Consulting. 2021. Seymour Financial Resilience Index.
Statistics Canada. October 20, 2020. COVID-19 in Canada: A Six-month Update on Social and Economic Impacts.
Statistics Canada. May 21, 2021. The Daily: A labour market snapshot of South Asian, Chinese and Filipino Canadians during the pandemic.
- Date modified: