
Analytical Studies Branch Research Paper Series
Moving Forward on Well-being (Quality of Life) Measures in Canada
Skip to text
Text begins
Abstract
There is continued and growing awareness of the need to integrate information on economic, social and environmental conditions to better measure the well-being or quality of life and progress of nations, a need to move ‘Beyond GDP.’ Many countries are moving beyond just the measurement and monitoring of indicators to a more fulsome integration of quality of life into the policy process. The Government of Canada is moving in a similar direction. This provides Statistics Canada with an opportunity to take stock and review the status of well-being measurement in Canada. The overall objective of this paper is to provide an overview of selected approaches to measuring and reporting well-being in Canada and internationally, and to identify opportunities to move forward with new and enhanced measures to address current social, economic and environmental issues facing Canada that may impact the well-being of its population. This report highlights six trends and proposes a range of data development and measurement activities to advance well-being measurement in the following key areas: digitization, affordability and economic uncertainty, the quality of jobs, social cohesion, neighbourhoods and the built environment and climate change.
Start of text box
Note to Readers:
This report was prepared prior to the onset of the COVID-19 pandemic, which has had and continues to have unprecedented health, social, and economic impacts on the quality of the lives of Canadians. This has only served to further amplify the importance of moving forward with the further development of a comprehensive quality of life framework that integrates social, economic and environmental measures to guide and monitor progress related to the pandemic recovery. The deliberations and recommendations in this report remain, if not are more, relevant given the new context and reality Canadians are facing.
End of text box
Executive summary
There is continued and growing awareness of the need to integrate information on economic, social and environmental conditions to better measure the well-being and progress of nations, a need to move ‘Beyond GDP’ to account for social and environmental outcomes in addition to standard economic measures. The proliferation of well-being measures have moved leaders in some countries to go beyond just the measurement and monitoring of these indicators to a more fulsome integration of well-being into the policy process. The Government of Canada is moving in a similar direction. This provides Statistics Canada with an opportunity to take stock and review the status of well-being measurement in Canada. As the country’s national statistical organization responsible for many of the indicators used in current well-being frameworks, Statistics Canada is well positioned to conduct such a stock-take and identify opportunities to strengthen the statistical system with respect to quality of life measurement to support the federal government plans moving forward. The overall objective of this paper is to provide an overview of selected approaches to measuring and reporting well-being in Canada and internationally, and to identify opportunities to move forward with new and enhanced measures to address current social, economic and environmental issues facing Canada that may impact the well-being of its population.
The review of well-being frameworks focusses on three well-being multi-dimensional frameworks national in scope and to which Statistics Canada is a major contributor of data for the indicators—the Canadian Index of Well-being (University of Waterloo), the Better Life Initiative (Organisation for Economic Co-operation and Development), and Sustainable Development Goals (United Nations). While each framework has been developed independently to meet different needs and goals, there is a clear convergence of domains into four key areas: society, economy, environment and institutions. Common domains include health, living standards, jobs and employment, education, time use, and community vitality. Other approaches to well-being measurement include the subjective approach which advocates an umbrella measure of quality of life (e.g., life satisfaction) and efforts to integrate well-being measures in the System of National Accounts.
Internationally, countries are moving beyond the simple reporting of well-being measures toward the integration of this concept in the policy process. Those countries who moved forward with this approach have developed largely multi-dimensional indicator based well-being frameworks that have been led by key government departments (e.g., Finance or Treasury), created through consultations, and leveraged measurement expertise from their respective national statistical organizations. In many cases, governments have used a range of legislative and policy mechanisms to support the use of well-being frameworks in the policy process, including mandatory reporting of well-being indicators.
In 2019, the Minister of Innovation, Science and Industry, as the Minister responsible for Statistics Canada, was tasked with supporting the Minister of Middle Class Prosperity and Associate Minister of Finance to better incorporating quality of life measurements into decision-making and budgeting. This represents a unique opportunity to take a critical look at the current state of well-being measurement in Canada. The results of this paper point to opportunities to advance a new government-led framework that both builds on existing well-being measures and advances new measures to address gaps related to the current social, economic and environmental trends impacting the lives of Canadians. This report highlights six trends and proposes a range of data development and measurement activities to advance well-being measurement in the following key areas: digitization, affordability and economic uncertainty, the quality of jobs, social cohesion, neighbourhoods and the built environment, and climate change.
1 Introduction
There is continued and growing awareness of the need to integrate information on economic, social and environmental conditions to better measure the well-being and progress of nations. High-profile reports since the last recession have coalesced around the notion that the measurements of economies have not sufficiently reflected the experiences of citizens nor captured the true costs of production (Stiglitz, Sen and Fitoussi 2009). They argue that the focus on aggregate economic outcomes is misplaced when growth is not inclusive or when environmental degradation and negative social outcomes are not fully accounted for. In this context, there is increased focus among governments at all levels to look at the economy, civil society and environment in an integrated manner that goes ‘Beyond GDP.’
At the United Nations (UN), this effort is reflected in the 2030 Agenda of leaving no one behind and the development of Sustainable Development Goals (SDGs).Note At the Organisation for Economic Co-operation and Development (OECD) and in several member countries, new models that make better use of well-being indicators are being used to measure, track and analyze well-being and sustainability. Canada, too, is moving in this direction. Canada’s statistical infrastructure continues to evolve in response to the many changes in its economy, society and environment, and federal departments are implementing new indicator frameworks to guide, monitor and evaluate policies and programs. Work is also on-going at the provincial and municipal levels and within academia and non-governmental organizations.
In late 2019, the new Minister of Middle Class Prosperity was tasked:
…to better incorporate quality of life measurements into government decision-making and budgeting, drawing on lessons from other jurisdictions such as New Zealand and Scotland. (Justin Trudeau, Prime Minister of Canada 2019)
This increases both the importance of, and demands upon, statistical measures of quality of life, alternatively titled well-being, as the government seeks to embed this concept more deeply in the policy process.
The understanding and definition of well-being is thus central within this context. Various approaches to well-being are evident in the research literature and international policy community. The overall objective of this paper is to provide an overview of selected approaches to measuring and reporting on well-being and identify opportunities to move forward with new and enhanced measures to address current social, economic and environmental issues facing Canada that may impact the well-being of its population.
The paper is divided into six sections. Sections 2 to 4 provide an overview of three approaches to measuring well-being, including well-being indicator frameworks, the subjective well-being approach, and briefly, the System of National Accounts (SNA). Emphasis is on the first two approaches as they are most germane to the mandated task above. Section 2 focuses more specifically on three well-being indicator frameworks which are multi-dimensional and national in scope and to which Statistics Canada is a major contributor of indicators—the Canadian Index of Well-being (University of Waterloo), the Better Life Initiative (OECD), and Sustainable Development Goals (UN). This section also includes insights regarding how the concept of well-being and related indicators are being more closely integrated in the policy process.
Section 5 draws attention to economic, social and environmental issues that have potential impacts for the well-being of citizens including digitization, job quality, affordability and economic uncertainty, the role of neighbourhoods and built environment and climate change. These issues are raised and discussed in the context of implications for well-being being measurement, highlighting the work Statistics Canada is doing to advance well-being measures as well as identify remaining gaps. While there are a broad range of indicators currently used to monitor and track the well-being of Canadians, there are opportunities to further develop new and timely measures to address these key issues which are also the focus of policy makers.
Finally, Section 6 draws the main elements of Statistics Canada’s strategy for engaging in, and supporting the Government of Canada’s objective of incorporating well-being within the policy process and advancing measurement in key areas.
2 Well-being indicator frameworks
Well-being indicator frameworks are being developed and used for policy purposes in a growing number of countries. Such frameworks typically comprised various aspects, or domains, identified as important contributors to, or elements of, well-being. Multi-dimensional frameworks typically include domains such as health, education, work, material conditions, social ties, and environment, with a set of indicators presented within each. Differences in indicator scores can be tracked over time or compared between groups to gauge improvements or deteriorations in conditions. Indicators are sometimes combined into an aggregated well-being index or set of well-being indices. The well-being indicator field itself has a fifty-year history, as discussed in a recent edition of Social Indicators Research (volume no. 135) (Land and Michalos 2018).
Over the last decade or so, the application of well-being indicator frameworks have become more prominent in public policy discussions. The United Kingdom (U.K.) was one of the first countries to measure well-being with the implementation of their Measuring Well-being Program in 2010 (Everett 2015), with a Measures of National Well-being Dashboard (United Kingdom. Office of National Statistics 2019) published by the Office of National Statistics. France and Wales introduced statutory requirements to report to Parliament regularly on the state of national well-being to inform policy development. In New Zealand, the Living Standards Framework (LSF) was developed by the New Zealand Treasury (Smith 2018). The LSF Dashboard, first released in 2018, informs the New Zealand Treasury’s advice to Ministers on priorities for improving wellbeing (Government of New Zealand. The Tresury n.d.). This initiative led to the first well-being budget, which prioritizes a range of initiatives in the areas of mental health, vulnerable populations, and an environmentally sustainable economy. The outcomes of their budget will be measured using their Treasury’s LFS (Government of New Zealand 2019).
Initiatives in other countries are profiled in Exton and Shinwell (2018). Further information regarding international frameworks is available upon request.
2.1 Selected well-being indicator frameworks
In recent years, as the recognition of the importance of well-being has been emphasized throughout the world, a multitude of well-being frameworks have been developed both in Canada and beyond (appendices A, B and C provide an overview of some of these). Many of these frameworks focus on individual-level well-being, while others focus on families, children and youth, or communities. A comprehensive review of these frameworks is useful, if not essential, in understanding well-being from various perspectives and within different societal contexts.
For the purposes of this paper, three specific well-being indicator frameworks, to which Statistics Canada is a primary contributor of data and/or indicators, are considered in detail.
2.1.1 Canadian Index of Well-being
The Canadian Index of Well-being (CIW) began in the early 2000s under the auspices of the Atkinson Charitable Foundation and is designed to measure the economic, health, social and environmental well-being of Canadians. The initiative commenced with three rounds of public consultations and with input from researchers, indicator users, and various agencies and organizations. This culminated in the identification of a set of core values underpinning well-being (i.e., fairness, diversity, equity, inclusion, health, safety, economic security, democracy and sustainability) and a set of 8 domains of life that contribute to, and affect, the well-being of Canadians (CIW 2019; Smale 2019; Michalos et al. 2011). These domains include community vitality, democratic engagement, education, environment, healthy populations, leisure and culture, living standards, and time use (see Figure 1). Each domain is populated with 8 indicators. The overall CIW framework thus includes 64 indicators, 8 sub-indices and the aggregate CIW itself. Each of the 8 indicators in each domain is assigned equal weight in the construction of the domain index, and each of the 8 domain sub-indices are assigned equal weight in the construction of the CIW overall.
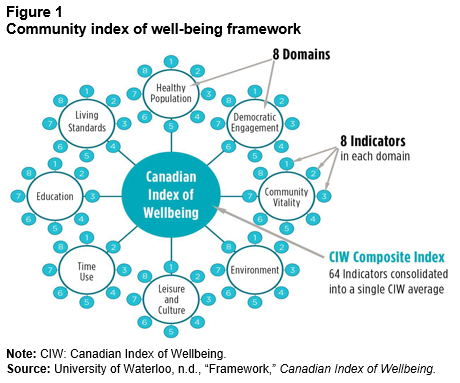
Description for Figure 1
The title of Figure 1 is “Community index of well-being framework.”
The figure consist of a large oval surrounded by medium-sized ovals. The medium-sized ovals have the same size. Each medium-sized oval is connected to the large one with a straight line. Around each medium-sized oval are eight small ovals. The small ovals are of the same size. They are connected to the medium-sized ovals with a straight line. The background colour of the large and small ovals as well as the frame around the medium-sized ovals is the same colour (blue). The medium-sized ovals have a white background.
The text in the large oval is “Canadian Index of Wellbeing.” It is white. The tip of a grey arrow is touching the large oval. The text at the beginning of the grey arrow, which is situated outside the diagram, in the lower-right area of the image, is “CIW Composite Index, 64 indicators consolidated into a single CIW average.” (CIW is the abbreviation for “Canadian Index of Wellbeing.”)
The text in each one of the medium-sized ovals is different. It is as follows, starting from the upper-portion of the diagram: “Healthy Population,” “Democratic Engagement,” “Community Vitality,” “Environment,” “Leisure and Culture,” “Time Use,” “Education,” and “Living Standards.” The small ovals around each medium-sized oval are numbered from 1 to 8. The numbers are white in colour.
The tip of one grey arrow touches the medium-sized oval “Healthy Population” and the tip of another touches the medium-sized oval “Demographic Engagement.” The beginning of each of these two grey arrows converges to the text “8 Domains” written in black. This text is located outside the diagram in the top right area of the image.
The tip of one grey arrow touches the small oval “1” attached to the “Community Vitality” medium-sized oval, the tip of another grey arrow touches the small oval “2,” and the tip of another grey arrow touches the small oval “3” attached to the same medium-sized oval. The beginning of each of these three arrows converge to the text “8 Indicators in each domain” written in black. This text is located outside the diagram in the upper right portion of the image.
This diagram conveys the following message: The medium-sized ovals with their respective labels (Healthy Population, Democratic Engagement, Community Vitality, Environment, Leisure and Culture, Time Use, Education, Living Standards) represent the eight domains of life that contribute to, and affect, the well-being of Canadians. Each domain has an index and is populated with eight indicators represented by the eight small ovals numbered 1 to 8. Each of the eight indicators in each domain is assigned equal weight in the construction of the domain index, and each of the domain sub-indices are assigned equal weight in the construction of the Canadian Index of Wellbeing. The overall Canadian Index of Wellbeing includes 64 indicators.
The note and source of Figure 1 read as follows:
Note: CIW: Canadian Index of Wellbeing.
Source: University of Waterloo, n.d., “Framework,” Canadian Index of Wellbeing.
The CIW draws on a wide range of data sources, although information from Statistics Canada is used most extensively (e.g., General Social Survey [GSS], Canadian Community Health Survey, Labour Force Survey, Census of Population). Indicators are available at different frequencies, from annually to every five years.
The most recent annual report of the CIW was published in 2016, providing results up to 2014. In addition to national-level results for Canada, the CIW provides provincial-level information for Ontario, Nova Scotia, and Saskatchewan. The CIW experience in local communities across Canada is noteworthy. The CIW developed its Community Well-being Survey, with the questionnaire designed to collect information in each of the eight domains applying many of the questions available on Statistics Canada surveys such as the GSS. Between 2012 and 2020, the survey was fielded in 11 locations across Canada, as the CIW responded to local needs and worked in close collaboration with local stakeholders.Note A collaborative initiative involving the CIW and Engage Nova Scotia, a non-profit organization, is currently underway. Survey responses have been collected from almost 13,000 individuals residing in 10 regions of the province using a non-probabilistic sampling technique.
In 2010, the CIW was moved from the Atkinson Foundation to the University of Waterloo, Faculty of Applied Health Science, where it has been headquartered since. Discussions are currently underway to move the initiative to a new institution.
2.1.2 Organisation for Economic Co-operation and Development—Better Life Initiative (How’s Life?)
The OECD’s Better Life Initiative to measure well-being and progress (OECD n.d.) was launched in May 2011 in response to the recommendations in the 2009 report of the Commission on the Measurement of Economic Performance and Social Progress (Stiglitz, Sen and Fitoussi 2009). The Better Life initiative is composed of three components—building the evidence base (i.e., Framework, How’s Life?), building better measures and stimulating debate—and is designed to support the OECD’s mandate of “better policies for better lives.” The OECD Well-being framework builds on national and international initiatives, the academic literature, the recommendations of Stiglitz, Sen and Fitoussi (2009), and input from National Statistical Offices (NSOs) represented on the OECD Committee on Statistics and Statistical Policy.
The How’s Life? framework identifies three pillars for understanding and measuring well-being—quality of life, material conditions and sustainability. These pillars are supported by 11 dimensions of current well-being and 4 sources of capital supporting future well-being. The 11 dimensions of current well-being include 8 reflecting quality of life (health status, work-life balance, knowledge and skills, social connections, civic engagement and governance, environmental quality, personal security, and subjective well-being) and three reflecting material conditions (income and wealth, jobs and earning, and housing). In addition to tracking progress over time, the Better life data are used to measure and monitor inequalities across a range of dimensions, such as education, age, income, gender, and migrant status (OECD 2017).
The How’s Life? report is published every two years and provides information on well-being across approximately 40 countries. The results are targeted to a broad audience using a range of dissemination products, such as regional and country-specific reports, downloadable data, and an online platform (OECD Better Life Index n.d.) that enables individuals to construct a customized well-being index using the values (or weights) that they themselves attach to each of the 11 well-being dimensions.
How’s Life? is supported by data from national statistical organizations, the United Nations, the OECD itself, and the Gallup World Poll. Statistics Canada is a major contributor of data for Canada. The OECD plans to expand the How’s Life? initiative to more countries, improve well-being indicators in domains in which measurement is currently weak, and adapting existing indicators to changing circumstances.
In the most recent edition, How’s Life? 2020, the OECD Statistics and Data Directorate charts whether life is getting better for people in 37 OECD countries and 4 partner countries (OECDiLibrary 2020). This fifth edition presents the latest evidence from an updated set of over 80 indicators, covering current well-being outcomes, inequalities, and resources for future well-being. Since 2010, people’s well-being has improved in many respects, but progress has been slow or deteriorated in others, including how people connect with each other and their government. Large gaps by gender, age and education persist across most well-being outcomes. Generally, OECD countries that do better on average also feature greater equality between population groups and fewer people living in deprivation. Many OECD countries with poorer well-being in 2010 have since experienced the greatest gains. However, advances in current well-being have not always been matched by improvements in the resources that sustain well-being over time, with warning signs emerging across natural, human, economic and social capital. Beyond an overall analysis of well-being trends since 2010, this report explores in detail the 15 dimensions of the OECD Better Life Initiative, including health, subjective well-being, social connections, natural capital, and more, and looks at each country’s performance in dedicated country profiles.

Description for Figure 2
The title of Figure 2 is “The Well-being Framework of the Organisation for Economic Co-operation and Development”
The figure consists of a square divided in two parts horizontally. The title of each part is written in white on a grey background. The title of the upper part is “Current Well-being.” The title of the lower part is “Resources for Future Well-being.”
In the “Current Well-being” part, there are two sections. The section at the left has the following title: “Key dimensions.” The title is written in grey on a white background. It is surrounded by a square grey frame. Under this title, 11 dimensions are listed in two columns (six dimensions in the left column and five in the right column. The dimensions appear together with their respective icons. The icons are circles of different colours that appear at the left of the dimensions. Each of the circles contains an image. The dimensions and their respective images are as follows: “Income and Wealth” (stack of dollars); “Work and Job Quality” (briefcase; “Housing” (house); “Health” (cross); “Knowledge and Skills” (book); “Environment Quality” (fir tree); “Subjective Well-being (heart)”; “Safety” (person running); “Work-life Balance” (scale); “Social Connections” (three persons); and “Civil Engagement” (crossed-out square).
At the right side of the list of dimensions and their respective icons is a grey vertical line bent with a point at the center in the direction of the section at the right.
The section at the right has the following title: “How we measure them.” The title is written in grey on a white background. It is surrounded by a square grey frame. In this section there are four rectangles of the same size. The rectangles are grey. Each rectangle contains an image and has a title under it. The images are white. The titles are black.
The upper-left image is bull’s eye with an arrow pointing to its centre. Its title is “Averages.”
The upper-right image contains three symbols. The symbols for a man and a woman that are superposed and contain the “equal” symbol in their centre. This symbol is located at the upper-left corner. The symbol for a diploma. This symbol is located at the upper-right corner. Three persons of decreasing size: the one at the left is large, the one in the center is medium-sized and the one at the right is small. This symbol is located at the bottom and center of the image. The title of the upper-right image is “Inequalities between groups.”
The lower-left image contains a staircase with one person standing on the bottom stair and another person standing on the top stair. Its title is “Inequalities between top and bottom performers.”
The lower-right image contains a person that is sitting, head hanging down and arms resting on thighs. Its title is “Deprivations.”
In the “Resources for Future Well-being part of the image, there are also two sections. The section at the left is named “Key dimensions.” The title is written in grey on a white background. It is surrounded by a square grey frame. Under this title, four dimensions are listed in two columns (two dimensions in the left column and two in the right column. The dimensions appear together with their respective icons. The icons are black circles. They appear at the left of the dimensions. Each of the circles contains a white image. The dimensions and their respective images are as follows: “Natural Capital” (tree, bird and land); “Economic Capital” (bridge); Human Capital (silhouette of a human head seen sideways with three lights in the brain area); “Social Capital” (handshake).
At the right side of the list of dimensions and their respective icons is a grey vertical line bent with a point at the center in the direction of the section at the right.
The section at the right has the following title: “How we measure them.” The title is written in grey on a white background. It is surrounded by a square grey frame. In this section there are four rectangles of the same size. The rectangles are grey. Each rectangle contains an image and has a title beside it. The images are white. The titles of the images are black.
In the upper-left image there are two piles of coins. The image title is “Stocks.” In the upper right image are six arrows, the three top ones point to the right and the three bottom ones point to the left. The image title is “Flows.”
In the lower-left image is a triangle with a grey-coloured exclamation mark in its centre. The title of the image is “Risk factors.”
In the lower-right image is the representation, of a muscled human arm with elbow bent. The title of the image is “Resilience.”
The source of the image is as follows:
Source: OECD i Library, 2020, How’s Life? 2020: Measuring Well-being.
2.1.3 Sustainable Development Goals
The 2030 Agenda for Sustainable Development (UNDESA. Sustainable Development n.d.) represents a shared vision for partnership, peace and prosperity and a commitment to leave no one behind. The Agenda is supported by 17 Social Development Goals (SDGs) (United Nations. Sustainable Development Goals n.d.a), 169 targets (The Global Goals for Sustainable Development 2018) and more than 232 indicators (United Nations. Sustainable Development Goals. n.d.b) (Figure 3). These address the three equally important pillars of sustainable development—the economy, the society and the environment. The SDGs also cover five key elements, also known as the 5 Ps: people, prosperity, planet, peace, and partnership.
The initiative draws on the success of the Millennium Development Goals (MDGs) (World Health Organization 2018), a series of 8 goals that UN Member States had agreed to try to achieve between the year 2000 and 2015. The MDG targets included halving extreme poverty rates, halting the spread of HIV/AIDS and providing universal primary education (United Nations 2015). In contrast to the SDGs, which target all countries, the MDGs were mainly aimed at developing countries, with the support of developed countries and international organisations.
The SDGs also adopted three important principles:
- Interlinkages: Goals and indicators are interlinked and can have impacts, positive or negative, on each other.
- Leave no one behind: The idea that nobody should be left behind, and that a country will be as successful as the least successful of its people. This element points to the importance of data disaggregation, to ensure the whole spectrum of different realities is represented.
- Reporting: Reporting is central to the achievement of the SDGs. Results and progress should be tracked as often as possible and reported in a neutral and impartial way.
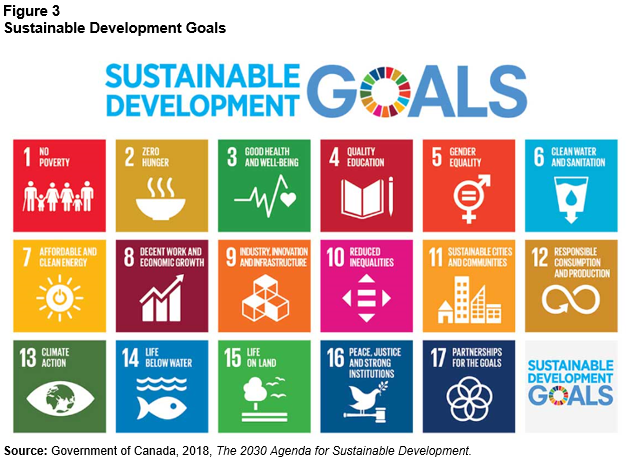
Description for Figure 3
The title of Figure 3 is “Sustainable Development Goals.”
The figure consists of 18 squares of equal size and dimensions. They are arranged in three rows of six squares each. The bottom right square is not numbered. The other squares are numbered from 1 to 17. They are have a different background colour. In each square, except the unnumbered bottom right one, the goal numbers appear at the top left corner, with a goal name to the right of them. Below the goal number and name is the symbol for the goal. The number, goal name and symbol are mostly white.
Centered above the 18 squares is written the title “Sustainable Development Goals” in large print on a white background. The colour of “Sustainable Development” is in a lighter shade of blue than the colour of “Goals,” except for the letter “o” in “Goals”: it is composed of 17 sections of different colours. These colours are the same as the background colours of the squares representing the goals. The word “Goals” is in larger print than the words “Sustainable Development.”
In the unnumbered bottom-right square “Sustainable Development Goals” also appears in the same 17 colours as those of the text centered above the 18 squares, but in a smaller font. It appears in a square of the same dimensions as the 17 other squares. Its background is light grey.
The number, goal name and symbol for each of the 17 goals are as follows, from left to right and top to bottom: 1, No Poverty (6 persons of different gender and ages, the three at the left holding hands); 2, Zero Hunger (bowl of hot food); 3, Good Healh and Well Being (graphical representation of a heart beat with a heart shape at the right end of it); Quality Education (copybook and pencil); 5, Gender Equality (superposed symbols for men and women with an equal symbol in the middle); 6, Clean Water and Sanitation (glass delineated in black, full of water in white colour with a blue water drop in the middle; the bottom of the glass takes the shape of the tip of an arrow); 7, Affordable and Clean Energy (white symbol of a sun with rays, in its centre is the power symbol found on the button of some technological devices; the power symbol is the same colour as the background); 8, Decent Work and Economic Growth (three bars of a bar chart with an arrow going in an upwards direction placed on top of them); 9, Industry Innovation and Infrastructure (four blocks stacked to form a corner; three blocks have one white face, the other faces delineated in white look transparent); 10, Reduced Inequalities (equal sign surrounded with four arrow heads [one on top, one at the bottom, one at the right, and one at the left]; the arrow heads point to the opposite side of the symbol and form the four corners of a square); 11 Sustainable Cities and Communities (faces of four buildings of equal width but of various heights and shapes); 12, Responsible Consumption and Production (curved line in the shape of the number 8 in a horizontal position, one of the ends of the line is in the shape of an arrow head); 13, Climate Action (white oval shape with the representation of the earth in the centre; the continents are green and the water is white; the overall shape resembles an open eye); 14, Life Below Water (two horizontal curved lines representing water and a white fish seen sideways under the curved lines); 15, Life on Land (a tree on the left, three birds in flight on the right, and two straight horizontal lines below them representing the surface of the land); 16, Peace, Justice and Strong Institutions (a white bird seen from the side and carrying a small tree branch with leaves in its beak; the bird is standing on a judge’s hammer); 17, Partnerships for the Goals (five circles delineated in white, partially overlapping on each side; the overlapped portions form the shape of a flower with five petals).
The source for Figure 3 is as follows:
Source: Government of Canada, 2018, The 2030 Agenda for Sustainable Development.
While there are similarities between the UN SDGs and the OECD’s How’s Life? (e.g., multi-dimensionality, similar domains), it has been noted that “the OECD well-being framework is an analytic and diagnostic tool to assess the conditions of a community, whereas the 2030 Agenda is a list of policy commitments agreed by world leaders.” (OECD 2019, p. 4).
In 2015, Canada pledged commitment to the SDGs and work began on the development of a national strategy led by the Department of Employment and Social Development Canada (ESDC), supported by Statistics Canada, on behalf of the Government of Canada. The approach is one of developing a whole-of-Canada national strategy for the 2030 Agenda built on numerous engagements with a range of stakeholders including federal, provincial and municipal governments, Indigenous peoples, the private sector, civil society and Canadians at large. The development of the strategy was informed by a national consultation conducted between March 15, 2019, and May 15, 2019, with a range of stakeholders using multiple platforms and approaches. The results formed the basis of recommendations for Canada’s 2030 Agenda and proposed actions in the areas of leadership, governance and policy coherence; awareness, engagement and partnerships; accountability, transparency and reporting; Reconciliation and the 2030 Agenda and investing in SDGs (Government of Canada 2019a).
In an effort to advance the strategy, recommendations were made to further embed the SDGs in the federal government policy process as part of 30 Actions to 2030 (Government of Canada 2019a, Annex I – 30 actions to 2030). This includes recommendations pertaining to leadership, links to policy, and a new Canadian Indicator Framework.
2.1.4 Mapping well-being frameworks
In order to evaluate the relative relevance of different well-being frameworks to the current Canadian experience, and to ensure that no domains of importance are overlooked when developing a new framework for Canada, it us useful to undertake a comparative mapping of existing frameworks.
While each of the three frameworks considered in this paper has been developed independently to meet different needs and goals, a comparative review of the specific domains and indicators identifies numerous areas of convergence (Table 1). Overall, the three frameworks can be summarized as identifying domains of well-being in four key areas: society, economy, environment and institutions. Within each domain, the frameworks share similar areas of focus such as health, basic living standards, education and community as well as similar indicators (see Appendix A for a more detailed summary). This demonstrates the solid base which can be leveraged to move forward with a quality of life framework in Canada as well as identify potential gaps to meet emerging social, economic and environmental concerns moving forward.
| Key areas | Areas of focus | Canadian Index of Well-being | SDGs, Canadian Indicator Framework | OECD Better Life |
|---|---|---|---|---|
| Society | Individuals | Healthy Population | SDG 3 Good health and well-being | Health status |
| Individuals | Living Standards | SDG 1 No Poverty SDG 2 Zero Hunger SDG 8 Decent Work and Economic Growth |
Jobs and Earnings Housing Subjective Well-being (life satisfaction) |
|
| Individuals | Education | SDG 4 Quality Education | Education and Skills Human CapitalTable 1 Note 1 |
|
| Individuals | Time Use | not applicable | Work-life Balance | |
| Individuals | Leisure and Culture | not applicable | not applicable | |
| Equality Across Groups | not applicable | SDG 5 Gender Equality SDG 10 Reduced Inequalities |
not applicable | |
| Communities | Community Vitality | SDG 11 Sustainable Cities and Communities | Social CapitalTable 1 Note 1 Personal Security Social Connections |
|
| Economy | not applicable | not applicable | SDG 9 Industry Innovation and Infrastructure | Economic CapitalTable 1 Note 1 |
| not applicable | Environment | SDG 6 Clean Water and Sanitation SDG 7 Affordable and Clean Energy |
Environmental Quality Natural CapitalTable 1 Note 1 |
|
| Environment | not applicable | not applicable | SDG 12 Sustainable Consumption and Production SDG 13 Climate Action SDG 14 Life Below Water SDG 15 Life on Land |
not applicable |
| Institutions | not applicable | Democratic Engagement | SDG 16 Peace, Justice and Strong Institutions | Civic Engagement and Governance |
|
||||
2.2 Well-being indicator frameworks and the policy process—international experiences
Well-being frameworks are beneficial for use in a public policy setting because they can provide the “potential for prevention rather than crisis-driven policy.” (Wollny, Apps and Henricson 2020). The degree to which well-being indicator frameworks are currently integrated within the policy process, however, can be viewed along a continuum.
At one end are indicator frameworks that have no formal connection with policy processes, but are offered instead as public information. Barrington-Leigh and Escande (2018) note the challenges of visibility and longevity that such initiatives have faced. And while the OECD notes that indicator initiatives provided for public information may shift opinion and inform public and policy debate, it goes on to note that “it is necessary to go beyond simply making indicators available to wide audiences” and look further to their role in policy (Exton and Shinwell 2018, p. 19). Whitby et al. (2014) distinguish between parallel and integrated approaches to policy in the context of ‘Beyond GDP’, arguing that “…it is important to emphasise that ‘balanced’ [policy making] does not just mean the adoption of social and environmental goals in parallel with economic goals (experience tells us that economic objectives tend to trump other ones) but rather a more integrated approach to economic and other policy making” (p. 12).
In 2018, the OECD released a study highlighting the progress made by several countries towards the development and regular reporting of well-being indicators, and identifying the mechanisms used to entrench them in the policy process. The study was based on a review of 15 countries and detailed case studies on their use in policy making in seven. These included Ecuador, France, Italy, New Zealand, Scotland, Sweden, and the United Kingdom (Exton and Shinwell 2018). Among those countries engaged in the development of well-being frameworks and indicators, the following observations were noted:
- Most frameworks were developed in the last decade, with the exception of some countries including the Netherlands whose Life Situation Index which dates back to 1974;
- All the frameworks have adopted a multi-dimensional approach with indicators reflecting a range of economic and material well-being and overall quality of life supported by both objective and subjective measures including measures of subjective well-being (i.e., satisfaction with life);
- Consultation with a broad range of stakeholders were held with varying levels of intensity to inform the development of the measurement framework;
- Government leadership at the national level was key in all cases but varied with some using Centre of Government offices (i.e., Prime Minister’s office Israel, Sweden and Finland; Federal Chancellery in Germany) or ministries responsible for finance and or planning (e.g., Italy, France, Ecuador, New Zealand) with a clear intent of integrating the frameworks in the policy process;
- In the majority of cases, the National Statistical Office (NSO) played a key role as either the lead or co-lead agency for the development of the well-being measurement framework.
The study, now two years old in a rapidly changing world, found that countries varied in the extent to which well-being metrics are incorporated in the policy process. Among countries engaged in well-being indicator measurement, some used well-being metrics in a single stage of the policy process, such as priority/agenda setting (the Netherlands) or policy formulation (New Zealand), while others include well-being metrics in multiple stages of the process (Ecuador, France, Italy, Scotland, Sweden, United Kingdom, and United Arab Emirates).
Exton and Shinwell (2018) also report that governments have used a range of legislative and policy mechanisms to support the use of well-being frameworks. Mandatory reporting of well-being indicators at the outset of budgeting or policy processes is one example (the Netherlands), while legislative requirements for the monitoring and reporting of selected indicators is another (France, Italy, and Ecuador). Lastly, the OECD also notes that government leadership at the national level, with a clear intent of integrating well-being frameworks in the policy process, was a key element in well-being framework initiatives implemented over the past decade.
In an earlier review based on case studies in seven countries, Whitby et al. (2014) highlight a range of challenges facing the integration of well-being frameworks within the policy process, grouping these into three categories:
- Political barriers: The effectiveness of alternative well-being frameworks in the policy process may be limited if well-being indicators are not publicly accepted or endorsed as desired outcomes, resulting in a lack of democratic legitimacy. Exton and Shinwell (2018) note that countries implementing well-being frameworks over the past decade engaged in public consultation “…with varying levels of intensity, scale and goals.” (p. 9). Public consultation was also a critical element in the development of the CIW. Whitby et al. (2018) also identify “lack of [a] strong narrative that engages the public” and “lack of a clear political imperative” as two other potential political barriers to the use of alternative well-being frameworks in the policy process.
- Indicator barriers: Conceptual and methodological challenges regarding the measurement of well-being may pose a challenge to well-being frameworks. The frequency of data collection and timeliness of indicators are two challenges. Data collected on a five-year cycle or indicators that are two or three years out of data are likely to be inadequate for policy decision-making. The construction of composite indices, and the weights that are applied to each of the constituent elements, is another persistent challenge.
- Process and structural barriers: Integrating alternative well-being frameworks into the policy process may pose, what Whitby et al. call ‘process’ challenges. Alternative well-being frameworks are, by design, multi-dimensional and their use in policy processes requires an approach that cuts across government departments, policy areas, and disciplinary boundaries. The multi-dimensionality of alternative well-being frameworks also necessitates the use of a range of methodological approaches and analytical techniques. Whitby et al. (2014) report:
We found persistent perceptions among mainstream policy actors that if alternative indicators are to succeed their methodologies must be consistent with the current economic model and be directly linkable to existing economic instruments and tools (e.g., cost-benefit analysis, resource efficiency)” (p. 15)
In an effort to promote the sharing of experiences and expertise among officials working to embed wellbeing outcomes in economic policy, the governments of Scotland, Iceland and New Zealand formally launched the Wellbeing Economy Governments (WEG) initiative in 2018. WEG Members attended the October 2019 OECD Workshop, Putting Well-being Metrics into Policy Action (OECD 2019), aimed at exploring the policy uptake of well-being, inclusiveness and sustainability indicators, focussing on the types of evidence and analysis that policy makers need, and how practical policy mechanisms could be adapted to apply this evidence on a more systematic basis.
2.3 Well-being indicator frameworks and the policy process—Canadian experiences
While Canada currently does not have a well-being framework integrated in the policy process at the federal level, it is important to draw attention to the range of existing initiatives to integrate aspects of well-being in selected policy areas. There are several national level frameworks developed to support federal policies related to the well-being of specific populations (see appendices B and C). A few of these include the Community Well-being Index for Indigenous peoples (Crown-Indigenous Relations and Northern Affairs Canada and Indigenous Services Canada and other Agencies), the Canadian Index for Measuring Integration (2020) which examines four dimensions of immigrant integration to assess the gaps between immigrants and the Canadian-born population (The Canadian Institute for Identities and Migration, the Association of Canadian Studies and Immigration, Refugees and Citizenship Canada), the Gender Results Framework (Women and Gender Equality), and the Veterans’ Well-being Act (Veterans Affairs Canada and Department of National Defence and Canadian Forces). With the support of Employment and Social Development Canada and Social Development Partnerships funding, the Vanier Institute of the Family has been developing a Family Well-being Index and associated indicators in consultation with project advisors (Vanier Institute of the Family 2020a). These frameworks vary in their dimensions and indicators as they are designed to highlight issues and metrics of particular relevance to specific populations.
There are also numerous federal policies that touch on specific dimensions of well-being. For example, the Public Health Agency of Canada, in collaboration with national and provincial organizations including Statistics Canada, released indicators on health inequalities across socio-economic groups as part of the Health Inequalities Reporting Initiative. The intersectionality of well-being in the domains across health, income and employment is highlighted. Similarly, Canadian Heritage is leading Canada’s anti-racism strategy—Building a Foundation for Change: Canada’s Anti-Racism Strategy 2019–2022. The objective is to find ways to counter racism in its various forms, with a strong focus on community-based projects. The strategy is guided by a vision of Canada where all Canadians benefit from equitable access to and participation in the economic, cultural, social and political spheres. Brief summaries of selected well-being frameworks and polices in Canada are provided in Appendix B.
Nonetheless, the large number of indicator initiatives fielded by federal, provincial and regional governments, non-governmental organizations, academics, and private sector institutions testifies to the ‘sea of indicators’ characterizing the current environment. This diversity and ‘over-abundance’ of indicators may itself pose challenges, such as competition between the producers of indicator frameworks and confusion among potential users (Whitby et al. 2014).
The incorporation of well-being measurement into the policy process has implications for Canada’s statistical system. Statistics Canada data are used extensively in indicator initiatives, both nationally and internationally. It is important for the agency to continue to be responsive to the evolving needs of indicator users.Note
3 The subjective well-being approach
While most well-being frameworks include subjective measures, the subjective well-being approach advocates for use of quality of life as the primary measure of well-being. In a recent report, Helliwell (2018) argues for the use of a subjective measure such as life satisfaction as they provide an “umbrella measure” of quality of life.
In the subjective well-being (SWB) approach, “fundamental importance is attached to the evaluations that people make of their own lives.” Proponents of the approach view “…the appeal and usefulness of subjective measures of well-being data, and especially life evaluations, as being due to their primary nature—as unvarnished measures of what people actually think about the quality of their lives” (Helliwell 2018, p. 966).
In its 2013 OECD Guidelines on Measuring Subjective Well-being (OECD 2013), the OECD defines SWB as:
Good mental states, including all of the various evaluations, positive and negative, that people make of their lives and the affective reactions of people to their experiences (p. 10).
This definition covers different aspects of well-being, which the OECD further delineates into three elements:
- Life evaluations—the reflective assessments that people make of their life, or some aspect of it
- Affect—a person’s feelings or emotional state, usually at a particular time (e.g., sadness, worry or happiness yesterday)
- Eudaimonia—an individual’s sense of purpose or meaning in life, and psychological functioning.
The OECD recommends that a question pertaining to life satisfaction serve as the primary measure of SWB, when a single measure is required. This question asks:
The following question asks how
satisfied you feel, on a scale from 0 to 10. Zero means you feel “not at all
satisfied” and 10 means to feel “completely satisfied”.
Overall, how satisfied are you with
life as a whole these days?”
Life satisfaction provides an ‘umbrella measure’ that allows the factors contributing to, or detracting from, well-being to be identified. These measures can thus be used to compare well-being across communities and populations (including measuring inequalities, support research to better understand what drives quality of life), and to inform policy priority setting and decision-making. This approach avoids several challenges facing well-being indicator frameworks including the inherent difficulty of creating a single index from multiple indicators and the choices that must be made regarding which indicators to include, and how to weight reflect their relative importance. If a single composite measure is not created, how to comprehensively understand well-being across multiple indicators and domains is a challenge. Instead, indicators should be used to better understand what drives differences and changes over time in an overall umbrella measure of well-being such as life satisfaction.
3.1 World happiness reports
In 2011, the United Nations General Assembly adopted a resolution calling on member states “to undertake steps that give more importance to happiness and well-being in determining how to achieve and measure social and economic development.” (cited in Helliwell 2019a). The following year, the first edition of the World Happiness Report was released (Global Council for Happiness and Wellbeing 2019). Based on a review of international data and evidence related to the science of happiness, the report demonstrated that the quality of people’s lives can be coherently, reliably and validly assessed by a collection of subjective measures of well-being collectively referred to as “happiness.”
Subsequent annual World Happiness Reports present new evidence on the factors that support well-being, in-depth country assessments, and happiness scores across countries, drawing primarily on data provided by the Gallup World Poll. For example, the 2017 World Happiness Report showed that three-quarters of the variation in average life evaluations observed across more than 150 countries are explained by six variables: gross domestic product (GDP) per capita, healthy life expectancy, having someone to count on in times of trouble, sense of freedom to make key life decisions, trust, and generosity (Helliwell, Huang and Wang 2017). The 2019 World Happiness Report compared average life evaluations in 132 countries over the period from 2005–2008 to 2016–2018 concluding that the greatest losses in life evaluation occurred in Venezuela and Syria (Global Council for Happiness and Wellbeing 2019).
3.2 Integrating subjective well-being into policy
As with well-being indicator frameworks, the integration of Subjective Well-Being (SWB) measures within policy processes is still in its early days. Nonetheless, many applications of SWB tools and metrics can be found in different policy areas. The Global Happiness and Well-being Policy Report 2019, published by the Global Council for Happiness and Wellbeing (2019), highlights innovative practices, evidence and policy recommendations to promote happiness and well-being in six areas: education, workplace, personal happiness, public health, city design, and metrics.
New projects to incorporate happiness in the policy processes are underway in Canada. Statistics Canada has been asked by Canadian Heritage (PCH) and the Canada Council for the Arts to develop an app to address a critical data gap in SWB measures. For these partners, there is a need to empirically demonstrate outcomes related to investments in arts, culture and heritage activities. In response, Statistics Canada is piloting a first use of an app for smartphones that will test the Experience Sampling Method (ESM), which will collect data on SWB measured in the moment against the activity of the respondent at the moment—a method endorsed by the OECD as the most appropriate method for collecting in the moment subjective measures of well-being (OECD 2013). The ESM app will enable reporting of cause-and-effect results at the outcomes level on program and policy areas (Fujiwara and MacKerron 2015).
Another application in the policy domain is life satisfaction analysis designed to convert the difference in life satisfaction associated with an observed characteristic—say, percentage of green space in a neighbourhood—into the estimated change in income that would be required to yield the same increase in well-being (Ambrey and Fleming 2014). This approach was used by PCH to estimate the value of the wellbeing impacts of arts, culture and sports participation in Canada (Lemyre, Mader, and Ambard 2018). This approach is also currently being assessed by federal researchers with the Privy Council Office and Public Health Agency of Canada in a study titled A life satisfaction approach to valuing the impacts of healthy behaviours on subjective-well-being (Joyce 2019). They report that physical activity and smoke-free living are associated with increases in life satisfaction that are equivalent to increases in weekly household income of $631 and $563 respectively. The research community is also engaged in the development of SWB-based tools, including the monetization of life satisfaction for inclusion in the policy process. For example, a special session on Government Budgeting for Happiness is scheduled for the 2020 annual conference of the Society for Quality-of-Life Studies.
3.3 Implications for data collection and measurement
Subjective measures of well-being have been the subject of much methodological assessment. The validity of SWB measures has been confirmed in various studies using alternative approaches and lines of evidence (see reviews in Frijters et al. [2019] and Helliwell and Wang [2012]). Likewise, the relationships between the different elements of SWB—life evaluations, positive and negative affect, and eudaimonia—have been scrutinized, as have various survey design and measurement issues. This is evident in the 265 pages of the OECD’s Guidelines on Measuring Subjective Well-being (OECD 2013), and in a large research literature. Statistics Canada too has assessed life satisfaction responses, analysing issues such as item non-response, survey day and survey month effects, survey framing effects, and survey mode effects (Bonikowska et al. 2014; Arim and Schellenberg 2019).
Statistics Canada has collected a large volume of information using the life satisfaction question. The question is easy to administer, taking less than 20 seconds to answer, and yields a low rate of item non-response (again, supporting the view that the respondents understand and are able to answer the question). The life satisfaction question has been included on the General Social Survey (GSS) in most years since 2003, on the Canadian Community Health Survey (CCHS) since 2009, on the Longitudinal and International Survey of Adults (LISA) since 2014, and on the Canadian Housing Survey (CHS) since 2018. Altogether, between 2009 and 2018 Statistics Canada collected information on the life satisfaction of approximately 800,000 survey respondents. Large samples across household surveys create opportunity for ‘pooling’ data across sources and survey years, thereby increasing the scope for research on specific populations or detailed geographies. Linkages between these large pooled samples and administrative data sources create further opportunity for research. This large repository of life satisfaction data is situated within a broad and rich set of both individual- and neighbourhood-level covariates, providing scope to further expand the evidence related to SWB. The ability to combine and interpret life satisfaction data from a range of surveys is dependent in part on comparability and understanding the impacts of questions asked in the context of different surveys.
4 Economic frameworks—the System of National Accounts
In addition to the well-being indicator framework and SWB approaches discussed above, adaptations and innovations in other measurement systems are underway. The objective of this section is to highlight work on the System of National Accounts (SNA). It is widely recognized that gross domestic product (GDP) is a measure of economic activity, not a metric of economic well-being or sustainability. Yet many believe there should be a much closer relationship between macroeconomic accounting frameworks, governed by the international SNA, and well-being and sustainability.
An update to the SNA2008, the current standard for national accounting, is underway, and the need to incorporate well-being and sustainability measures is one of three key streams on the research agenda. With a leadership role for this research stream, Statistics Canada is well positioned to influence the effort, which involves input from a wide variety of international experts in a range of research spheres.
A long-term vision for expanding the traditional SNA framework to encompass elements of well-being and sustainability might involve a fully elaborated, integrated information system that drills down to micro data sets, and integrates information from a broad range of multidisciplinary spheres. Recognizing that this vision is not practically viable as a generalized international standard in the short term, a more pragmatic approach is being taken for the next update, drawing on key areas where significant measurement frameworks have been developed in the form of specialized “satellite accounts,” closely connected with the dimensions of well-being and sustainability.
Five areas are currently in scope for elaboration, each drawing on a team of designated experts for its development. In general, these are areas where well-established information frameworks and international guidance already exist. They are briefly described below:
- Unpaid household work: Recognizing non-market activities undertaken in the home (often by women) and trade-offs with work in the labour market, caregiving and volunteering. Relationships with time use and developments in the digital economy.
- Environmental–economic accounting: Building in dimensions of the System of Integrated Environmental and Economic Accounts (SEEA) for a more fully elaborated SNA framework explicitly accounting for natural resources, ecosystem services and other environmental impacts.
- Distributions for the household sector: Regularly reporting on distributions of national accounts household income consumption, saving and wealth by quantile or socio-demographic characteristics.
- Education and human capital: Recognizing education and human capital as an investment that creates and ongoing return. More explicitly accounting for labour characteristics in macroeconomic outputs and productivity measures.
- Health and social conditions: Appropriate measurement of non-market outputs in the health care sector and capacity to link outputs to health outcomes.
4.1 Updating the System of National Accounts
While the challenges are considerable and will differ by domain, the intent is to build elaborations or extensions to the SNA rather than radically redefine existing macro measures, such as the GDP, which adequately serve their intended purpose. Neither is the intent to replace the GDP with another single headline indicator. The new, broader, information framework would not be restricted to monetary measures and would aim to enable analysis of interactions of these new dimensions with traditional monetary indicators, as well as linkages among the added dimensions. The expanded system would also relate, at a broad level, to established well-being frameworks, such as the OECD Better Life Index or the Sustainable Development Goals (SDGs).
The development of new international standards to better integrate established measures of economic growth (i.e., GDP) with measures of well-being and environmental sustainability will involve an elaborate range of stakeholders and take considerable time to establish and implement. There may, however, be a number of short-term opportunities to take further steps in this direction, to better showcase work that has already been done, and to build awareness opportunities for collaborative work. Some specific ideas, outlined below, could be a starting point for further development:
- Establish a regular quarterly release for the household sector drawing on information already produced, including context from the Distributions of Household Economic Accounts program.
- Update estimates of households’ unpaid work with recent time use information, with a focus on developments in the digital economy (e.g., offering services on line, participation in platform/“gig” economy).
- Further develop and implement output-based measures for dimensions of the health care sector.
- Build socio-economic characteristics of employment and hours worked into the labour productivity database, facilitating analysis aligned with national accounts indicators and the bridging of social and economic measures in labour accounts.
- Highlighting work on economic–environmental linkages.
5 Current social, economic and environmental trends—implications for well-being measurement
Regardless of how it is measured, the well-being of Canadians continues to be impacted by a broad range of economic, social and environmental developments. Proponents of both the well-being indicator framework approach and the SWB approach have both drawn attention to common themes and issues which represent potential gaps in current measurement frameworks. Six of these are highlighted and described below including implications for the measurement of new and/or timely measures of well-being. In all cases, the following proposals to advance the measurements of well-being will be conducted in accordance with best practices for the development of indicators and would leverage the range of data collection options available at Statistics Canada. More information regarding criteria for quality indicators and data collection options are available in appendices D and E respectively.
5.1 Digitalization
It is now widely recognized that the digital transformation—the social and economic changes associated with Information and Communication Technologies (ICT), automation, artificial intelligence, and other digital technologies—continues to reshape the lives of individuals, communities, and societies. The breadth of the digital transformation is immense, affecting virtually all aspects of peoples’ lives. The impacts of the digital transformation are also varied, ranging from minor adaptations in daily life to potentially transformative changes in fundamental values and processes. And individuals, while often leading ‘tech-saturated’ lives already, continue to face rapid and ongoing technological change.
There are divergent views regarding the opportunities and risks that the digital transformation poses to well-being. For example, a 2018 Pew Research Center study involving over 1,100 technology experts, health specialists, and other key informants found that 47% expect well-being “...to be more helped than harmed by digital life in the next decade,” 32% expect well-being to be more harmed than helped, while the remaining 21% did not expect much change in well-being (Anderson and Rainie 2018). More broadly, questions regarding the impacts of technological change are being raised across many quarters. For example, a recent expert panel identified five aspects of well-being that appear susceptible to the impacts of technology but have received little or no attention in well-being frameworks. These include: human development (including early childhood learning), mental health across the life span, social inclusion, personal and public security, and governance (Gluckman and Allen 2018). This highlights how much is still unknown and how wide ranging the data needs are in this field.
The potential impacts of technological change on well-being have been underscored by well-being researchers. For example, Land and Michalos (2018) highlight the scope and potential impacts of automation and social media, and underscore the importance of updating well-being indicator frameworks to reflect these challenges. Similarly, the impacts of new technologies on well-being are the focus of several chapters of the 2019 World Happiness Report.
Implications for well-being measurement
To better understand the implications of digitization for the measurement of well-being, Statistics Canada is leading an in-depth review of data collect practices in the United Nations Economic Commission for Europe (UNECE) member countries for the Conference of European Statisticians (CES). The review will be published by the CES in 2020. Several of the following initiatives could subsequently be undertaken by Statistics Canada:
- Engaging with the international community: Statistics Canada is prepared to lead an international working group on ‘Measuring Well-Being in the Era of the Digital Society’ for the CES. Building on the in-depth review, the broad objective would be to further advance data collection and measurement practices in this area, with specific priorities established at the CES Plenary meetings held semi-annually.
- Using existing data to inform new well-being indicators: Information on technology use is currently available on Statistics Canada surveys, such as the 2016 GSS (Canadians at Work and Home), the 2014 and 2019 GSS (Victimization) (Statistics Canada 2019a), the 2018 Canadian Internet Use Survey (CIUS), and the LISA. A program of research that exploits this information will be undertaken on issues such as the perceived impacts of social media use; on-line victimization; digital skills; and technology use among population groups (e.g., seniors). This research will help inform the identification of relevant indicators moving forward, including the intensity and frequency use of digital devices and their impact on adults and children, as well as by other intersecting identities. Further work and data collection are needed to understand the link with mental health.
- Embedding well-being in existing surveys: The CIUS will be fielded in 2020 and 2022, offering opportunity to update survey content in response to emerging issues and priorities. Questions on well-being are among the refinements being made to the 2020 survey. Further refinements to the 2022 survey will be informed by consultation and analysis.
- Using a new survey approach to address gaps: In 2020, Statistics Canada started piloting its Web Panel Survey—an online data collection platform that will field approximately 10 minutes of questionnaire content to representative samples of Canadians on a monthly basis. An experimental module of questions on Canadians’ perceptions and experiences of disinformation developed for the Internet and is scheduled to be fielded in the fall of 2020. Information on other aspects of digitalization and well-being could be collected using this vehicle.
- Using new technologies to advance well-being measurement: As part of a new application that will collect real time information from Canadians using smart technologies, Statistics Canada intends to field the Well-being Check. This app will measure in-the-moment well-being indicators (e.g., happiness, anxiety) as well as contextual information (e.g., what you are doing, who you are with). This initiative, which uses Experience Sampling Method, is set to be piloted in the summer of 2020. This approach could be used to collect well-being measures moving forward.
- Measuring the impact of free services: Estimate the impact of free services such as social networks, cloud storage, point-to-point video service (e.g., Skype) on the well-being of users.
- Evaluate individuals’ satisfaction and happiness in light of these changes.
It is not enough to know how the “average” Canadian is doing. It is also important to identify who is being left behind, who may be more resilient and who may experience the greatest degree of opportunity flourishing, so that appropriate policy responses can be designed to support different populations in Canada. Therefore, the development of new indicators must provide an understanding of how the benefits and costs of digital transformation are being realized by different demographic groups such as women, youth, persons with a disability, persons at risk of poverty, Indigenous Peoples, recent immigrants, minority groups and seniors.
5.2 Job quality in a changing new world of work
Changes in Canadian workplaces are relevant to the discussion of well-being. Indeed, given the fact that most working-age individuals spend a significant fraction of their lives working creates a strong link between quality of life and job satisfaction. Today’s jobs differ drastically from those in the past. The remarkable changes in industrial structure, along with technological advancements, changes in the intensity of firm competition and international trade over the past four decades have resulted in changes in several job characteristics. Overall today’s jobs are less likely to be full-time, permanent, unionized or covered by a registered pension plan than they were in the early 1980s.
Job characteristics have changed in different ways for different groups of workers. For example, wages in full-time jobs have grown faster for older workers than for younger ones. Jobs in education, health care and social assistance have become relatively more important for women but not for men. The manufacturing decline observed since the early 2000s reduced wages and full-year, full-time employment rates of men, especially less-educated men living in the affected areas, but had little impact on women (Morissette 2018).
Not all workers are equally represented in high-quality jobs. An assessment of job quality in Canada (Chen and Mehdi 2018) finds diverse patterns of job quality across sectors and socio-demographics groups. In particular, workers with a high school diploma or less education are more likely than other workers to be in jobs involving less flexible work schedules, low autonomy, lack of training opportunities and employment benefits. While young workers are more likely than older workers to hold jobs with involuntary and irregular work schedules, they do relatively well in terms of manageable workload and access to informal training.
As a result of automation driven by the introduction of computer-based technologies, some occupations saw their share of total employment drop significantly (Frenette and Frank 2020). For example, only 7% of women aged 17 to 64 were employed in office support occupations in 2019, down from 13% in 1989. Several groups of workers are more likely to face a high risk, including older workers (55 or above), workers with no postsecondary credentials or with postsecondary credentials in certain fields, individuals with low literacy or numeracy proficiency, low earners, part-time workers, employees in small firms, and manufacturing workers.
Along with the changes documented above, gig employment is another changing dimension of work. Contrary to employees, gig workers are usually not in an employer–employee relationship. This includes highly skilled freelancers as well as on-demand workers hired for jobs through the growing number of online platforms. Statistics Canada has pioneered a clearly defined methodological framework for identifying gig workers in Canada based on various Canadian administrative sources (Jeon, Liu and Ostrovsky 2019). The study shows that the percentage of workers involved in gig work increased from 5.5% in 2005 to 8.2% in 2016. More than half of gig workers combine gig work with wages and salaries from another job, and the annual income of a typical gig worker was usually low. Gig work was more prevalent among workers in occupations in arts, entertainment and recreation, and among immigrants.
The changing nature of work and impact on well-being are also influenced by the decisions of firms. These include decisions that directly impact workers, such as levels of remuneration, the nature of the employment contract, the availability of pensions and health plans, work-life balance initiatives, and employee and family support programs. The impacts of automation and technologies in the workplace on task content, skill requirements and job security are also centre stage in research and public discussion. Business decisions also affect consumers and the public at large, such as charitable and philanthropic initiatives, the creation of safe and healthy products, and the fostering of a secure and healthy environment both in the workplace and in the community at large.
Based on their meta-analysis of 339 studies undertaken by Gallup, Krekel, Ward and de Neuve (2019) report a positive correlation between employee well-being and several firm-level measures of performance, including productivity, customer satisfaction, staff turnover, and stock price. They go on to highlight workplace interventions pertaining to social relationships (e.g., employee supervision), task content and work-life balance.
Implications for well-being measurement
These new forms of employment interrelate with multiple facets of economic well-being of Canadians, such as work conditions and benefits, access to employment insurance, family-work balance and older workers’ transition to retirement and retirement income. To continue to build the data and evidence base to understand the changing nature of work and impact on well-being, the following activities could be undertaken to advance well-being measurement in this area:
- Measuring the gig-economy: While some research already confirms that workers in non-standard employment arrangements cumulate many disadvantages in the workplace other than being low-paid, it remains unclear how gig employment exactly intersects with precarity and overall socio-economic well-being. Statistics Canada is looking at potential survey–administrative integrated data sources that could shed light on multidimensional quality indicators of non-standard employment.
- Understanding quality of work by sector: Impacts of all these changes diverge at the regional and sectoral levels. Certain sectors and regions are facing significant labour and skill shortages while some others have much higher unemployment rates. This labour market imbalance was voiced by many industrial stakeholders and urges more nuanced analysis. Moreover, with some resource-based industries transitioning to a low-carbon economy, the way in which workers transition at local labour markets and across industries, as well as needs for necessary reskilling and upskilling are emerging questions that require further integrated data and analytical evidence linking the labour demand and supply information at a more granular level. Statistics Canada has started to consider the possibilities of linking demand data such as Job Vacancy and Wage Survey of employers with supply data such as Labour Force Survey to gauge the unmet needs and address this information gap.
- Well-being benefits of new job opportunities: While so far much of the focus has been on the risks and challenges posed by the new world of work, in recent years we also see increasing needs for data and analysis on new opportunities (e.g., new jobs and skills) to help harness a complete understanding of the prospects of future jobs.
- Measuring the impact of firms on employee well-being: The development of firm-level, individual-level, and employer–employee matched data files at Statistics Canada provides a foundation upon which further data collection and analysis relevant to the workplace and well-being can be built.
- Job quality: Re-administer job quality and other related questions asked in the 2016 GSS on Canadians at Work and Home, the last cycle of the GSS to have asked a comprehensive set of questions measuring quality of life of Canadians and their views about work, and work–life balance (Statistics Canada 2019a).
5.3 Affordability and economic uncertainty
In the Canadian context, there are three distinct lines of analysis that focus on trends in affordability and economic uncertainty and their implications for the economic well-being of families. The first line of analysis centres on the escalation of housing prices in major urban centres, most notably in Vancouver and Toronto, and on the concomitant effects that rising home prices have inter alia on families looking to purchase homes, or on existing homeowners who, after taking on high levels of mortgage debt, may be less able to absorb financial stresses associated with income shocks or rising debt-serving costs. Household debt-to-income levels had risen markedly in many Canadian cities, and concerns over escalating home prices have precipitated a range of policy responses from federal and provincial governments designed to curb the influence of foreign and/or speculative investors as potential sources of home price inflation.
Homeownership matters to economic well-being because it is the central vehicle through which many families, particularly those with mid-range incomes, build and accumulate wealth over the course of their economic life, especially in an era of declining pension coverage. Families that invest in homeownership have markedly higher net financial worth than those that remain in the rental market. These distinctions are readily apparent among younger families. For instance, millennials between the ages of 30 and 34 who own their homes have a median net worth of about $300,000, compared to about $20,000 among those who do not own their principal residence. Market conditions that make transitions to homeownership increasingly difficult for mid-range earners can be expected to have a material impact on the extent to which many families are able to build wealth over time.
The second line of analysis that examines how pressures related to affordability are affecting economic well-being focuses on the extent to which rising living costs are placing increasing stress on family pocketbooks. While nominal earnings growth for mid-earning families have generally kept pace with consumer inflation, increases in the costs of living—which relate more narrowly to prices increases for food, transportation and shelter, or for (largely) non-discretionary services related to health, education, and childcare—have outpaced nominal earnings growth in recent years and now account for a larger share of overall household spending. While the pace at which the prices for these goods and services have risen relative to household earnings varies considerably across the country, the general increase in these living costs is likely to underlie much of the sentiment data that identifies pocketbook issues as the major stressor facing many Canadian families.
The third line of analysis focuses on subjective measures of individuals’ assessment of their economic well-being. Such measures better capture angst and feelings of uncertainty related to economic situation, feelings which in turn impact overall well-being. Economic well-being has been linked to a significant part of the variation in overall life satisfaction of Eastern Europeans (key driver for overall life satisfaction) (Hayo and Seifert 2003). In Canada, results from the 2016 General Social Survey (GSS), too, highlight a link between subjective economic well-being and overall life satisfaction. Moreover, GSS results also show that there is a different relationship between objective economic measures and subjective economic measures when it comes to being satisfied with one’s life. Among seniors, for example, there is no significant association between family income and life satisfaction but economic well-being is associated with life satisfaction. For instance, those who reported that their retirement income was insufficient and those who stated that financial concerns represented their main source of stress had lower life satisfaction scores (Statistics Canada 2018).
Subjective measures capturing the stresses, worries and aspirations of people in Canada are fielded less often and in far less comprehensive a manner. The relative lack of subjective information is a data gap, especially when economic indicators and polling results tell seemingly different stories about the financial security of Canadians. This gap is exacerbated when traditional economic indicators are released monthly or quarterly but Canadians’ outlooks as measured on household surveys are released sporadically and are a year or more out-of-date.
Implications for well-being measurement
While most well-being frameworks include measures of economic well-being such as income and living standards, more is needed to understand the diversity of experiences and potential inequality as well as subjective measures to better understand how individuals feel about their economic situation—these concepts are currently not measured in more traditional economic indicators. The following activities could be undertaken to address these gaps:
- Measuring the pressure of housing on economic and overall well-being: New data from the Canadian Housing Statistics Program and the CHS can be used to support more detailed assessments of pressures related to housing affordability, particularly as these relate to differences in family income and other socio-demographic factors. The challenge will be to identify a small set of variables (at a sufficient level of geographic granularity) that can be used to track meaningful differences in housing market activity and outcomes for specific groups over time.
- Measuring differences in cost of living: Data on rising living costs present more of a challenge from a measurement perspective. Progress here may depend on the development of specialized price indexes that more fully capture movements in cost-of-living expenditures for specific groups of households relative to incomes. This would support a more rigorous analysis of the evolution of these costs pressures for specific types of families.
- Understanding subjective measures of economic well-being: Subjective measures of economic well-being have been captured in selected Statistics Canada surveys including the 2016 GSS (Statistics Canada 2019a). For example, questions available in the 2016 GSS include those related to future economic and financial situation (i.e., will it be better, the same or worse). These data can be used to study the feasibility of using such indicators as subjective measures of economic well-being moving forward.
- New data collection of subjective measures of well-being: Additional data collection will be required to collect subjective measures of well-being on a routine basis. At this time, while the Agency does collect some information, it is currently on an ad hoc basis. Regular data collection on key subjective measures is required to support timely and meaningful reporting.
- Using external data sources: Statistics Canada could seek partnerships with external data providers such as polling firms that also conduct survey among Canadians to assess and track subjective measures of economic well-being. For example, Bloomberg Nanos Canadian Confidence Index (BNCCI) is a weekly measurement of the economic mood of Canadians.
5.4 Populism and social cohesion
Subjective measures of attitudes and outlooks extend beyond financial and economic issues. The past decade has seen the emergence of populist political movements in several countries.Note Various explanations for this have been offered. One view is that populism is a response among some segments of national populations to a ‘runaway world’ of change that “…is emerging in ‘an anarchic, haphazard, fashion….fraught with anxieties, as well as scarred by deep divisions and a feeling that we are all ‘in the grip of forces over which we have no control’” (Cox 2017, p. 9). The result, it is argued, is a loss of self-identity and sense of one’s place in the world and receptivity to populist movements that promise a return to “more stable, more settled times” (p. 9).
The notion of populism and societal fragmentation can be linked to underlying economic and social conditions that lead individuals to feel marginalized and “left behind.” Changing economic conditions related to globalization and technological change, it is argued, have benefitted some segments of the population but left others behind. In the face of stagnating wages, job insecurity, and financial precariousness, segments of the population may see populist movements as a way to return to more prosperous times. Underlying both accounts is a sense of individual powerlessness and a loss of faith in traditional political leaders to make decisions on behalf of ‘the people’ (Cox 2017).
Underlying social factors associated with populism could be understood through a framework of social cohesion and trust in public institutions. A fractured, divided society where values are not shared, or where groups of people are economically or socially isolated, will lead a lashing out through votes, towards a politician who claims to represent them and who will agree to take-down the elite who have left them in the fractured state. Social cohesion is a closely related concept to understand the root causes of today’s populism (Bowlby 2019). The OECD (2011) defines social cohesion as “a cohesive society that works towards the well-being of all its members, fights exclusion and marginalization, creates a sense of belonging, promotes trust, and offers its members the opportunity of upward social mobility.” Social cohesion, according to the OECD, comprises of social inclusion, social mobility and social capital.
In Canada, the definition of social cohesion used by the Department of Canadian Heritage (PCH) emphasizes “…the willingness of individuals to cooperate and work together at all levels of society to achieve collective goals” (Jeannotte 2003). PCH is leading Government-wide work on social cohesion, having been tasked with exploring and assessing indicators that could serve as a proxy for social cohesion or social fracturing in Canada, such as inequality and support for diversity. Policy efforts to address social cohesion include a focus on the Digital Citizen to build resilience against online disinformation and Multicultural Programs to support initiatives aimed at addressing racism and discrimination. Statistics Canada has supported PCH in an initial review of social cohesion indicators and more intensive collaboration is expected to take place in 2020-2021.
Implications for well-being measurement
What are the implications of populism for the measurement of well-being? To address this question, the focus must be placed less on measuring and monitoring populism and the political interests of individuals per se, but rather focus on the underlying economic and social conditions. While there are a range of economic (e.g., income, employment) and social cohesion (e.g., community vitality) indicators currently included in exiting well-being framework, the following advances could be made to further refine measures to address these issues:
- Measures to identify who is at risk: The fractious nature of populism further emphasizes the need to disaggregate measures and indicators of economic well-being (e.g., income, employment) to better identify population groups who may be “at-risk” of being left behind; these many be defined geographically, by industry or by individual characteristics (e.g., age, sex, ethnicity, immigration status).
- Measuring inequality: There is a need to emphasize measures of economic inequality (e.g., Gini coefficient) to better monitor disparities in addition to more traditional measures of economic well-being based on averages (e.g., average income).
- Measuring subjective economic well-being: The feeling of uncertainty and concerns about being left behind economically associated with populism provides further evidence of the need for subjective measures of economic well-being in addition to objective measures (e.g., unemployment rates, poverty rates).
On the social side, the following efforts could be undertaken to enhance existing measures of social cohesion:
- More frequently collected measures of social cohesion: Address data gaps and/or enhance current measures by developing modules of content that can be included in new web panel or planned omnibus collection platforms. These proposals are currently being developed as part of the work to modernize the GSS and would identify new combinations of questions that could be fielded as modules in a more timely way to address indicator needs as required.
- Ensuring adequate sample sizes: Increase sample sizes for surveys that focus on diversity topics so that characteristics and activities of ‘non-majority’ groups can be better analysed and so that data outputs can be disaggregated at a more detailed level than in the past. For example, PCH has purchased an oversample for the 2020 Social Identity Cycle of the GSS for this specific reason, and Indigenous Services Canada funded an additional sample on the 2019 Victimization Survey.
- Undertake in-depth analysis of social cohesion indicators currently available in Statistics Canada surveys, including the GSS and the Canadian Housing Survey (CHS) to inform the development of new measures moving forward.
5.5 Neighbourhoods, communities and the built environment
The geographic scale at which well-being is measured, analyzed and applied in the policy process is another salient theme. As noted previously, local communities and regional governments continue to express interest in well-being indicator frameworks, as evidenced by recent projects undertaken in partnership with the Canadian Index of Well-being (CIW). Likewise, Whitby et al. (2014) underscore the receptivity of local communities to such initiatives, reporting that
The most prolific successes that we encountered were achieved by local level indicators, perhaps because the distance between producer and user of the indicators is much smaller…making it easier to achieve a better ‘fit’ while also achieving legitimacy and relevance. (p. 16).
Similarly, community- and neighbourhood-level perspectives on well-being is evident in the SWB approach. Some recent Canadian publications along this line include Lu, Schellenberg and Hou (2015) and Helliwell, Shiplett and Barrington-Leigh (2018). Many of the factors that play an important role in subjective well-being, such as social supports, welcoming communities, trust, generosity and a healthy environment (Helliwell 2019b) play out at the local level, with important implications for data collection and measurement. The relationships between neighbourhood characteristics and the well-being of residents is also highly relevant to many areas of public policy, such as population health, housing, and urban planning.
Recent evidence from Statistics Canada, for example, reveal a strong connection between living in a walkable neighbourhood and physical activity among adults (Colley et al. 2019). Neighbourhood characteristics can also have a negative impact on well-being. Data from the General Social Survey (GSS) on Victimization show that Canadians who perceive one or more indicators of neighbourhood disorder are more likely to report being afraid when walking alone after dark, using or taking public transportation, or when home alone in the evenings and that Canadians who perceive disorder in their neighbourhoods also report lower average life satisfaction overall than those who do not (Cotter 2016).
The importance of the concept of community is further emphasized by national organizations such as the Canada Mortgage and Housing Corporation (2018) who have emphasized the importance that neighbourhoods play in addition to housing in Canada’s National Housing Strategy.
Implications for well-being measurement
The demand for neighbourhood level information has implications for various activities at Statistics Canada, including data development, measurement development and validation, research, and access/dissemination:
- Using existing surveys to gather needed data by revising and adding questions, by fielding survey modules more quickly and frequently and by increasing sample sizes: for example, Statistics Canada is working on revisions to the 2020 CHS, including the addition of questions on trust, community belonging, and subjective definitions of ‘neighbourhoods.’ As well, the GSS is being modernized and, for existing survey cycles, GSS partners have provided funding to supplement sample sizes in order to obtain a more granular level of data: the 2020 GSS on Social Identity and the 2019 GSS on Victimization both include important questions on well-being and inclusion (some of which can be used to provide community indicators at the national and provincial level), and sample supplements recently funded by PCH and Indigenous Services Canada will improve the possibilities for analysis at the metropolitan area level.
- Understanding social ties at the local level: The Community Well-Being Survey was fielded by the CIW in Nova Scotia in 2019, yielding a sample of almost 13,000 Nova Scotians and a large set of ‘field-tested’ questions. A factor analysis identifying core elements of the social fabric at the local level would help guide measurement moving forward. Similar analysis could potentially be undertaken with data provided by the 2013 and 2020 GSS cycles on Social Identity.
- Understanding the relationships between neighbourhood characteristics and well-being: Statistics Canada is using pooled CCHS files data and a suite of neighbourhood-level variables from different sources to document the correlation between neighbourhood characteristics at the dissemination area (DA) level (e.g., proximity to transit and amenities, crime, household income, population density) and life satisfaction, net of individual characteristics. The sample includes 45,000 respondents, in 7,000 DAs, across 31 census metropolitan areas. This work will inform the identification of critical neighbourhood indicators that could be considered as part of a well-being framework.
- Using administrative data to create new measures at the neighbourhood level: Administrative data provide tremendous opportunity for creating new measures at the neighbourhood level. In general, these data offer national coverage and are available on a routine basis (i.e., monthly, annually). For example, existing administrative and census data were used to create measures of walkability (Colley et al. 2019). Tax and residential data are currently being used to create measures of income mixing.
- Measuring social ties at the local level: There is a need to strengthen Statistics Canada’s concepts and measures of social ties, supports and belonging at the local level. The questions currently used yield different results among some populations and are fielded inconsistently across surveys. An assessment of the strengths and weaknesses of survey questions would help guide measurement strategies moving forward building on work previously conducted by the Agency.
5.6 Environment and climate change
The United Nations (n.d.) refers to climate change as the “defining issue of our time and that we are at a defining moment”; and “the impacts of climate change are global in scope and unprecedented in scale.” Canadians from coast to coast to coast are increasingly concerned about the significant risks posed by climate change and have asked the government to respond accordingly. The climate crisis is having a direct impact on the economic, social and well-being of people in this country and on the integrity of our natural systems.
Substantial research activity has been devoted to understand, for example, how health outcomes are negatively influenced by environmental hazards such as air pollution (Burnett et al. 2018), forest fires (Henderson et al. 2011), and water pollution (Medeiros et al. 2017), as well as shaped by environmental benefits such as green space (Crouse et al. 2017) and proximity to water (Crouse et al. 2018). However, the environment is constantly in flux—global climate change and more localized human activities such as changes to land use and urban planning also influence health. For example, the unusual 2018 forest fires in British Columbia had detrimental effects on both the Canadian economy and the well-being of those who were directly affected by these events (Wang and Strong 2019). The 2019 Canada’s Changing Climate Report led by Environment and Climate Change Canada summarized these changes in the Canadian context, including changes to temperature patterns, rainfall, snow cover, climate extremes, freshwater availability, and sea level (Bush and Lemmen 2019).
Although there is a growing understanding on how the environment and our own well-being are interconnected, the full extent of this relationship merits further exploration. Exposures to environmental factors is not equal amongst all people in Canada—for example, air pollution is higher for immigrant and visible minority populations in urban areas (Pinault, van Donkelaar and Martin 2017). In addition to differences in exposures, susceptibility to environmental factors may also be unequal. For example, air pollution can have a greater health impact on diabetics (Pinault et al. 2018) or those experiencing stress (Thomson 2019). Access to services such as health care and social infrastructure are also unequally distributed within Canada (Shah, Bell and Wilson 2016). It is therefore of utmost importance to understand how these distinct elements translate to differences in health outcomes and indicators of well-being among Canadians, in the context of a changing environmental landscape.
A key initiative to help assess these impacts and measure progress has been the integration of multiple data sources from various partners. Over the past several years, Statistics Canada has been a leader in developing integrated datasets (e.g., Tjepkema et al. 2019). For example, these data have been used to examine the effects of exposure to long-term ambient air pollution and mortality (Christidis et al. 2019; Pappin et al. 2019). In the future, new environmental data can be integrated with Statistics Canada’s data holdings, including powerful analytical health cohorts that can be leveraged towards disentangling these differences in exposure, susceptibility, and health outcomes among environmental hazards or benefits, considered alone or in combination.
Implications for well-being measurement
Canada has limited, fragmented and incomplete information on this complex issue to make informed evidence-based investments and policy decisions to protect Canadians and Canada’s natural resources assets. To advance well-being measurement on the environment and climate change, the following activities are recommended:
- Establish a Census of the Environment: By using existing
Earth Observation and other data sets, a Census of the Environment could be
developed to provide a comprehensive and evergreen registry of Canada’s
ecosystem assets. The existence of this detailed, integrated, and Canada-wide
assessment of the country’s natural assets will create unprecedented
opportunities to examine social and economic issues within the context of the
environment. A particularly important goal of this proposal is to provide
information on ecosystems that is detailed enough to help communities navigate
issues such as adapting to a changing climate. The Census would comprise two
parts:
- Register of Ecosystem Assets that would establish and monitor the extent and condition of Canada’s ecosystems—such as wetlands, forests and flood plains—along with the services they provide—air filtration, water purification, flood protection, habitat conservation and carbon sequestration; and
- A complete suite of environmental accounts that link environmental information to the vast array of socio-economic data available in the System of National Accounts and elsewhere in the Canadian national statistical system.
- Environment and well-being: As is currently done for cultural and sports activities, the ESM app could be used to gather data on effects of nature and environment on people’s well-being. This has been a major use of the data from the Mappiness app in the U.K. (Williams 2017). New questions on the environment and well-being could be added to other data collection vehicles as well.
- Measures of environmental justice: Knowing that exposures to environmental factors are not equally distributed across all Canadians, new indicators of environmental justice are needed. The Census and health surveys can be attached to environmental exposures of air pollution, forest fire / smoke proximity, lack of greenness, and other measures to create descriptive statistics of differences in exposures among different population groups in Canada. Additionally, back-cast environmental data can be used to describe how exposures to hazards have changed over time. For example, these initiatives could determine if long-term reductions in traffic-related air pollution have affected all population groups equally. Continuing with existing research, longitudinal cohorts created through data integration such as the CanCHEC and the CCHS linked to Vital Statistics data (i.e, mortality) can be used to assess differences in susceptibility to these exposures among populations defined by chronic disease conditions and social parameters.
6 Moving forward with well-being measurement
More and more, countries around the world are moving beyond simply measuring and monitoring towards integrating well-being measurement in the policy process, aligning government priorities and funding decisions to advance the well-being of their citizenry. As suggested in the ministerial mandate letters, the Government of Canada is invested in moving in this direction. Several key lessons from international experiences suggest the need for strong leadership within government to advance the well-being agenda; the use of a range of legislative and policy mechanisms such as mandatory reporting to support the integration of well-being frameworks in the policy process; and the need for governments to work hand-in-hand with national statistical organizations to advance well-being measurement.
In Canada, there have been significant gains made in the measurement of well-being with the development of several national and international multi-dimensional frameworks populated with a range of objective and subjective indicators. Advances in the study of subjective measures of well-being such a quality of life continue to deepen our understanding of what drives quality of life among people in this country.
Nevertheless, despite the advances that have been made to date, several gaps in well-being measurement have been identified given the current economic, social and environmental trends impacting the well-being of people in Canada. Several options are presented in this report to advance well-being measurement in areas such as the impacts of digitization, affordability and economic uncertainty, quality of work, social cohesion, neighbourhoods and climate change. A measured approach should be adopted, beginning with the use of existing data to conduct the necessary research and analysis to develop new measures informed by expert opinion and international experiences, and guided by quality standards. Administrative data and new data collection approaches should be leveraged to deliver indicators that are timely and sustainable, and enable the appropriate levels of disaggregation to highlight the diversity of experiences and realities among Canadians.
To support the use of well-being measures to advance an integrated policy approach that considers the social, environmental and economic goals and related interdependencies, the well-being measures themselves should be integrated. This can be achieved at various levels. As has been done with frameworks internationally, well-being indicators should be presented in an integrated and interactive tool that allows users to better understand the relationships within and across domains. Further integration can be achieved at the microdata level by advancing initiatives such as the expansion of the System of National Accounts framework to encompass elements of well-being and sustainability starting with the development of specialized ‘satellite accounts.’ A similar approach has been advocated for social statistics through the development of a social accounting framework (Hicks 2011). Data on a range of well-being domains can also be integrated at the individual level to better understand the relationships between various aspects of well-being; this approach is best suited to further advance studies of ‘umbrella measures’ of well-being such as quality of life to better understand what domains are most significant.
Moving forward, Statistics Canada stands prepared to collaborate with federal and other partners to develop a framework and new well-being indicators that reflects core Canadian values, addresses the diversity of experiences and regional realities, and supports government decision-making.
Appendix A: Summary of well-being indicators
| Health | CIW | OECD | SDGs Canada | New Zealand | Scotland | Wales | United Kingdom |
|---|---|---|---|---|---|---|---|
| Life expectancy at birth | ✓ | ✓ | ✓ | not applicable | not applicable | ✓ | ✓ |
| Healthy life expectancy | not applicable | not applicable | not applicable | ✓ | ✓ | ✓ | ✓ |
| Incidence of the 10 leading causes of death, by cause | not applicable | not applicable | ✓ | not applicable | not applicable | not applicable | not applicable |
| Population rating of overall health | ✓ | ✓ | ✓ | ✓ | not applicable | ✓ | not applicable |
| Population rating of mental health | ✓ | not applicable | ✓ | not applicable | not applicable | ✓ | not applicable |
| Level of stress | not applicable | not applicable | ✓ | not applicable | not applicable | not applicable | ✓ |
| Population without health or activity-based limitations | ✓ | not applicable | not applicable | not applicable | not applicable | not applicable | not applicable |
| Proportion of adults with two or more risk behaviours (current smoker, harmful drinking, low physical activity, obesity) | not applicable | not applicable | not applicable | not applicable | ✓ | not applicable | not applicable |
| Percentage of people who reported a disability | not applicable | not applicable | not applicable | not applicable | not applicable | ✓ | ✓ |
| 12 to 19 years old who occasionally smoke | ✓ | not applicable | not applicable | not applicable | not applicable | not applicable | not applicable |
| Prevalence of daily smoking | not applicable | ✓ | ✓ | not applicable | not applicable | ✓ | not applicable |
| Population self-reporting diabetes | ✓ | not applicable | not applicable | not applicable | not applicable | not applicable | not applicable |
| Population with influenza immunization in past year | ✓ | not applicable | not applicable | not applicable | not applicable | not applicable | not applicable |
| Vaccination rate, by disease | not applicable | not applicable | ✓ | not applicable | not applicable | not applicable | not applicable |
| Prevalence of certain diseases, by disease | not applicable | not applicable | ✓ | not applicable | not applicable | not applicable | not applicable |
| Percentage with a regular doctor | ✓ | not applicable | not applicable | not applicable | not applicable | not applicable | not applicable |
| Frequency of 15 minutes or more of physical activity (monthly) | ✓ | not applicable | ✓ | not applicable | ✓ | not applicable | not applicable |
| Obesity prevalence | not applicable | ✓ | ✓ | not applicable | ✓ | ✓ | not applicable |
| Consumption of sugars, sodium, saturated fat, sugar-sweetened beverages, and fruits and vegetables by Dietary Reference Intakes, per category | not applicable | not applicable | ✓ | not applicable | not applicable | not applicable | not applicable |
| Percentage of adults with high levels of psychological distress | not applicable | not applicable | not applicable | ✓ | ✓ | not applicable | ✓ |
| Suicide rate | not applicable | not applicable | not applicable | ✓ | not applicable | ✓ | not applicable |
| Quality of care experience | not applicable | not applicable | not applicable | not applicable | ✓ | not applicable | not applicable |
| Proportion of short journeys less than 2 miles that are made by walking | not applicable | not applicable | not applicable | not applicable | ✓ | not applicable | not applicable |
| Mortality rates | not applicable | not applicable | not applicable | not applicable | ✓ | ✓ | not applicable |
| Mental well-being | not applicable | not applicable | not applicable | not applicable | not applicable | not applicable | ✓ |
| Some evidence indicating depression or anxiety | not applicable | not applicable | not applicable | not applicable | not applicable | not applicable | ✓ |
| Notes: CIW: Canadian Index of Well-being; OECD: Organisation for Economic Co-operation and Development; SDG: Sustainable Development Goal. | |||||||
| Living Standards | CIW | OECD | SDGs Canada | New Zealand | Scotland | Wales | United Kingdom |
|---|---|---|---|---|---|---|---|
| Life satisfaction | not applicable | ✓ | ✓ | ✓ | not applicable | ✓ | ✓ |
| Sense of purpose in one's life | not applicable | not applicable | not applicable | ✓ | not applicable | not applicable | not applicable |
| After-tax median income of family | ✓ | not applicable | not applicable | not applicable | not applicable | not applicable | not applicable |
| Average gross earnings for full-time employees | not applicable | ✓ | not applicable | not applicable | not applicable | not applicable | not applicable |
| Average or median hourly earnings | ✓ | not applicable | ✓ | ✓ | not applicable | ✓ | ✓ |
| Percentage living in poverty | ✓ | not applicable | ✓ | not applicable | ✓ | not applicable | not applicable |
| Percentage of children living in households experiencing material hardship | not applicable | not applicable | not applicable | ✓ | not applicable | not applicable | not applicable |
| Proportion of individuals living in a private household with an equivalised income less than 60% than the median after-housing costs | not applicable | not applicable | not applicable | not applicable | ✓ | not applicable | not applicable |
| Proportion of people living below 50% median income | not applicable | not applicable | ✓ | not applicable | not applicable | not applicable | not applicable |
| Transfers and share of total after-tax income held by 40% of the population at the bottom of the income distribution | not applicable | not applicable | ✓ | not applicable | not applicable | not applicable | not applicable |
| Household disposable income | not applicable | ✓ | not applicable | ✓ | not applicable | not applicable | not applicable |
| Household net wealth | not applicable | ✓ | not applicable | ✓ | not applicable | not applicable | not applicable |
| Household debt | not applicable | ✓ | not applicable | not applicable | ✓ | not applicable | not applicable |
| Percentage of adults who report they do not have enough money to meet everyday needs | not applicable | not applicable | not applicable | ✓ | not applicable | not applicable | not applicable |
| Gini coefficient (income gap) | ✓ | not applicable | ✓ | not applicable | ✓ | not applicable | not applicable |
| Gender pay gap | not applicable | not applicable | not applicable | not applicable | ✓ | ✓ | ✓ |
| Average weekly household expenditure | not applicable | not applicable | not applicable | ✓ | ✓ | not applicable | not applicable |
| Households that have food insecurity | ✓ | not applicable | ✓ | not applicable | not applicable | not applicable | not applicable |
| Housing affordability | ✓ | not applicable | not applicable | ✓ | not applicable | ✓ | not applicable |
| Proportion of households in core housing need, by need type | not applicable | not applicable | ✓ | ✓ | not applicable | not applicable | not applicable |
| Household expenditures on housing | not applicable | ✓ | not applicable | not applicable | not applicable | ✓ | not applicable |
| Housing satisfaction | not applicable | not applicable | not applicable | not applicable | ✓ | not applicable | ✓ |
| Number of rooms per person | not applicable | ✓ | not applicable | ✓ | not applicable | ✓ | not applicable |
| Dwellings without basic sanitary facilities | not applicable | ✓ | not applicable | not applicable | not applicable | ✓ | not applicable |
| Percentage of households that have access to fixed broadband Internet access services | not applicable | not applicable | ✓ | not applicable | not applicable | not applicable | not applicable |
| Percentage of population that has access to the latest generally deployed mobile wireless technology | not applicable | not applicable | ✓ | not applicable | ✓ | not applicable | not applicable |
| Percentage of labour force employed or employment rate | ✓ | ✓ | not applicable | ✓ | not applicable | not applicable | not applicable |
| Percentage of labour force unemployed/in long-term unemployment | ✓ | ✓ | ✓ | ✓ | not applicable | not applicable | not applicable |
| Percentage of youth not in employment, education or training | not applicable | not applicable | ✓ | ✓ | ✓ | not applicable | not applicable |
| Labour market participation | not applicable | not applicable | not applicable | not applicable | ✓ | not applicable | not applicable |
| CIBC index of employment quality | ✓ | not applicable | not applicable | not applicable | not applicable | not applicable | not applicable |
| Labour market insecurity (probability of a worker being unemployed, average duration of unemployment, unemployment benefits received) | not applicable | ✓ | not applicable | not applicable | ✓ | not applicable | not applicable |
| Incidence of job strain | not applicable | ✓ | not applicable | not applicable | not applicable | ✓ | not applicable |
| Food insecurity | not applicable | not applicable | not applicable | not applicable | ✓ | not applicable | not applicable |
| Notes: CIBC: Canadian Imperial Bank of Commerce; CIW: Canadian Index of Well-being; OECD: Organisation for Economic Co-operation and Development; SDG: Sustainable Development Goal. | |||||||
| Education | CIW | OECD | SDGs Canada | New Zealand | Scotland | Wales | United Kingdom |
|---|---|---|---|---|---|---|---|
| Percentage of aged 0 to 5 with regulated child care space | ✓ | not applicable | not applicable | not applicable | not applicable | not applicable | not applicable |
| Time spent on talk-based activities for aged 0 to 14 | ✓ | not applicable | not applicable | not applicable | not applicable | ✓ | not applicable |
| Average expenditure per public school student | ✓ | not applicable | not applicable | not applicable | not applicable | ✓ | not applicable |
| Ratio of students to teachers | ✓ | not applicable | ✓ | not applicable | not applicable | not applicable | not applicable |
| Average undergrad tuition fees | ✓ | not applicable | not applicable | not applicable | not applicable | ✓ | not applicable |
| Percentage of aged 20 to 24 in labour force with high school | ✓ | not applicable | ✓ | not applicable | not applicable | not applicable | not applicable |
| Upper secondary educational attainment, people aged 25 to 34 | not applicable | ✓ | not applicable | not applicable | not applicable | not applicable | not applicable |
| Percentage of aged 25 to 64 with at least an upper secondary education | not applicable | not applicable | not applicable | ✓ | not applicable | not applicable | not applicable |
| Percentage of aged 25 to 64 years old with university degree | ✓ | not applicable | ✓ | ✓ | not applicable | not applicable | not applicable |
| Percentage of aged 25 or older furthering education related activities | ✓ | not applicable | not applicable | not applicable | not applicable | not applicable | not applicable |
| Expected years in education | not applicable | ✓ | not applicable | not applicable | not applicable | ✓ | not applicable |
| Cognitive skills of 15-year-old students (mean score for reading, math, science) | not applicable | ✓ | not applicable | ✓ | ✓ | not applicable | not applicable |
| Competencies of the adult population | not applicable | ✓ | not applicable | not applicable | not applicable | not applicable | not applicable |
| Work place learning (job-related training) | not applicable | not applicable | not applicable | not applicable | ✓ | ✓ | not applicable |
| Skill shortage vacancies | not applicable | not applicable | not applicable | not applicable | ✓ | not applicable | not applicable |
| Skills underutilisation | not applicable | not applicable | not applicable | not applicable | ✓ | not applicable | not applicable |
| Human capital - the value of individual's skills, knowledge, and competences in labour market | not applicable | not applicable | not applicable | not applicable | not applicable | not applicable | ✓ |
| Residents with no qualifications (aged 16 to 64) | not applicable | not applicable | not applicable | not applicable | not applicable | not applicable | ✓ |
| Notes: CIW: Canadian Index of Well-being; OECD: Organisation for Economic Co-operation and Development; SDG: Sustainable Development Goal. | |||||||
| Leisure and Culture | CIW | OECD | SDGs Canada | New Zealand | Scotland | Wales | United Kingdom |
|---|---|---|---|---|---|---|---|
| Time spent on leisure activities | ✓ | ✓ | not applicablenot applicable | not applicablenot applicable | not applicablenot applicable | ✓ | ✓ |
| Time spent on arts and culture activities (daily) | ✓ | not applicablenot applicable | not applicablenot applicable | not applicablenot applicable | ✓ | not applicablenot applicable | ✓ |
| Attendance of performing arts performances | ✓ | not applicablenot applicable | not applicablenot applicable | not applicablenot applicable | ✓ | not applicablenot applicable | not applicablenot applicable |
| Hours volunteering for culture or recreational organizations | ✓ | not applicablenot applicable | not applicablenot applicable | not applicablenot applicable | ✓ | not applicablenot applicable | ✓ |
| Visits to national parks and historic sites | ✓ | not applicablenot applicable | not applicablenot applicable | not applicablenot applicable | ✓ | ✓ | ✓ |
| Number of nights away on vacation | ✓ | not applicablenot applicable | not applicablenot applicable | not applicablenot applicable | not applicablenot applicable | not applicablenot applicable | not applicablenot applicable |
| Expenditures of leisure and culture as percentage of household budget | ✓ | not applicablenot applicable | not applicablenot applicable | not applicablenot applicable | not applicablenot applicable | not applicablenot applicable | not applicablenot applicable |
| Growth in the cultural economy | not applicablenot applicable | not applicablenot applicable | not applicablenot applicable | not applicablenot applicable | ✓ | not applicablenot applicable | not applicablenot applicable |
| People working in arts and culture | not applicablenot applicable | not applicablenot applicable | not applicablenot applicable | not applicablenot applicable | ✓ | not applicablenot applicable | not applicablenot applicable |
| Visits to the outdoors | not applicablenot applicable | not applicablenot applicable | not applicablenot applicable | not applicablenot applicable | ✓ | ✓ | ✓ |
| Notes: CIW: Canadian Index of Well-being; OECD: Organisation for Economic Co-operation and Development; SDG: Sustainable Development Goal. | |||||||
| Time Use | CIW | OECD | SDGs Canada | New Zealand | Scotland | Wales | United Kingdom |
|---|---|---|---|---|---|---|---|
| Aged 25 to 64 working more than 50 hours at main job | ✓ | ✓ | not applicable | not applicable | not applicable | not applicable | not applicable |
| Labour force working under 30 hours (not by choice) | ✓ | not applicable | not applicable | not applicable | not applicable | not applicable | not applicable |
| Average actual weekly hours worked | not applicable | not applicable | not applicable | ✓ | not applicable | not applicable | ✓ |
| Percentage of labour force with regular weekday work hours | ✓ | not applicable | not applicable | not applicable | not applicable | not applicable | not applicable |
| Percentage with flexible work hours | ✓ | not applicable | not applicable | not applicable | not applicable | not applicable | not applicable |
| Percentage of people participating in sporting activities three or more times a week | not applicable | not applicable | not applicable | not applicable | not applicable | ✓ | ✓ |
| Commute time | ✓ | not applicable | not applicable | not applicable | not applicable | ✓ | not applicable |
| Percentage with 7 to 9 hours of quality sleep | ✓ | not applicable | not applicable | not applicable | not applicable | not applicable | not applicable |
| Average daily time with friends | ✓ | not applicable | not applicable | not applicable | not applicable | not applicable | not applicable |
| Percentage of unpaid or volunteer work | ✓ | ✓ | not applicable | not applicable | not applicable | not applicable | not applicable |
| Proportion of time spent on unpaid domestic and care work | not applicable | not applicable | ✓ | ✓ | not applicable | not applicable | not applicable |
| Aged 15 to 64 with high time pressure | ✓ | not applicable | not applicable | not applicable | not applicable | not applicable | not applicable |
| Satisfaction with work–life balance | not applicable | not applicable | not applicable | ✓ | not applicable | ✓ | not applicable |
| Notes: CIW: Canadian Index of Well-being; OECD: Organisation for Economic Co-operation and Development; SDG: Sustainable Development Goal. | |||||||
| Community | CIW | OECD | SDGs Canada | New Zealand | Scotland | Wales | United Kingdom |
|---|---|---|---|---|---|---|---|
| Sense of belonging to community | ✓ | not applicable | not applicable | not applicable | not applicable | ✓ | ✓ |
| Percentage with 5 or more close friends | ✓ | not applicable | not applicable | not applicable | not applicable | not applicable | not applicable |
| Social network support | not applicable | ✓ | not applicable | ✓ | not applicable | not applicable | not applicable |
| Percentage of adults who agree that, in their neighbourhood, there are places to meet up and socialize (places to interact) | not applicable | not applicable | not applicable | not applicable | ✓ | not applicable | not applicable |
| Percentage of adults who felt lonely at least some of the time | not applicable | not applicable | not applicable | ✓ | ✓ | not applicable | not applicable |
| Percentage of adults who rate their neighbourhood as a very good place to live | not applicable | not applicable | not applicable | not applicable | ✓ | not applicable | not applicable |
| Feel safe walking alone / after dark | ✓ | ✓ | ✓ | ✓ | not applicable | not applicable | ✓ |
| Perceptions of local crime rate | not applicable | not applicable | not applicable | not applicable | ✓ | not applicable | ✓ |
| Crime severity index | ✓ | not applicable | ✓ | not applicable | not applicable | not applicable | not applicable |
| Percentage of adults who have been the victim of one or more crimes | not applicable | not applicable | not applicable | not applicable | ✓ | not applicable | ✓ |
| Homicide rates | not applicable | ✓ | not applicable | ✓ | not applicable | ✓ | ✓ |
| Domestic violence, percentage of adults who were victims of family violence | not applicable | not applicable | not applicable | ✓ | not applicable | not applicable | not applicable |
| Workplace accident rate | not applicable | not applicable | not applicable | ✓ | not applicable | not applicable | not applicable |
| Incidence of certain types of crime: cybercrimes, homicides, hate crimes, sexual abuse before the age of 18, and physical, sexual, or psychological violence by current or previous partners, by offense | not applicable | not applicable | ✓ | not applicable | not applicable | not applicable | not applicable |
| Criminal court case completion time, by type | not applicable | not applicable | ✓ | not applicable | not applicable | not applicable | not applicable |
| Prison population, total and unsentenced | not applicable | not applicable | ✓ | not applicable | not applicable | ✓ | not applicable |
| Percentage of Canadians with a serious legal problem who were able to resolve the problem | not applicable | not applicable | ✓ | not applicable | not applicable | not applicable | not applicable |
| Percentage reporting discrimination | ✓ | not applicable | ✓ | ✓ | not applicable | not applicable | not applicable |
| Proportion of employees in management positions (including Board of Directors) who are from different groups, including women, by management level | not applicable | not applicable | ✓ | not applicable | not applicable | not applicable | not applicable |
| Percentage who trust most/many people | ✓ | ✓ | not applicable | ✓ | not applicable | not applicable | ✓ |
| Trust in the police | not applicable | ✓ | not applicable | not applicable | not applicable | ✓ | ✓ |
| Percentage of population who reported having trust in public institutions, by type of institution | ✓ | ✓ | ✓ | ✓ | not applicable | not applicable | not applicable |
| Percentage of the population who use emergency shelters | not applicable | not applicable | ✓ | not applicable | not applicable | not applicable | not applicable |
| Percentage of Canadians living within 500 meters of a public transport stop | not applicable | not applicable | ✓ | not applicable | not applicable | not applicable | not applicable |
| Ability to express identity | not applicable | not applicable | not applicable | ✓ | not applicable | ✓ | not applicable |
| Community ownership, number of assets in community ownership | not applicable | not applicable | not applicable | not applicable | ✓ | not applicable | not applicable |
| Social Capital Index (resource of socioal networks, community cohesion, social participation, trust and empowerment) | not applicable | not applicable | not applicable | not applicable | ✓ | not applicable | not applicable |
| Entrepreneurial activity | not applicable | not applicable | not applicable | not applicable | ✓ | not applicable | not applicable |
| Quality of public services | not applicable | not applicable | not applicable | not applicable | ✓ | not applicable | not applicable |
| Acess to justice | not applicable | not applicable | not applicable | not applicable | ✓ | not applicable | not applicable |
| People who are satisfied with the local area and place to live | not applicable | not applicable | not applicable | not applicable | not applicable | ✓ | ✓ |
| People who feel lonely and isolated from others | not applicable | not applicable | not applicable | not applicable | not applicable | ✓ | ✓ |
| Notes: CIW: Canadian Index of Well-being; OECD: Organisation for Economic Co-operation and Development; SDG: Sustainable Development Goal. | |||||||
| Economic Capital | CIW | OECD | SDGs Canada | New Zealand | Scotland | Wales | United Kingdom |
|---|---|---|---|---|---|---|---|
| Produced fixed assets | not applicable | ✓ | not applicable | ✓ | not applicable | not applicable | not applicable |
| Gross fixed capital formation | not applicable | ✓ | not applicable | not applicable | not applicable | not applicable | not applicable |
| Financial net worth of the total economy | not applicable | ✓ | not applicable | not applicable | not applicable | ✓ | not applicable |
| Intellectual property assets | not applicable | ✓ | not applicable | ✓ | not applicable | not applicable | not applicable |
| Number of intellectual property filings (patents, trademarks, industrial designs, and copyrights) granted and registered annually | not applicable | not applicable | ✓ | not applicable | not applicable | not applicable | not applicable |
| Number of open datasets published by the Government of Canada | not applicable | not applicable | ✓ | not applicable | not applicable | not applicable | not applicable |
| Investment in research and development | not applicable | ✓ | not applicable | ✓ | ✓ | ✓ | not applicable |
| Adjusted financial net worth of general government | not applicable | ✓ | not applicable | not applicable | not applicable | not applicable | not applicable |
| Leverage of the banking sector | not applicable | ✓ | not applicable | not applicable | not applicable | not applicable | not applicable |
| Total official support for sustainable development, in Canadian dollars, by type | not applicable | not applicable | ✓ | not applicable | not applicable | not applicable | not applicable |
| Multifactor productivity growth / productivity growth | not applicable | not applicable | not applicable | ✓ | ✓ | not applicable | not applicable |
| Net international investment position as a percentage of gross domestic product | not applicable | not applicable | not applicable | ✓ | not applicable | not applicable | not applicable |
| International exporting | not applicable | not applicable | not applicable | not applicable | ✓ | not applicable | not applicable |
| Number of businesses | not applicable | not applicable | not applicable | not applicable | ✓ | not applicable | not applicable |
| Percentage of businesses which are high growth | not applicable | not applicable | not applicable | not applicable | ✓ | not applicable | not applicable |
| Proportion of businesses that were innovation active | not applicable | not applicable | not applicable | not applicable | ✓ | not applicable | not applicable |
| Real net national disposable income per head | not applicable | not applicable | not applicable | not applicable | not applicable | ✓ | ✓ |
| Public sector net debt as a percentage of gross domestic product | not applicable | not applicable | not applicable | not applicable | not applicable | not applicable | ✓ |
| Inflation rate (measured by the government's measure) | not applicable | not applicable | not applicable | not applicable | not applicable | not applicable | ✓ |
| Notes: CIW: Canadian Index of Well-being; OECD: Organisation for Economic Co-operation and Development; SDG: Sustainable Development Goal. | |||||||
| Environment | CIW | OECD | SDGs Canada | New Zealand | Scotland | Wales | United Kingdom |
|---|---|---|---|---|---|---|---|
| Index of Agri–Environment Sustainability for water, soil, air and biodiversity | not applicable | not applicable | ✓ | not applicable | not applicable | not applicable | not applicable |
| Ecological footprint | ✓ | not applicable | ✓ | not applicable | ✓ | ✓ | ✓ |
| Megatonnes of carbon dioxide (CO2) per year | ✓ | ✓ | not applicable | ✓ | not applicable | ✓ | not applicable |
| Ground level ozone | ✓ | not applicable | not applicable | not applicable | ✓ | not applicable | not applicable |
| GHG emissions (from production) | not applicable | ✓ | ✓ | not applicable | not applicable | ✓ | ✓ |
| Non-GHG emitting energy share, final energy consumption and electricity generation | not applicable | not applicable | ✓ | not applicable | not applicable | not applicable | not applicable |
| Carbon stored in forest biomass | not applicable | not applicable | not applicable | ✓ | not applicable | not applicable | not applicable |
| Air quality | not applicable | ✓ | not applicable | ✓ | not applicable | ✓ | not applicable |
| Levels of nitrogen dioxide (NO2) pollution in the air | not applicable | not applicable | not applicable | not applicable | not applicable | ✓ | not applicable |
| Population exposure to outdoor air pollution by fine particulate matter (PM2.5) | not applicable | ✓ | not applicable | not applicable | not applicable | not applicable | not applicable |
| Percentage of Canadians living in areas where the Canadian Ambient Air Quality Standards are met | not applicable | not applicable | ✓ | not applicable | not applicable | not applicable | not applicable |
| Proportion of new light duty vehicle sales that are zero-emission vehicles | not applicable | not applicable | ✓ | not applicable | not applicable | not applicable | not applicable |
| Emissions of GHGs | not applicable | not applicable | not applicable | not applicable | not applicable | ✓ | not applicable |
| Satisfaction with water quality | not applicable | ✓ | not applicable | not applicable | not applicable | ✓ | not applicable |
| Renewable fresh water resources | not applicable | ✓ | not applicable | not applicable | ✓ | not applicable | not applicable |
| Percentage of people served with drinking water that met all standards | not applicable | not applicable | not applicable | ✓ | not applicable | not applicable | not applicable |
| Water quality (safe to swim) | not applicable | not applicable | not applicable | ✓ | not applicable | ✓ | ✓ |
| Average daily use of residential potable water, per capita | not applicable | not applicable | ✓ | not applicable | not applicable | not applicable | not applicable |
| Number of boil water advisories and long-term drinking water advisories affecting First Nations water systems, by type | not applicable | not applicable | ✓ | not applicable | not applicable | not applicable | not applicable |
| Adverse environmental effects of climate change, by type (temperature, precipitation, sea ice and snow cover) | not applicable | not applicable | ✓ | not applicable | not applicable | not applicable | not applicable |
| Primary energy production | ✓ | not applicable | not applicable | not applicable | not applicable | ✓ | not applicable |
| Energy consumption and annual energy savings resulting from adoption of energy efficiency codes, standards and practises | not applicable | not applicable | ✓ | not applicable | not applicable | not applicable | ✓ |
| Number of renewable energy projects in remote communities and remote industrial sites | not applicable | not applicable | ✓ | not applicable | not applicable | not applicable | not applicable |
| Renewable energy as a percentage of total primary energy supply | not applicable | not applicable | not applicable | ✓ | ✓ | not applicable | not applicable |
| Dwellings with adequate energy performance | not applicable | not applicable | not applicable | not applicable | not applicable | ✓ | not applicable |
| Residental energy use | ✓ | not applicable | not applicable | not applicable | not applicable | not applicable | not applicable |
| Viable Metal Reserves Index | ✓ | not applicable | not applicable | not applicable | not applicable | not applicable | not applicable |
| Total farm land (hectares) | ✓ | not applicable | ✓ | not applicable | not applicable | not applicable | not applicable |
| Canada's protected and conserved terrestrial areas | not applicable | not applicable | ✓ | not applicable | ✓ | not applicable | not applicable |
| Forest area | not applicable | ✓ | ✓ | not applicable | not applicable | not applicable | not applicable |
| Forest area under an independently verified forest management certification scheme | not applicable | not applicable | ✓ | not applicable | not applicable | not applicable | not applicable |
| Annual water yield | ✓ | not applicable | not applicable | not applicable | not applicable | not applicable | not applicable |
| Freshwater abstractions | not applicable | ✓ | not applicable | not applicable | not applicable | ✓ | ✓ |
| Canada's protected and conserved marine areas | not applicable | not applicable | ✓ | not applicable | not applicable | not applicable | not applicable |
| Status of major fish stocks | not applicable | not applicable | ✓ | not applicable | ✓ | not applicable | not applicable |
| Threatened birds | not applicable | ✓ | not applicable | not applicable | ✓ | not applicable | not applicable |
| Habitat area retained, managed, and restored under the North American Waterfowl Management Plan | not applicable | not applicable | ✓ | not applicable | not applicable | not applicable | not applicable |
| Threatened mammals | not applicable | ✓ | not applicable | not applicable | not applicable | not applicable | not applicable |
| Threatened vascular plants | not applicable | ✓ | not applicable | not applicable | not applicable | not applicable | not applicable |
| Status of wild species | not applicable | not applicable | ✓ | ✓ | not applicable | not applicable | not applicable |
| Canadian species index | not applicable | not applicable | ✓ | not applicable | not applicable | not applicable | not applicable |
| Total amount per capita of waste sent for disposal, by type of treatment | not applicable | not applicable | ✓ | ✓ | ✓ | not applicable | not applicable |
| Acess to the natural environment (park or green space) | not applicable | not applicable | not applicable | ✓ | ✓ | not applicable | not applicable |
| Perceived environmental quality | not applicable | not applicable | not applicable | ✓ | not applicable | ✓ | not applicable |
| Sustainable food production, percentage of tested sites within targets for at least six of the seven types of soil test | not applicable | not applicable | not applicable | ✓ | not applicable | not applicable | not applicable |
| Natural Capital Asset Index | not applicable | not applicable | not applicable | not applicable | ✓ | not applicable | not applicable |
| Concentration of carbon and organic matter in soil | not applicable | not applicable | not applicable | not applicable | not applicable | ✓ | not applicable |
| Household waste recycled | not applicable | not applicable | not applicable | not applicable | not applicable | not applicable | ✓ |
| Notes: CIW: Canadian Index of Well-being; GHG: greenhouse gas; OECD: Organisation for Economic Co-operation and Development; SDG: Sustainable Development Goal. | |||||||
| Democratic Engagement - Instutitions | CIW | OECD | SDGs Canada | New Zealand | Scotland | Wales | United Kingdom |
|---|---|---|---|---|---|---|---|
| Voter turnout | ✓ | ✓ | not applicable | ✓ | not applicable | ✓ | ✓ |
| Ratio of registered to eligible voters | ✓ | not applicable | not applicable | not applicable | not applicable | ✓ | not applicable |
| Gap between older/younger voters | ✓ | not applicable | not applicable | not applicable | not applicable | not applicable | not applicable |
| Percentage of women in federal Parliament | ✓ | not applicable | not applicable | not applicable | not applicable | not applicable | not applicable |
| Percentage of seats held by different groups, including women, in national, provincial, territorial and local (municipal and First Nations Band Councils) governments | not applicable | not applicable | ✓ | not applicable | not applicable | not applicable | not applicable |
| Percentage of applications and appointments for federally appointed judges from different groups, including women | not applicable | not applicable | ✓ | not applicable | not applicable | not applicable | not applicable |
| Member of Parliament budgets for local communication | ✓ | not applicable | not applicable | not applicable | not applicable | not applicable | not applicable |
| Percentage who volunteer for political group | ✓ | not applicable | not applicable | not applicable | not applicable | ✓ | not applicable |
| Percentage who are happy with democracy in Canada | ✓ | not applicable | not applicable | not applicable | not applicable | not applicable | not applicable |
| Having a say in what government does | not applicable | ✓ | not applicable | not applicable | ✓ | ✓ | ✓ |
| Government stakeholder engagement when developing primary laws and subordinate regulations | not applicable | ✓ | not applicable | not applicable | not applicable | not applicable | not applicable |
| Perceived corruption | not applicable | not applicable | not applicable | ✓ | not applicable | not applicable | not applicable |
| Notes: CIW: Canadian Index of Well-being; OECD: Organisation for Economic Co-operation and Development; SDG: Sustainable Development Goal. | |||||||
Appendix B: Selected government of Canada well-being frameworks
Gender Results Framework (Government of Canada)
Introduced in Budget 2018, the Gender Results Framework (GRF) (Status of Women Canada 2020) represents the Government of Canada’s vision for gender equality, highlighting the key issues that matter most. It is a whole-of government tool designed to track how Canada is currently performing; define what is needed to achieve greater equality and determine how progress will be measured going forward.
Under this framework, the federal government has identified six key areas where change is required to advance gender equality:
- Education and skills development
- Economic participation and prosperity
- Leadership and democratic participation
- Gender-based violence and access to justice
- Poverty reduction, health and well-being
- Gender equality around the world
Youth Policy (Government of Canada)
Canada’s first-ever youth policy (Government of Canada 2020) reflects the values and priorities of young Canadians, gives young people a voice in matters important to them, and creates more opportunities for young people to build a stronger and more inclusive Canada. Canada’s youth policy represents a whole-of-government approach aimed at improving youth outcomes and involving young people in federal decision-making.
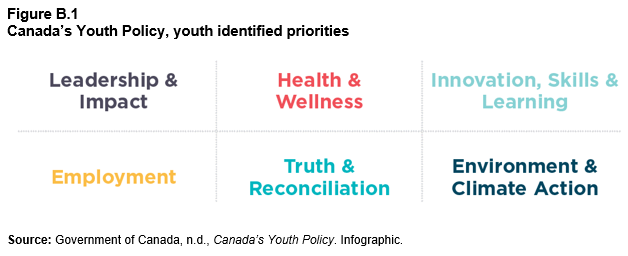
Description for Figure B.1
The title of Figure B.1 is “Canada’s Youth Policy, youth identified priorities.”
Figure B.1 presents the six following priorities: “Leadership & Impact,” “Health & Wellness,” “Innovation, Skills & Learning,” “Employment,” “Truth & Reconciliation,” and “Environment & Climate Action.”
Each one of the priorities listed is shown a different colour. The background of the figure is white. The three first priorities listed appear on the top row and the three last, on the bottom row. The top and bottom rows are separated by a horizontal dotted grey line, and each priority is separated from the other ones by a vertical dotted grey line.
The source for Figure B.1 is as follows:
Source: Government of Canada, n.d., Canada’s Youth Policy. Infographic.
Community Well-being Index—Indigenous Services Canada
Indigenous Services Canada is home to the Community Well-being (CWB) Index (Government of Canada 2019b), which was developed to help measure the quality of life of First Nations and Inuit communities in Canada relative to other communities and over time. This tool uses Statistics Canada's Census of Population data to produce 'well-being' scores for individual communities based on four indicators:
- Education (High School Plus; University);
- Labour Force (Participation, Employment);
- Income (Total per Capita); and,
- Housing (Quantity: defined on the basis of overcrowding; Quality: defined based on the need for major repairs).
Results are available in the publication Aboriginal Demographics and Well-Being (Aboriginal Affairs and Northern Development Canada 2013).
Veterans Well-being Act
Canada’s Veterans Well-being Act (2005) recognizes and fulfils the obligation of the people and Government of Canada to show just and due appreciation to members and veterans for their service to Canada. This obligation includes providing services, assistance and compensation to members and veterans who have been injured or have died as a result of military service and extends to their spouses or common-law partners or survivors and orphans. Topics covered by the Act include the following:
- Career Transition Services;
- Education and Training Benefits;
- Rehabilitation Services, Vocational Assistance and Financial Benefits;
- Critical Injury, Pain and Suffering, Death and Detention;
- Caregiver Recognition Benefits;
- Health and Retirement Benefits;
- Transition to Civilian Life.
Canadian Forces Well-being Framework (National Defence and Canadian Armed Forces, Veterans Affairs Canada)
The Department of National Defence and Canadian Forces has also developed a Well-being Framework (Government of Canada 2019c) which comprises a list of ‘Dos’ (as opposed to ‘Do Nots’) for transitioning from military to civilian life. The model of well-being adopted by the Canadian Armed Forces and Veterans Affairs Canada considers how a person is doing in seven domains:
- Employment or other main activity;
- Finances;
- Health;
- Life skills and preparedness;
- Social integration;
- Housing/physical environment; and
- Cultural and social environment.
Appendix C: Other selected well-being frameworks
Canadian Index for Measuring Integration
The data-driven Canadian Index for Measuring Integration (CIMI) (2020) is used to inform policy, service and program delivery as it relates to immigrant integration in Canada. The CIMI assesses gaps in well-being between immigrants and the Canadian-born population by examining four dimensions of immigrant integration: (1) economic; (2) social; (3) civic and democratic participation; (4) health.
The key objective of the CIMI is to provide a credible framework for ongoing assessment of the state of immigrant integration in Canada. The CIMI as a measurement tool fills an existing knowledge gap by evaluating the performance of immigrants compared to the Canadian-born population. Changes and trends overtime—as of 1991—are assessed for all 10 provinces and 35 cities (census metropolitan areas) across the country.
The selection of indicators included in the CIMI is guided by both conceptual and methodological considerations based on a literature review and recommendations by an Expert Advisory Committee. The CIMI is powered by the Association for Canadian Studies, the Canadian Institute for Identities and Migration and Immigration, Refugees and Citizenship Canada.
Canadian Index of Child and Youth Well-being
UNICEF’s Canadian Index of Child and Youth Well-being (UNICEF Canada 2019) was developed in 2013/2014 and is based on the organizations’ social accountability efforts, developed in collaboration with the Canadian Index of Wellbeing, a pan-Canadian Advisory Reference Group and children and youth themselves. The Index explicitly recognizes the following: children and youth have distinct needs from adults including education; deprivations in childhood such as food insecurity can have more severe and lasting impacts on children than on adults; and children experience life in Canada differently, even though they have the same human rights as adults—for instance, children report significantly lower life satisfaction than adults.
The Canadian Index of Child and Youth Well-being is organized around a vision of a Canada where:
- Every child has adequate food, water and shelter and opportunity.
- Every child is—and feels—safe and secure.
- Every child is physically, mentally and spiritually healthy.
- Every child enjoys equitable opportunities.
- Every child feels happy and inspired.
- Every child has access to education that supports their full potential.
- Every child is free to play, laugh and wonder.
- Every child is—and feels—free to dream.
- Every child has a strong sense of who they are, where they come from and who they want to be.
- Every child feels heard and empowered.

Description for Figure C.1
The title of Figure C.1 is “Canadian Index of Child and Youth Well-being, UNICEF Canada and ONE youth.”
The background of Figure C.1 is white. On it there is a drawing representing the silhouette of a tree in light grey colour. There are eight indices on the end of the tree branches, and one index on the tree trunk, right before the branches fan out. Each of the nine indices is in a rectangle of a different colour. The names of the indices are shown in white.
Above each index is an icon representing it. The icons are outlined in the same colour as the background colour of the index they represent and the background of the icons is white. The icons are circular and delineated with a pale grey line.
The indices and their respective icons are as follows, starting with the index on the tree trunk and going to the left: “We are happy and respected” (front view of the upper-body of a child with raised arms; the only facial feature shown is its smiling mouth); “We are connected to our environment” (side view of a child sitting, with its right arm raised, flexed and resting on its knee; its right hand is holding a flower); “We are secure” (front view of the upper body of a child with its arms flexed over its chest, its hands closed with both thumbs up; the only facial feature shown is its smiling mouth); “We belong” (front view of the upper body of an adult and of a child, the adult is holding the child, the only facial feature of both the child and adult is their smiling mouth); “We are learning” (front view of upper body of a child above a horizontal line, representing the surface of a desk; the child has its left arm raised; the only shown facial feature of the child is its smiling face); “We are healthy” (side view of the upper body of a child in a running position, the only facial feature shown is its smiling mouth); “We are free to play” (side view of a child sitting on a swing and swinging; the only facial feature shown is its smiling mouth); “We are participating” (front view of upper bodies of three children of different ages, arms over each other’s shoulders; the child at the left has its right arm free raised, and the child at the right has its arm free and away from its body; the only facial feature shown is their smiling mouths); “We are protected” (side view of a child under a blanket, its head, left arm and shoulder showing; it is resting on its right forearm and the only facial feature shown is its smiling mouth).
The source for Figure C.1 is as follows:
Source: UNICEF Canada and ONE Youth, n.d., Where Does Canada Stand? The Canadian Index of Child and Youth Well-being: 2019 Baseline Report.
Canadian Family Well-Being Index
The Vanier Institute of the Family (2020b) is working with researchers from diverse disciplines and backgrounds to develop the Canadian Family Well-Being Index, a multi-faceted measure of well-being that will provide unique insight into the many components of well-being through a family lens.
The Index builds upon established Canadian indices that measure various aspects of communities, including the experiences of Indigenous peoples, refugees, and children and youth in Canada.
The development of the Index started in September 2019 and is continuing in 2020.
Appendix D: Criteria for quality indicators
To ensure the overall quality of indicators, Guèvremont, Findlay and Cohen (2019) applied the Statistics Canada quality framework to guide the selection of early childhood criteria. Building on this work, the following criteria are based on the Statistics Canada Quality Assurance Framework—Statistical Outputs to guide the selection of well-being indicators (Statistics Canada 2017a):
- Relevance: Relevance is defined as the degree to which statistical information meets the real needs of users, including information on subjects that are important to them, and in a format and within a time frame that meets their needs. For example, if well-being measures are to be used as monitor and evaluate policies, they must sensitive to policy changes.
- Accuracy and reliability: Accuracy is defined as the degree to which the information correctly describes the phenomena it was designed to measure. A valid indicator is free from bias or systematic error. Reliability refers to the degree to which the statistical information is consistent over time in terms of both multiple measurements of the same phenomenon and a series of measurements over time. These are critical criteria, for example, in cases where well-being indicators will be tracked over time to measure change and progress.
- Timeliness: Timeliness is defined as the delay between the reference point (or the end of the reference period) to which the indicator pertains and the date on which the information becomes available. Timeliness is less of a concern for well-being indicators that change slowly overtime (e.g., life expectancy) but important for those measures that maybe more sensitive to changing events (e.g., employment rate).
- Accessibility and clarity: Accessibility is defined as the ease with which the indicator can be identified, obtained and used. This criteria also relates to the cost of obtaining or creating the indicator. Indicators derived from existing administrative data are less costly than indicators from survey data that require data collection. Clarity refers to the degree to which metadata and other information are provided so that users are able to locate and select products or services that correspond to their needs. These elements are critical in guiding the creation and dissemination of well-being measures.
- Coherence and comparability: Coherence is defined as the degree to which the indicator can be successfully brought together with other statistical information within a broad analytic framework over time. This dimension refers to the use of standard concepts, classifications, and target populations, which promote coherence. Comparability refers the extent to which differences over time or among sources can be attributed to changes in the true values of the statistics, and not to changes in definition or measurement. The use of standards to guide the disaggregation of well-being indicators will be critical to ensure the overall coherence and comparability of measures for example.
Appendix E: Data collection options at Statistics Canada
Statistics Canada has a long tradition of conducting surveys to collect the data needed to fulfill the Agency’s mandate to report on the country’s social, economic and environmental conditions. While surveys remain an important tool to collect the data we need, the Agency uses a range of approaches to collect and gather data to support the statistical programs. Many of the following methods may be relevant for the collection and creation of new well-being measures.
- Advances in survey-based data collection: Surveys are and will continue to be an important mode of data collection, particularly for subjective measures. Statistics Canada continues to advance the methodology and processes used for direct collection introducing different collection modes (i.e., online) and sampling approaches to improve timeliness and address issues related to respondent burden and lowering responses rates. Building on successes such as the Rapid Statistics program, the Agency is investigating and experimenting with new modes collection including the establishment of a new integrated data platform which will seek to unify data collection of similar content and/or target populations and support a range of collection options (i.e., probabilistic household panels, omnibus surveys). For example, probabilistic panels will be used recruit individuals willing to complete short surveys by electronic questionnaire and who could be contacted directly and cost-effectively by email or other leading-edge methods such as SMS or apps. These new advances will be critical in supporting the collection of subjective measures of well-being.
- Administrative data: Administrative data are information collected by government or private sector organizations as part of their ongoing operations (e.g., records of births and deaths, taxation records, immigration records). There are several advantages to using administrative data, including reduced respondent burden, timeliness, cost effective and coverage. To ensure that the data are fit for use, administrative data products are assessed against established quality criteria. Statistics Canada has a long history of repurposing data collected by other organizations and their use is guided by Statistics Canadas Policy on the Use of Administrative Data Obtained under the Statistics Act (Statistics Canada 2019b, 2016). Administrative data provide a cost-effective approach to generate new objective measures of well-being and given that they often represent a ‘census’ of events, can support the creation of disaggregated measures by either geography or population group.
- Data integration: Microdata linkage is an internationally recognized statistical method to integrate data by bringing together information about an entity from two or more sources to form a combined microdata file about that same entity (i.e., people, businesses). Statistics Canada routinely conducts microdata linkage to address data gaps, reduce respondent burden and create new data sources for indicator development and research. To support these activities, the Agency established the Social Data Linkage Environment (SDLE) to ensure that microdata linkages related to individuals are conducted using advanced statistical methods and in accordance with the Directive on Microdata Linkage to respect privacy and ensure confidentiality (Statistics Canada 2017b, c, d).
- Statistical modelling: Small area estimation is one example of the use of statistical modelling to address data gaps particularly to produce estimates for specified sub-populations or small areas when data do exist at that level or the sample size is so small that direct estimates are not reliable enough to be published. Examples of small areas include a geographical region (e.g., county, municipality, neighbourhood) or a small population group (e.g., ethnicity) or a population group within a geographic region (Hidiroglou, Beaumont and Yung 2019). These approaches could be considered to produce disaggregated estimates of well-being particularly where indicators are needed at lower levels of geography.
- Big data: Big data are defined as largely unstructured voluminous data generated as a result of regular monitoring or transactions. Statistics Canada has been using big data sources, including satellite images and scanner data, to estimate agriculture and economic measures currently estimated using direct collection methods (e.g., surveys). Big data sources, including those from social media, may be considered as potential sources to generate new experimental measures of well-being.
References
Aboriginal Affairs and Northern Development Canada. 2013. Aboriginal Demographics and Well-Being. 24 pages. Available at: https://www.aadnc-aandc.gc.ca/DAM/DAM-INTER-HQ-AI/STAGING/texte-text/rs_re_pubs_demograph_wellbeing_PDF_1358863272403_eng.pdf (accessed October 16, 2020).
Ambrey, C., and C. Fleming. 2014. “Public greenspace and life satisfaction in urban Australia.” Urban Studies. 51 (6): 1290–1321. https://journals.sagepub.com/doi/pdf/10.1177/0042098013494417.
Anderson, J., and L. Rainie. 2018. The Future of Well-Being in a Tech-Saturated World. Washington, D.C.: Internet & Technology, Pew Research Center. Available at: https://www.pewresearch.org/internet/2018/04/17/the-future-of-well-being-in-a-tech-saturated-world/ (accessed October 19, 2020).
Arim, R., and G. Schellenberg. 2019. An Assessment of Non-Probabilistic Online Survey Data: Comparing the Carrot Rewards Mobile App Survey to the Canadian Community Health Survey. Analytical Studies: Methods and References, no. 021. Statistics Canada Catalogue no. 11-633-X. Ottawa: Statistics Canada.
Barrington-Leigh, C., and A. Escande. 2018. “Measuring Progress and Well-Being: A Comparative Review of Indicators.” Social Indicators Research 135 (3): 893–925. https://doi.org/10.1007/s11205-016-1505-0.
Bonikowska, A., J.F. Helliwell, F. Hou, and G. Schellenberg. 2014. “An Assessment of Life Satisfaction Responses on Recent Statistics Canada Surveys.” Social Indicators Research. 118 (2): 617–643.
Bowlby, G. 2019. “Implications of populism for National Statistical Organizations.” Draft Paper prepared for the Certificate Program in Public Sector Leadership and Governance. Ottawa: Centre on Public Management and Policy, University of Ottawa.
Burnett, R.T., H. Chen, M. Szyzkowicz, N. Fann, B. Hubbell, C.A. Pope II, J.S. Apte, M. Brauer, A. Cohen, S. Weichenthal, J. Coggins, Q. Di, B. Brunekreef, J. Frostad, S.S. Lim, H. Kan, K.D. Walker, G.D. Thurston, R.B. Hayes, C.C. Lim, M.C. Turner, M. Jerrett, D. Krewski, S.M. Gapstur, W.R. Diver, B. Ostro, D. Goldberg, D.L. Crouse, R.V. Martin, P. Peters, L. Pinault, M. Tjepkema, A. van Donkelaar, P.J. Villeneuve, A.B. Miller, P. Yin, M. Zhou, L. Wang, N.A.H. Janssen, M. Marra, R.W. Atkinson, H. Tsang, T. Quoc Thach, J.B. Cannon, R.T. Allen, J.E. Hart, F. Laden, G. Cesaroni, F. Forastiere, G. Weinmayr, A. Jaensch, A. Nagel, H. Concin, and J.V. Spadaro. 2018. “Global estimates of mortality associated with long-term exposure to outdoor fine particulate matter.” Proceedings of the National Academy of Sciences of the United States of America 115 (38): 9592–9597.
Bush, E., and D.S. Lemmen, eds. 2019. Canada’s Changing Climate Report. Government of Canada. 444 p. Available at: https://www.nrcan.gc.ca/maps-tools-publications/publications/climate-change-publications/canada-changing-climate-reports/canadas-changing-climate-report/21177 (accessed October 19, 2020).
Canada Mortgage and Housing Corporation. 2018. National Housing Strategy: Priority areas for action. Available at: https://www.cmhc-schl.gc.ca/en/nhs/guidepage-strategy/priority-areas-for-action (accessed September 30, 2020).
Canadian Index for Measuring Integration. 2020. Available at: https://www.integrationindex.ca (accessed October 1, 2020).
Canadian Index of Well-Being. 2019. Background information on the Canadian Index of Well-being. Waterloo: University of Waterloo, Faculty of Applied Health Sciences.
Chen, W.-H., and T. Mehdi. 2018. Assessing Job Quality in Canada: A Multidimensional Approach.” Analytical Studies Branch Research Paper Series, no. 412. Statistics Canada Catalogue no. 11F0019M. Ottawa: Statistics Canada.
Christidis, T., A.C. Erickson, A.J. Pappi, D.L. Crouse, L.L. Pinault, S.A. Weichenthal, J.R. Brook, A. van Donkelaar, P. Hystad, R.V. Martin, M. Tjepkema, R.T. Burnett, and M. Brauer. 2019. “Low concentrations of fine particle air pollution and mortality in the Canadian Community Health Survey cohort.” Environmental Health 18:84.
Colley, R.C., T. Christidis, I. Michaud, J. Tjepkema, and N.A. Ross. 2019. “The association between walkable neighbourhoods and physical activity across the lifespan.” Health Reports 30 (9): 3–13.
Cotter, A. 2016. “Canadians' perceptions of neighbourhood disorder, 2014.” Spotlight on Canadians: Results from the General Social Survey, no. 2016002. Statistics Canada Catalogue no. 89-652-X. Available at: https://www150.statcan.gc.ca/n1/pub/89-652-x/89-652-x2016002-eng.htm (accessed September 30, 2020).
Cox, M. 2017. Understanding the Global Rise of Populism. LSE IDEAS Strategic Update (February). London: London School of Economics and Political Science. Available at: https://www.lse.ac.uk/ideas/Assets/Documents/updates/LSE-IDEAS-Understanding-Global-Rise-of-Populism.pdf (accessed October 16, 2020).
Crouse, D.L., L. Pinault, A. Balram, P. Hystad, P.A. Peters, H. Chen, A. van Donkelaar, R.V. Martin, R. Menard, A. Robichaud, and P. Villeneuve. 2017. “Urban greenness and mortality in Canada’s largest cities: a national cohort study.” The Lancet. Planetary Health 1 (7): e289–e297.
Crouse, D.L., A. Balram, P. Hystad, L. Pinault, M. van den Bosch, H. Chen, D. Rainham, E.M. Thomson, C.H. Close, A. van Donkelaar, R.V. Martin, R. Menard, A. Robichaud, and P.J. Villeneuve. 2018. “Associations between living near water and risk of mortality among urban Canadians.” Environmental Health Perspectives 126 (7): 077008-1–077008-9.
Everett, G. 2015. “Measuring National Well‐Being: A UK Perspective”. Review of Income and Wealth 61 (1): 34–42.
Exton, C., and M. Shinwell. 2018. Policy use of well-being metrics: Describing countries’ experiences. OECD Statistics Working Papers, no. 2018/07. Paris: OECD Publishing. https://dx.doi.org/10.1787/d98eb8ed-en.
Frenette, M. and K. Frank. 2020. Automation and Job Transformation in Canada: Who’s at Risk? Analytical Studies Branch Research Paper, no. 448. Statistics Canada Catalogue no. 11F0019M. Ottawa: Statistics Canada.
Frijters, P., A.E. Clark, C. Krekel, and R. Layard. 2019. A Happy Choice: Well-being as the Goal of Government. IZA Discussion Paper, no. 12720 (October). Bonn: The Institute for the Study of Labor.
Fujiwara D., and G. MacKerron. 2015. Cultural activities, art forms and wellbeing. Arts Council England. 38 pages. Available at: https://www.artscouncil.org.uk/sites/default/files/download-file/Cultural_activities_artforms_and_wellbeing.pdf (accessed October 30, 2020).
The Global Council for Happiness and Wellbeing. 2019. Global Happiness and Wellbeing Policy Report 2019. New York: Sustainable Development Solutions Network. Available at: https://s3.amazonaws.com/ghwbpr-2019/UAE/GHWPR19.pdf (accessed September 30, 2020).
The Global Goals for Sustainable Development. 2018. “169 Targets for a Better World,” News. January 17, 2018. Available at: https://www.globalboals.org/news/169-targets-for-a-better-world (accessed October 16, 2020).
Gluckman, Sir P., and K. Allen. 2018. Understanding well-being in the context of rapid digital and associated transformations: Implications for research, policy and measurement. The International Network for Government Science Advice. Available at: https://www.ingsa.org/wp-content/uploads/2018/10/INGSA-Digital-Wellbeing-Sept18.pdf (accessed October 26, 2020).
Government of Canada. n.d. Canada’s Youth Policy. Infographic. Available at: https://www.canada.ca/content/dam/y-j/documents/youth_policy_one_pager_EN.pdf (accessed October 6, 2020).
Government of Canada. 2020. Canada’s Youth Policy. Last updated April 15, 2020. Available at: https://www.canada.ca/en/youth/programs/policy.html (accessed October 15, 2020).
Government of Canada. 2019a. Towards Canada’s 2030 Agenda National Strategy. Last updated July 15, 2019. Available at: https://www.canada.ca/en/employment-social-development/programs/agenda-2030/national-strategy.html (accessed October 16, 2020).
Government of Canada. 2019b. The Community Well-Being index. Last updated May 24, 2019. Available at: https://www.aadnc-aandc.gc.ca/eng/1100100016579/1100100016580 (accessed October 16, 2020).
Government of Canada. 2019c. Well-being Framework. Last updated November 6, 2019. Available at: https://www.canada.ca/en/department-national-defence/corporate/reports-publications/transition-guide/well-being-framework.html (accessed October 16, 2020).
Government of Canada. 2018. The 2030 Agenda for Sustainable Development. Last updated December 20, 2018. Available at: https://www.international.gc.ca/world-monde/issues_development-enjeux_developpement/priorities-priorites/agenda-programme.aspx?lang=eng (accessed December 20, 2018).
Government of New Zealand. 2019. The Wellbeing Budget 2019. Available at: https://treasury.govt.nz/publications/wellbeing-budget/wellbeing-budget-2019 (accessed October 30, 2020).
Government of New Zealand. The Treasury. n.d. The Living Standards Framework Dashboard: Our country, Our future and Our people. Available at: https://lsfdashboard.treasury.govt.nz/wellbeing/ (accessed September 30, 2020).
Guèvremont, A., L. Findlay, and D. Kohen. 2019. Early Learning and Child Care (ELCC) Indicators: What do we know and what do we need to collect? Internal document. Statistics Canada, June 2019.
Hayo, B., and W. Seifert. 2003. “Subjective economic well-being in Eastern Europe.” Journal of Economic Psychology 24 (3): 329–348.
Helliwell, J.F. 2019a. Measuring and Using Happiness to Support Public Policies. NBER Working Paper Series, no. 26529. Cambridge Massachussets: National Bureau of Economic Research.
Helliwell, J.F. 2019b. “Determinants of Well-Being and Their Implications for Health Care.” Annals of Nutrition & Metabolism 74 (suppl 2): 8–14.
Helliwell, J.F. 2018. “What’s Special about Happiness as a Social Indicator?” Social Indicators Research 135 (3): 965–968.
Helliwell, J.F., H. Huang, and S. Wang. 2017. “Social Foundations of World Happiness.” In World Happiness Report 2017, ed. J.F. Helliwell, R. Layard and J. Sachs, chapter 2, p. 9–47. New York: Sustainable Development Solutions Network.
Helliwell, J.F., H. Shiplett, and C. Barrington-Leigh. 2018. How Happy Are Your Neighbours? Variation in Life Satisfaction among 1200 Canadian Neighbourhoods and Communities. NBER Working Paper Series, no. 24592. Cambridge, Massachusetts: National Bureau of Economic Research.
Helliwell, J.F., and S. Wang. 2012. “The State of World Happiness.” In World Happiness Report 2012, ed. J.F. Helliwell, R. Layard and J. Sachs, chapter 2, p. 10–57. New York: UN Sustainable Development Solutions Network.
Henderson, S.B., M. Brauer, Y. MacNab, and S.M. Kennedy. 2011. “Three measures of forest fire smoke exposure and their associations with respiratory and cardiovascular health outcomes in a population-based cohort.” Environmental Health Perspectives 119 (9): 1266–1271.
Hicks P. 2011. Social Accounting: An integrated framework for Social Statistics. Internal report, Statistics Canada.
Hidiroglou, M.A., J.-F. Beaumont, and W. Yung. 2019. “Development of a small area estimation system at Statistics Canada.” Survey Methodology 45 (1). Statistics Canada Catalogue no. 12‑001-X. Available at: https://www150.statcan.gc.ca/n1/pub/12-001-x/2019001/article/00009-eng.htm (accessed October 19, 2020).
Jeon, S.-H., H. Lu and Y. Ostrovsky. 2019. Measuring the Gig Economy in Canada with Administrative Data. Analytical Studies Branch Research Paper Series, no. 437. Statistics Canada Catalogue no. 11F0019M. Ottawa: Statistics Canada.
Joyce, C. 2019. “Making the intangible tangible: Well-being valuation for public policy.” Presentation made at the Beyond GDP: International Experiences, Canada’s Option Workshop, Dalhousie University, Halifax, May 23–24.
Justin Trudeau, Prime Minister of Canada. 2019. Minister of Middle Class Prosperity and Associate Minister of Finance Mandate Letter. December 13. Available at: https://pm.gc.ca/en/mandate-letters/2019/12/13/minister-middle-class-prosperity-and-associate-minister-finance-mandate (accessed September 30, 2020).
Krekel, C., Ward, G., and de Neuve, J.-E. 2019. “Employee Well-being, Productivity, and Firm Performance: Evidence and Case Studies.” In Global Happiness and Well-being: Policy Report 2019, Chapter 5, p. 72–114. New York: Sustainable Development Solutions Network.
Kriesi, H., and T.S. Pappas. 2015. “Populism in Europe During Crisis: An Introduction.” In European Populism in the Shadow of the Great Recession, ed. H. Kriesi, and T.S. Pappas, chapter 1. Colchester, United Kingdom: ECPR Press.
Land, K.C., and A.C. Michalos. 2018. “Fifty Years After the Social Indicators Movement: Has the Promise Been Fulfilled?” Social Indicators Research 135 (3): 835–868.
Lemyre, X., J. Mader, and M. Ambard. 2018. Quantifying and Valuing the Wellbeing Impacts of Arts, Culture and Sports in Canada. Policy Research Group, Canadian Heritage. Available at: https://cudo.carleton.ca/system/files/dli_training/4330/wellbeing-impacts-arts-culture-and-sports-canada-final.pdf (accessed October 19, 2010).
Lu, C., G. Schellenberg and F. Hou. 2015. How’s Life in the City? Life Satisfaction across Census Metropolitan Areas and Economic Regions in Canada. Economic Insights, no. 46. Statistics Canada Catalogue no. 11-626-X. Ottawa: Statistics Canada.
Medeiros A.S., P. Wood, S.D. Wesche, M. Bakaic, and J.F. Peters. 2017. “Water security for northern peoples: review of threats to Arctic freshwater systems in Nunavut, Canada.” Regional Environmental Change 17:635–647.
Michalos, A., B. Smale, R. Labonté, N. Muhajarine, K. Scott, M. Guhn, A.M. Gadermann, B.D. Zumbo, A. Morgan, K. Moore, L. Swystun, B. Holden, H. Bernardin, B. Dunning, P. Grahan, A.-S. Brooker and I. Hyman. 2011. The Canadian Index of Well-being. Technical Report 1.0. Waterloo, Ontario: Canadian Index of Well-being and University of Waterloo.
Morissette, R. 2018. The Changing Characteristics of Canadian Jobs, 1981 to 2018. Economic Insights, no. 86. Statistics Canada Catalogue no. 11-626-X. Ottawa: Statistics Canada.
OECD (Organisation for Economic Co-operation and Development). n.d. OECD Better Life Initiative: Measuring Well-being and Progress. Available at: http://www.oecd.org/statistics/better-life-initiative.htm (accessed October 19, 2020).
OECD (Organisation for Economic Co-operation and Development). 2019. Putting Well-being Metrics into Policy Action. OECD Workshop, OECD Conference Centre, Paris, October 3 and 4, 2019. Available at: http://www.oecd.org/statistics/putting-well-being-metrics-into-policy-action.htm (accessed October 15, 2020).
OECD (Organisation for Economic Co-operation and Development). 2017. How's Life? 2017: Measuring Well-being. Paris: OECD Publishing. https://doi.org/10.1787/how_life-2017-e.
OECD (Organisation for Economic Co-operation and Development). 2013. OECD Guidelines on Measuring Subjective Well-being. Paris: OECD Publishing. https://doi.org/10.1787/9789264191655-en.
OECD (Organisation for Economic Co-operation and Development). 2011. Perspectives on Global Development 2012: Social Cohesion in a Shifting World. OECD Publishing, Paris, https://doi.org/10.1787/persp_glob_dev-2012-en.
OECD Better Life Index. n.d. How’s Life? OECD. Available at: http://www.oecdbetterlifeindex.org/ (accessed September 30, 2020).
OECDiLibrary. 2020. How’s Life? 2020: Measuring Well-being. Paris: OECD Publishing. https://doi.org/10.1787/9870c393-en.
Pappin, A.J., T. Christidis, L.L. Pinault, D.L. Crouse, J.R. Brook, A. Erickson, P. Hystad, C. Li, R.V. Martin, J. Meng, S. Weichenthal, A. van Donkelaar, M Tjepkema, M. Brauer, and R.T. Burnett. 2019. “Examining the shape of the association between low levels of fine particulate matter and mortality across three cycles of the Canadian Census Health and Environment Cohort.” Environmental Health Perspectives 127 (10): 107008-1–107008-12.
Pinault, L., A. van Donkelaar, and R.V. Martin. 2017. “Exposure to fine particulate matter air pollution in Canada.” Health Reports 28 (3): 9–16.
Pinault, L., M. Brauer, D.L. Crouse, S. Weichenthal, A. Erickson, A. van Donkelaar, R.V. Martin, S. Charbonneau, P. Hystad, J.R. Brook, M. Tjepkema, T. Christidis, R. Menard, A. Robichaud, and R.T. Burnett. 2018. “Diabetes status and susceptibility to the effects of PM2.5 exposure on cardiovascular mortality in a national Canadian cohort.” Epidemiology 29 (6): 784–794.
Shah, T.I., S. Bell, and K. Wilson. 2016. “Spatial accessibility to health care services: identifying under-serviced neighbourhoods in Canadian urban areas.” PLoS ONE. 11 (12): e0168208. Available at: https://doi.org/10.1371/journal.pone.0168208 (accessed October 26, 2020).
Smale, B. 2019. Background Information on the Canadian Index of Well-being. The Index, Domains, and Indicators. Waterloo, Ontario: Canadian Index of Well-being and University of Waterloo.
Smith, Conal. 2018. Treasury Living Standards Dashboard: Monitoring Intergenerational Wellbeing. New Zealand Treasury. Available at: https://treasury.govt.nz/publications/commissioned-report/treasury-living-standards-dashboard-monitoring-intergenerational-wellbeing (accessed October 19, 2020).
Statistics Canada. 2019a. The General Social Survey: An Overview, 2019. Last updated February 20, 2019. Statistics Canada Catalogue no. 89F0115X. Available at: https://www150.statcan.gc.ca/n1/pub/89f0115x/89f0115x2019001-eng.htm (accessed October 19, 2020).
Statistics Canada. 2019b. Administrative data. Last updated August 12, 2019. Available at: https://www.statcan.gc.ca/eng/our-data/where/administrative-data (accessed December 2019).
Statistics Canada. 2018. “Study: Life satisfaction among Canadian seniors, 2016.” The Daily. August 2. Statistics Canada Catalogue no. 11-001-X. Available at: https://www150.statcan.gc.ca/n1/daily-quotidien/180802/dq180802a-eng.htm (accessed September 30, 2020).
Statistics Canada. 2017a. Quality Assurance Framework: Statistical Outputs. Last updated July 19, 2017. Available at: https://www150.statcan.gc.ca/n1/pub/12-586-x/2017001/article/s5-eng.htm (accessed October 16, 2020).
Statistics Canada. 2017b. Microdata Linkage at Statistics Canada. Last updated November 11, 2017. Available at: https://www.statcan.gc.ca/eng/record/gen (accessed December 2019).
Statistics Canada. 2017c. Directive on Microdata Linkage. Last updated October 11, 2017. Available at: https://www.statcan.gc.ca/eng/record/policy4-1 (accessed December 2019).
Statistics Canada. 2017d. Social Data Linkage Environment (SDLE). Last updated July 12, 2017. Available at: https://www.statcan.gc.ca/eng/sdle/index (accessed December 2019).
Statistics Canada. 2016. Policy on the Use of Administrative Data Obtained under the Statistics Act. Last updated December 7, 2016. Available at: https://www.statcan.gc.ca/eng/about/policy/admin_data (accessed December 2019).
Status of Women Canada. 2020. The Government of Canada’s Gender Results Framework. Last updated February 4, 2020. Available at: https://cfc-swc.gc.ca/grf-crrg/index-en.html (accessed October 16, 2020).
Stiglitz, J.E., A. Sen, and J.-P.Fitoussi. 2009. Report by the Commission on the Measurement of Economic Performance and Social Progress.
Thomson E. 2019. “Air pollution, stress, and allostatic load: linking systemic and central nervous system impacts.” Journal of Alzheimer’s Disease 69 (3): 597–614.
Tjepkema, M., T. Christidis, T. Bushnik, and L. Pinault. 2019. “Cohort profile: The Canadian Census Health and Environment Cohorts (CanCHECs).” Health Reports. 30 (12): 18–26.
UNICEF Canada. 2019. Canadian Index of Child and Youth Well-being: How We Built the Index. Technical background paper. Toronto: UNICEF Canada. 26 pages. Available at: https://oneyouth.unicef.ca/sites/default/files/2019-08/How_We_Built_the_Index_Canadian_Index_of_Child_and_Youth_Well-being_0.pdf (accessed October 1, 2020).
UNICEF Canada and ONE Youth. n.d. Where Does Canada Stand? The Canadian Index of Child and Youth Well-being: 2019 Baseline Report. 78 pages. Available at: https://oneyouth.unicef.ca/sites/default/files/2019-08/2019_Baseline_Report_Canadian_Index_of_Child_and_Youth_Well-being.pdf (accessed December 9, 2020).
United Kingdom. Office for National Statistics. 2019. Measures of National Well-being Dashboard. Last updated October 23, 2019. Available at: https://www.ons.gov.uk/peoplepopulationandcommunity/wellbeing/articles/measuresofnationalwellbeingdashboard/2018-04-25 (accessed September 30, 2020).
United Nations. n.d. Climate Change. Available at: https://www.un.org/en/sections/issues-depth/climate-change/ (accessed September 30, 2020).
United Nations. 2015. The Millennium Development Goals Report 2015. Available at: https://www.un.org/millenniumgoals/2015_MDG_Report/pdf/MDG%202015%20rev%20(July%201).pdf (accessed October 19, 2020).
UNDESA (United Nations. Department of Economic and Social Affairs) Sustainable Development. n.d. Transforming our World: The 2030 Agenda for Sustainable Development. Available at: https://sdgs.un.org/2030agenda (accessed October 16, 2020).
United Nations Sustainable Development Goals. n.d.a. Take Action for the Sustainable Development Goals. Available at: https://www.un.org/sustainabledevelopment/sustainable-development-goals/ (accessed October 15, 2020).
United Nations Sustainable Development Goals. n.d.b. SDG Indicators: Global indicator framework for the Sustainable Development Goals and targets of the 2030 Agenda for Sustainable Development. Available at: https://unstats.un.org/sdgs/indicators/indicators-list/ (accessed October 16, 2020).
University of Waterloo. n.d. “Framework.” Canadian Index of Wellbeing. Available at: https://uwaterloo.ca/canadian-index-wellbeing/what-we-do/framework (accessed September 30, 2020).
The Vanier Institute of the Family. 2020a. Family Well-being Index: Measuring reach, results and impact to optimize family well-being in Canada. Available at: https://vanierinstitute.ca/family-well-being-index/ (accessed November 6, 2020).
The Vanier Institute of the Family. 2020b. Recent Highlights. Available at: https://vanierinstitute.ca/ (accessed October 1, 2020).
Veterans Well-being Act. S.C. 2005, c. 21. Available at: https://laws.justice.gc.ca/eng/acts/C-16.8/page-1.html (accessed October 16, 2020).
Wang J., and K. Strong. 2019. British Columbia’s forest fires, 2018. Environmental Fact Sheets. Statistics Canada Catalogue no. 16-508-X. Last updated May 29, 2019. Ottawa: Statistics Canada.
Whitby, A. (WFC) et al. 2014. BRAINPOoL Project Final Report: Beyond GDP – From Measurement to Politics and Policy. BRAINPOoL deliverable 5.2, A collaborative programme funded by the European Union’s Seventh Programme for research, technological development and demonstration under grant agreement No. 283024. World Future Council (WFC), 31 March 2014.
Williams, F. 2017. The Nature Fix: Why Nature Makes Us Happier, Healthier and More Creative. New York: W. W. Norton & Company.
Wollny, I., J. Apps and C. Henricson. 2010. Can Government Measure Family Well-being? A Literature Review. London, United Kingdom: Family and Parenting Institute. 98 pages. Available at: https://bit.ly/37z48il (accessed September 30, 2020).
World Health Organization. 2018. “Millenium Development Goals.” February 19, 2018. Available at: https://www.who.int/news-room/fact-sheets/detail/millenium-development-goals-(mdgs) (accessed October 15, 2020).
- Date modified: