
Having someone to count on

Archived Content
Information identified as archived is provided for reference, research or recordkeeping purposes. It is not subject to the Government of Canada Web Standards and has not been altered or updated since it was archived. Please "contact us" to request a format other than those available.
Description: Having someone to count on
Canada’s Quality of Life Framework
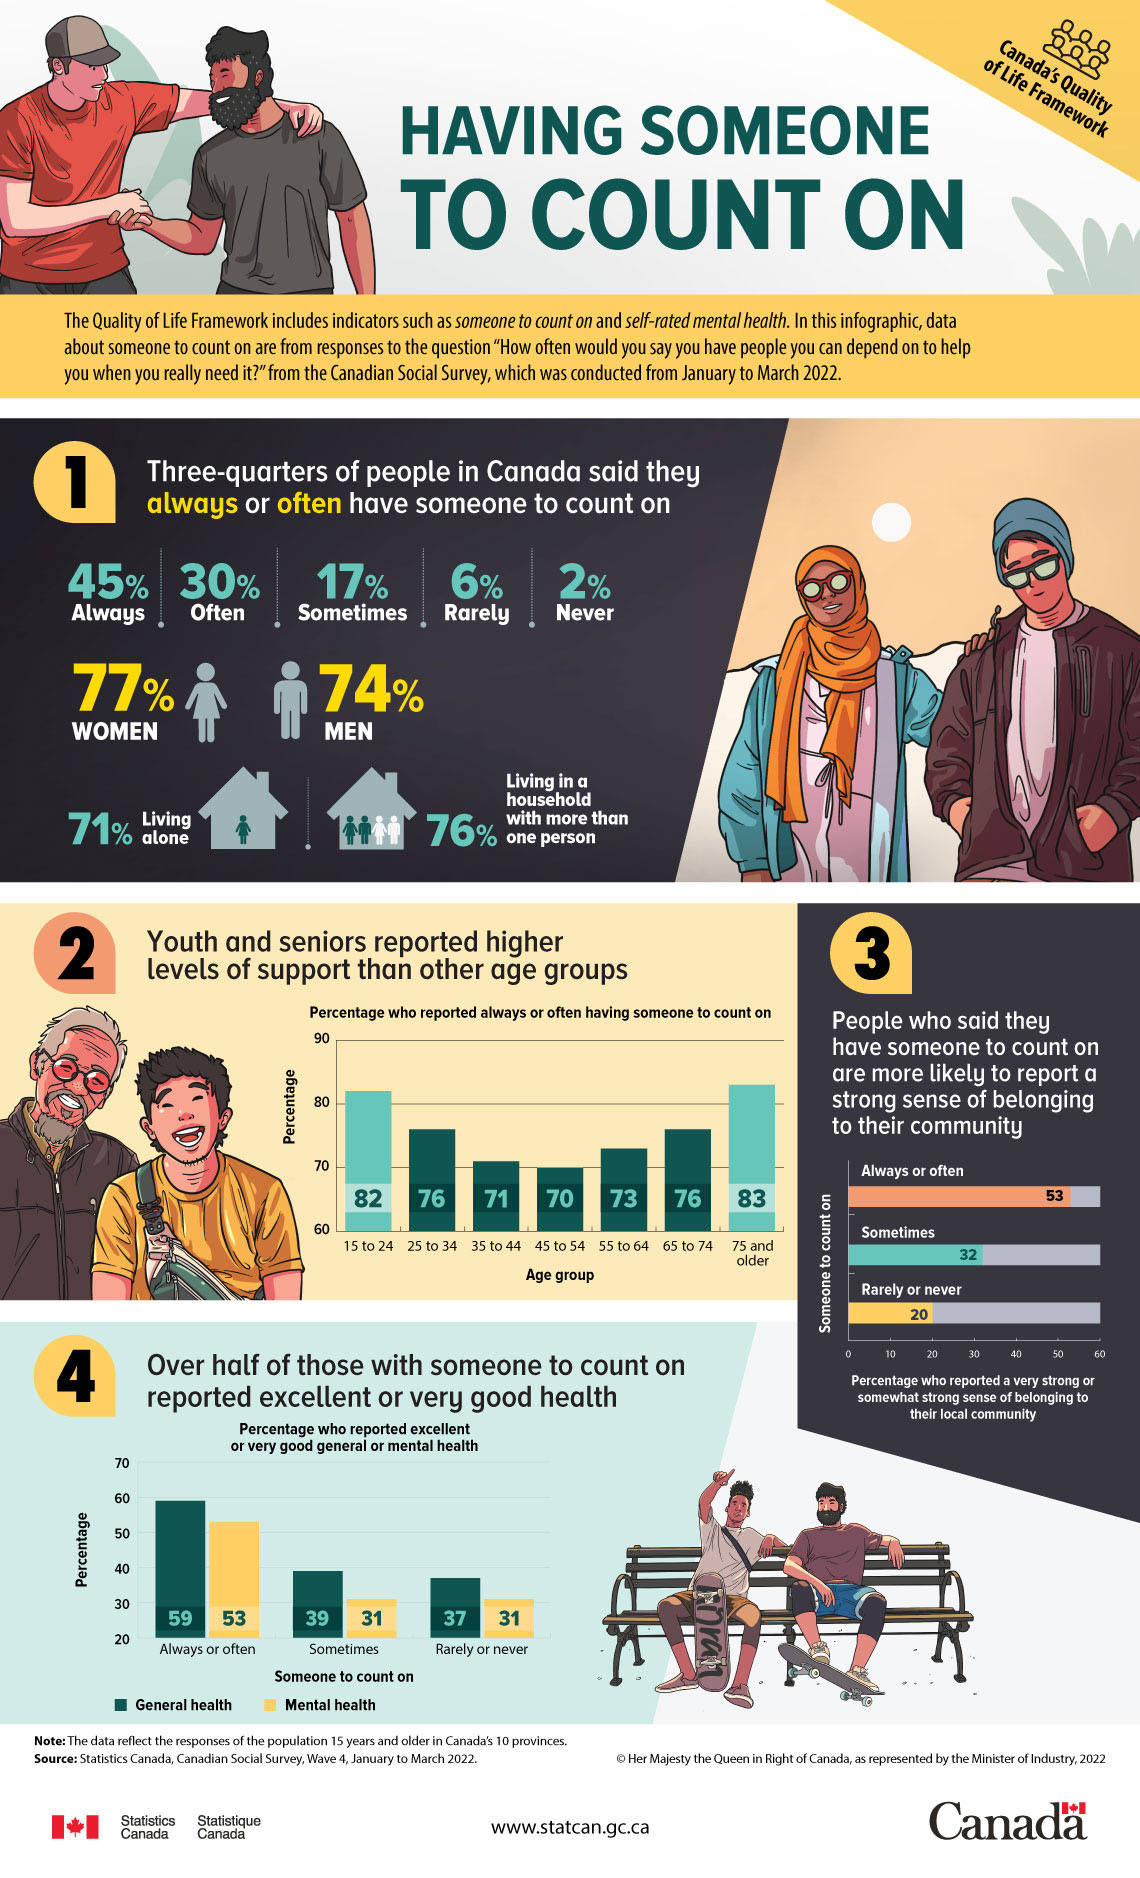
The Quality of Life Framework includes indicators such as someone to count on and self-rated mental health. In this infographic, data about someone to count on are from responses to the question “How often would you say you have people you can depend on to help you when you really need it?” from the Canadian Social Survey, which was conducted from January to March 2022.
1. Three-quarters of people in Canada said they always or often have someone to count on
| Someone to count on | Percentage |
|---|---|
| Always | 45% |
| Often | 30% |
| Sometimes | 17% |
| Rarely | 6% |
| Never | 2% |
The percentage of people who said they always or often have someone to count on is 77% among women and 74% among men. This percentage is 71% among people living alone and 76% among people living in a multiple person household.
2. Youth and seniors reported higher levels of support than other age groups
| Age group | Percentage who reported always or often having someone to count on |
|---|---|
| 15 to 24 | 82% |
| 25 to 34 | 76% |
| 35 to 44 | 71% |
| 45 to 54 | 70% |
| 55 to 64 | 73% |
| 65 to 74 | 76% |
| 75 and older | 83% |
3. People who said they have someone to count on are more likely to report a strong sense of belonging to their community
| Someone to count on | Percentage who reported a very strong or somewhat strong sense of belonging to their local community |
|---|---|
| Always or often | 53% |
| Sometimes | 32% |
| Rarely or never | 20% |
4. Over half of those with someone to count on reported excellent or very good health
| Someone to count on | Percentage who reported excellent or very good general health | Percentage who reported excellent or very good mental health |
|---|---|---|
| Always or often | 59% | 53% |
| Sometimes | 39% | 31% |
| Rarely or never | 37% | 31% |
Note: The data reflect the responses of the population aged 15 years and older in Canada’s 10 provinces.
Source: Canadian Social Survey, Wave 4, January to March 2022.
- Date modified: