
Income Research Paper Series
Market Basket Measure poverty thresholds and provisional poverty trends for 2021 and 2022
by Burton Gustajtis and Andrew Heisz
Skip to text
Text begins
The Market Basket Measure (MBM) establishes poverty thresholds based on the cost of a basket of food, clothing, shelter, transportation, and other items for a family of four that reflects a modest, basic standard of living. A family with a disposable income below the appropriate MBM threshold for the size of the family and the region where they live is deemed to be living in poverty.
Starting with reference year 2021, Statistics Canada will be releasing MBM thresholds separately from the annual release of income estimates from the Canadian Income Survey (CIS), advancing their release by 3-4 months. In future reference years, the release of MBM thresholds for a particular year will be advanced by as much as one year. This will allow users to anticipate possible movements in poverty rates using information on changes in MBM thresholds. It will also allow users to have more up-to-date information on the change in the cost of living associated with a “modest, basic standard of living”, as captured by the MBM.Note As in the past, MBM thresholds will continue to be published on Statistics Canada’s website for public consumption in Table 11-10-0066-01 Market Basket Measure (MBM) thresholds for the reference family by Market Basket Measure region, component and base.
The objective of this paper is to provide provisional estimates of MBM thresholds for the 2022 reference year using Consumer Price Index (CPI) adjustors available up to September 2022. While these provisional thresholds will be finalized and updated in a few months, they are being released now to help inform discussions of the potential impacts of recent inflation trends on poverty. Using official MBM thresholds for 2021, provisional thresholds for 2022 and what we currently know about income trends during those two years, predicted changes in the overall poverty rate for 2021 and 2022 are also presented and discussed.
New estimates for 2021 (official) and 2022 (provisional)
In accordance with the recommendations stemming from the latest comprehensive review update of the MBM, the MBM basket’s components are held constant in its base year and annual updates to the cost of basket components are made using the appropriate CPIs.Note Therefore, the changes observed in the annual CPI will have a direct impact on the changes observed in the MBM thresholds.
The method for applying the CPI to the MBM thresholds is complex, with different CPI adjustors being used depending upon provinceNote and MBM component. For example, the cost of the food component for Ontario is adjusted each year using the Ontario "food purchased from stores" CPI. Table 1 describes the CPI indexes used for each component.
| Market Basket Measure component |
Consumer Price Index label |
Consumer Price Index vector |
|---|---|---|
| Food | Food purchased from stores | v41693544, v41693679, v41693813, v41693948, v41694083, v41694219, v41694355, v41694491, v41694627, v41694762 |
| Clothing and footwear | Clothing and footwear | v41693602, v41693737, v41693871, v41694006, v41694142, v41694278, v41694414, v41694550, v41694685, v41694821 |
| Transportation | Private transportation | v41693611, v41693746, v41693880, v41694015, v41694151, v41694287, v41694423, v41694559, v41694694, v41694830 |
| Public transportation | v41693621, v41693756, v41693890, v41694025, v41694161, v41694297, v41694433, v41694569, v41694704, v41694840 |
|
| Shelter | All-items | v41693542, v41693677, v41693811, v41693946, v41694081, v41694217, v41694353, v41694489, v41694625, v41694760 |
| Other necessities | All-items | v41693542, v41693677, v41693811, v41693946, v41694081, v41694217, v41694353, v41694489, v41694625, v41694760 |
|
Note: The provincial MBM components use the provincial level CPI. The Northern Market Basket Measure (MBM-N) components use the territorial level CPI, their corresponding vectors are not provided in this table. Source: Statistics Canada. Table 18-10-0005-01 Consumer Price Index, annual average, not seasonally adjusted |
||
A couple of points should be made regarding the CPIs used for updating MBM thresholds. First, during the comprehensive review for the 2018-base MBM, it was decided that the shelter component would use the provincial all-items index, instead of the rented accommodation price index. Shortly after the publication of the 2018-base methodology, the CPI redesigned the methodology for the rented accommodation indexNote . In practice, the provincial all-items indexes have risen faster than the provincial rented accommodation indexes. This decision to use the all-items price indexes over the rented/owned accommodation indexes will be revisited during the next comprehensive review of the MBM (i.e., in 2023).
Second, while other components are adjusted using standard CPI estimates, for transportation, a weighted average of public transportation and private transportation indexes is used. Aside from the transportation component, the MBM components will track their corresponding indexes exactly.

Data table for Chart 1
| Year | Consumer Price Index | Growth rate |
|---|---|---|
| percent | ||
| 2015 | 126.6 | Note ...: not applicable |
| 2016 | 128.4 | 1.4 |
| 2017 | 130.4 | 1.6 |
| 2018 | 133.4 | 2.3 |
| 2019 | 136.0 | 1.9 |
| 2020 | 137.0 | 0.7 |
| 2021 | 141.6 | 3.4 |
| 2022 | 150.2 | 6.0Note * |
... not applicable
Source: Statistics Canada. Table 18-10-0005-01 Consumer Price Index, annual average, not seasonally adjusted Statistics Canada. Table 18-10-0004-01 Consumer Price Index, monthly, not seasonally adjusted. |
||
Growth in MBM thresholds can be compared to growth in the CPI all-items index to gauge the appropriateness of the MBM methodology in capturing changes in the cost of living. The CPI rose 3.4% on an average annual basis in 2021, the fastest pace since 1991 (+5.6%).Note The average CPI for the first nine months of 2022 indicated a 6.0% increase for 2022.
Nearly the same growth rates were observed with the MBM thresholds as, on average, they increased 3.4% in 2021 and 6.4% in 2022. Chart 2 shows the simple average of the 53 MBM regions using final data for 2015 to 2021 and provisional data for 2022. Estimates for each region are provided in tables on the Statistics Canada website for 2015 to 2021Note and in Table A.1 in the Appendix for 2022.

Data table for Chart 2
| Year | Average MBM threshold | Growth rate |
|---|---|---|
| current dollars | percent | |
| 2015 | 41,045 | Note ...: not applicable |
| 2016 | 41,581 | 1.3 |
| 2017 | 41,963 | 0.9 |
| 2018 | 42,790 | 2.0 |
| 2019 | 43,756 | 2.3 |
| 2020 | 44,141 | 0.9 |
| 2021 | 45,655 | 3.4 |
| 2022 | 48,583 | 6.4Note * |
... not applicable
Source: Statistics Canada. Table 11-10-0066-01 Market Basket Measure (MBM) thresholds for the reference family by Market Basket Measure region, component and base year. |
||
New MBM threshold estimates by component
Table 2 shows MBM threshold estimates by component for 2019 to 2022, where the 2022 estimates are provisional and based on an average of monthly CPI estimates only up to September.
| Year | Total thresholds | Food component | Clothing and footwear component | Shelter component | Transportation component | Other necessities component |
|---|---|---|---|---|---|---|
| current dollars | ||||||
| 2019 | 43,756 | 12,126 | 2,182 | 13,275 | 4,479 | 11,695 |
| 2020 | 44,141 | 12,440 | 2,141 | 13,354 | 4,446 | 11,760 |
| 2021 | 45,655 | 12,744 | 2,130 | 13,814 | 4,793 | 12,174 |
| 2022Table 2 Note 1 | 48,583 | 13,862 | 2,154 | 14,699 | 4,911 | 12,958 |
| 12-month change |
Total thresholds | Food component | Clothing and footwear component | Shelter component | Transportation component | Other necessities component |
| percentage | ||||||
| 2019 to 2020 | 0.9 | 2.6 | -1.9 | 0.6 | -0.7 | 0.6 |
| 2020 to 2021 | 3.4 | 2.4 | -0.5 | 3.5 | 7.8 | 3.5 |
| 2021 to 2022Table 2 Note 1 | 6.4 | 8.8 | 1.1 | 6.4 | 2.5 | 6.4 |
|
||||||
The food component cost in the MBM basket makes up on average 28% of the MBM threshold, while the shelter component makes up about 30%. Accordingly, movements in the price of food and shelter have an important effect on the growth in MBM thresholds. In the MBM, the cost of the food basket rose 2.4% between 2020 and 2021 and 8.8% between 2021 and 2022. The shelter cost rose by 3.5% between 2020 and 2021 and 6.4% between 2021 and 2022.
The clothing and footwear component makes up the smallest proportion of the MBM basket and it was the only component to experience a decrease between 2020 and 2021, with cost decreasing on average by 0.5% from 2020 to 2021 but increasing by around 1.1% between 2021 and 2022.
Transportation experienced the highest average (7.8%) increase in cost between 2020 and 2021. This increase was mostly driven by the large increases in private transportation costs (including gasoline costs) and, therefore, impacted the MBM regions that rely mostly or entirely on private transportation options. For example, communities in New Brunswick with a population less than 100,000Note saw their transportation costs increase by 10.8% from 2020 to 2021 (Table A.1 in the Appendix). In comparison, between 2021 and 2022, average transportation costs for all the MBM regions rose by 2.4%.
Finally, the other necessities component uses a different pricing methodology compared to the defined componentsNote and contributes, on average, about another 25% to the total MBM threshold. It uses the annual provincial all-items indexes for annual cost adjustments. Therefore, its year over year increase was 3.5% in 2021 and 6.4% in 2022.
Looking forward – predicted changes the overall poverty rate
Overall, one could consider the MBM threshold growth rates of 3.4% in 2021 and 6.4% in 2022 as benchmarks to form expectations for changes in the poverty rate. These changes, in addition to information on growth in family income in 2021 and 2022, could be used to gauge the evolution of the overall poverty rate over those two years. If family income growth is predicted to be higher than the growth in the MBM thresholds, then the poverty rate is predicted to decrease. The greater this difference is, the greater the decrease is predicted to be. Conversely, if income growth rate is predicted to be less than the MBM threshold growth rate, then the poverty rate would be predicted to rise.
The CIS is the official data source used to estimate annual poverty rates in Canada. However, estimates from the CIS are available only 14-15 months following the end of the reference year, and the most recent data available (at time of writing in December 2022) is for 2020, preventing an analysis of up-to-date trends in inflation and poverty. An alternate source for estimating growth trends in family income is provided by the Distributed Household Economic Accounts (DHEA), a model that is able to output up-to-date estimates for the distribution of income using internationally accepted National Accounts concepts. DHEA income estimates are presently available through the second quarter of 2022. In this section we use up-to-date information from the DHEA to develop statistical predictions of the path of Canada’s overall poverty rate in 2021 and 2022.
Data table for Chart 3
| Year | Bottom quintile after-tax income (CIS) | Bottom quintile disposable income (DHEA) |
|---|---|---|
| current dollars | ||
| 2002 | 11,642 | 16,110 |
| 2003 | 11,931 | 16,719 |
| 2004 | 12,037 | 16,792 |
| 2005 | 12,223 | 16,468 |
| 2006 | 12,503 | 18,060 |
| 2007 | 13,347 | 19,253 |
| 2008 | 14,367 | 19,564 |
| 2009 | 14,112 | 20,329 |
| 2010 | 14,201 | 21,011 |
| 2011 | 14,441 | 21,689 |
| 2012 | 14,791 | 23,097 |
| 2013 | 15,059 | 22,766 |
| 2014 | 15,536 | 23,215 |
| 2015 | 15,247 | 22,867 |
| 2016 | 15,886 | 23,637 |
| 2017 | 16,467 | 24,025 |
| 2018 | 16,505 | 24,888 |
| 2019 | 17,769 | 25,633 |
| 2020 | 20,800 | 33,024 |
| 2021 | Note ...: not applicable | 32,716 |
| 2022 | Note ...: not applicable | 29,360 |
|
... not applicable Source: Bottom quintile after-tax income (CIS) - Statistics Canada. Table 11-10-0192-01 Upper income limit, income share and average income by economic family type and income decile. Bottom quintile disposable income (DHEA) - Statistics Canada. Table 36-10-0587-01 Distributions of household economic accounts, income, consumption and saving, by characteristic, annual and Table 36-10-0662-01 Distributions of household economic accounts, income, consumption and saving, by characteristic, quarterly. |
||
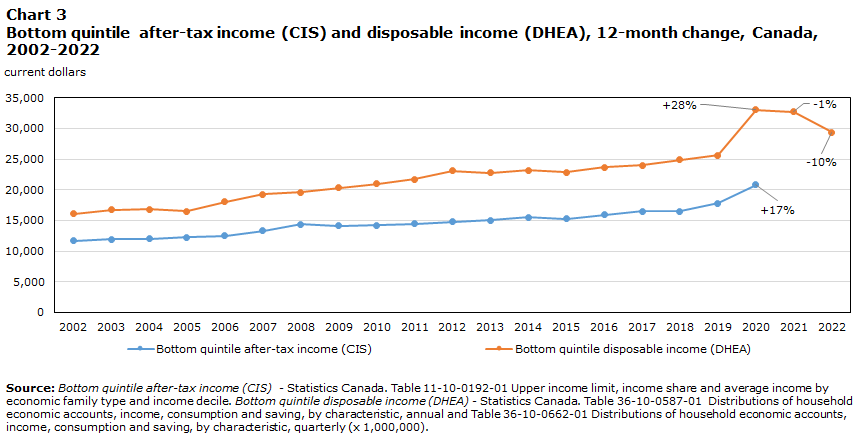
Chart 3 shows recent trends in income levels and growth rates for families in the bottom income quintile, using data from the CIS and the DHEA. Both series show a large increase in income in 2020, explained by the income support delivered through pandemic relief programs, which led to a significant decline in the overall poverty rate in that year. According to the DHEA model, the annual growth rate for bottom quintile income is predicted to fall by 1% in 2021 compared to 2020, and by 10% further in 2022, as pandemic relief programs ended or where phased-out. These predicted declines in income, coupled with the estimated 3.4% increase in MBM thresholds for 2021 and 6.4% estimated increase for 2022, point to a predicted increase in the overall poverty rate for both years. It should be noted that income level differences between the DHEA and the CIS are due to differences in the definitions of income (e.g., DHEA estimates include factors not included in the CIS income definition such as imputed rent), the reference unit (CIS uses economic families for MBM and other related income indicators, while the DHEA uses households), and other factors.

Data table for Chart 4
| Year | Official poverty rate | Predicted poverty rate | Modelled poverty rate |
|---|---|---|---|
| percent | |||
| 2015 | 14.5 | 14.5 | 12.7 |
| 2016 | 12.9 | 12.9 | 12.0 |
| 2017 | 11.9 | 11.9 | 11.7 |
| 2018 | 11.2 | 11.2 | 11.5 |
| 2019 | 10.3 | 10.3 | 11.2 |
| 2020 | 6.4 | 6.4 | 7.6 |
| 2021 | Note ...: not applicable | 7.0 | 8.3 |
| 2022 | Note ...: not applicable | 9.8 | 11.8 |
|
... not applicable Source: Official poverty rate. Statistics Canada. Table 11-10-0135-01 Low income statistics by age, sex and economic family type. Modelled poverty rate is based on the author's calculations using data from the distributions of household economic accounts (DHEA). |
|||
Chart 4 presents predicted values of the poverty rate from 2015 to 2022 based upon the results of a regression model which describes the MBM poverty rate as a function of bottom quintile income from the DHEA, the CPI and a time trend.Note This model is calibrated using data from 2002 to 2020, and then predicted values for the poverty rate are calculated using DHEA and CPI estimates through 2022. According to this model, the poverty rate is predicted to change relatively little between 2020 and 2021, up by 9.2%. Between 2021 and 2022 a larger change is predicted, with the poverty rate predicted to rise by an additional 41.5%. Annual growth rates of 9.2% and 41.5% imply a predicted poverty rate value of 7.0% in 2021 and 9.8% in 2022. It is underscored that these expectations are based on a model, and the official poverty rates would be different depending on the actual data.
Conclusion
This paper introduces Statistics Canada’s new practice of publishing MBM thresholds in advance of an annual income data release, making these estimates available as early as possible for policy analysts and others who are interested in the potential influence of price changes on the poverty rate. The poverty thresholds are shown to follow the CPI closely, which is to be predicted, given that various CPI adjustors are used to update the MBM thresholds. Other things being equal, poverty rates would fall as the incomes of lower-income Canadians increase and rise as inflation increases. Modelled results indicate that, based on current macro-economic conditions and price trends, Canada’s poverty rate is predicted to rise in 2021 and 2022, returning to a level close to the pre-pandemic levels by 2022.
Appendix A: Provisional 2022 poverty thresholds for MBM regions
| MBM Geography | Total threshold | Food | Clothing and footwear | Shelter | Transportation | Other necessities | |
|---|---|---|---|---|---|---|---|
| Province | Region | current dollars | |||||
| Newfoundland and Labrador | rural | 47,684 | 15,304 | 2,103 | 11,429 | 5,171 | 13,677 |
| < 30,000 | 48,114 | 15,304 | 2,103 | 11,859 | 5,171 | 13,677 | |
| 30,000-99,999 | 49,489 | 15,304 | 2,103 | 13,872 | 4,533 | 13,677 | |
| St. John's | 50,167 | 14,582 | 2,103 | 15,607 | 4,717 | 13,158 | |
| Prince Edward Island | rural | 48,312 | 15,377 | 2,147 | 12,006 | 4,886 | 13,896 |
| < 30,000 | 49,189 | 15,377 | 2,147 | 12,883 | 4,886 | 13,896 | |
| Charlottetown | 50,288 | 15,377 | 2,147 | 14,595 | 4,272 | 13,896 | |
| Nova Scotia | rural | 47,533 | 14,935 | 2,194 | 11,151 | 5,407 | 13,846 |
| < 30,000 | 48,558 | 14,935 | 2,194 | 12,176 | 5,407 | 13,846 | |
| 30,000-99,999 | 48,909 | 14,935 | 2,194 | 13,047 | 4,887 | 13,846 | |
| Halifax | 51,597 | 14,307 | 2,194 | 17,348 | 4,353 | 13,396 | |
| Cape Breton | 47,428 | 14,007 | 2,194 | 13,328 | 4,716 | 13,182 | |
| New Brunswick | rural | 46,665 | 15,120 | 2,425 | 10,183 | 5,163 | 13,774 |
| < 30,000 | 48,379 | 15,120 | 2,425 | 11,897 | 5,163 | 13,774 | |
| 30,000-99,999 | 48,124 | 15,120 | 2,425 | 11,642 | 5,163 | 13,774 | |
| Fredericton | 50,238 | 15,043 | 2,425 | 14,503 | 4,547 | 13,720 | |
| Saint John | 47,728 | 14,681 | 2,425 | 12,591 | 4,568 | 13,463 | |
| Moncton | 48,055 | 14,150 | 2,425 | 13,965 | 4,428 | 13,087 | |
| Quebec | rural | 42,741 | 13,147 | 2,193 | 10,020 | 4,869 | 12,513 |
| < 30,000 | 42,280 | 13,147 | 2,193 | 9,559 | 4,869 | 12,513 | |
| 30,000-99,999 | 42,300 | 13,147 | 2,193 | 10,187 | 4,260 | 12,513 | |
| 100,000-499,999 | 42,842 | 13,147 | 2,193 | 10,634 | 4,356 | 12,513 | |
| Québec | 44,702 | 13,326 | 2,193 | 12,310 | 4,230 | 12,644 | |
| Montréal | 45,331 | 13,445 | 2,193 | 12,841 | 4,122 | 12,731 | |
| Ontario | rural | 45,932 | 12,473 | 2,198 | 13,683 | 5,536 | 12,043 |
| < 30,000 | 46,693 | 12,473 | 2,198 | 14,443 | 5,536 | 12,043 | |
| 30,000-99,999 | 46,146 | 12,473 | 2,198 | 14,851 | 4,581 | 12,043 | |
| 100,000-499,999 | 48,592 | 12,985 | 2,198 | 16,077 | 4,921 | 12,411 | |
| 500,000+ | 50,752 | 12,985 | 2,198 | 18,146 | 5,011 | 12,411 | |
| Ottawa | 53,428 | 13,464 | 2,198 | 20,088 | 4,922 | 12,756 | |
| Hamilton/Burlington | 49,216 | 12,683 | 2,198 | 16,851 | 5,290 | 12,194 | |
| Toronto | 54,419 | 12,760 | 1,881 | 21,708 | 6,085 | 11,985 | |
| Manitoba | rural | 44,436 | 12,801 | 2,071 | 11,674 | 5,604 | 12,286 |
| < 30,000 | 46,510 | 12,801 | 2,071 | 13,748 | 5,604 | 12,286 | |
| 30,000-99,999 | 46,582 | 12,801 | 2,071 | 13,820 | 5,604 | 12,286 | |
| Brandon | 46,017 | 12,801 | 2,071 | 14,089 | 4,770 | 12,286 | |
| Winnipeg | 50,129 | 13,260 | 2,071 | 17,216 | 4,958 | 12,623 | |
| Saskatchewan | rural | 45,324 | 12,977 | 2,262 | 12,134 | 5,481 | 12,471 |
| < 30,000 | 47,241 | 12,977 | 2,262 | 14,051 | 5,481 | 12,471 | |
| 30,000-99,999 | 47,434 | 12,977 | 2,262 | 15,022 | 4,702 | 12,471 | |
| Saskatoon | 51,275 | 13,219 | 2,262 | 18,327 | 4,823 | 12,644 | |
| Regina | 50,353 | 13,098 | 2,262 | 17,550 | 4,887 | 12,556 | |
| Alberta | rural | 51,230 | 14,646 | 1,882 | 16,403 | 4,865 | 13,434 |
| < 30,000 | 52,480 | 14,646 | 1,882 | 17,652 | 4,865 | 13,434 | |
| 30,000-99,999 | 51,046 | 14,646 | 1,882 | 16,992 | 4,092 | 13,434 | |
| 100,000-499,999 | 51,709 | 14,646 | 1,882 | 17,427 | 4,319 | 13,434 | |
| Edmonton | 54,343 | 13,637 | 1,882 | 21,427 | 4,678 | 12,719 | |
| Calgary | 54,888 | 13,756 | 1,882 | 21,778 | 4,669 | 12,803 | |
| British Columbia | rural | 46,950 | 13,455 | 2,076 | 13,337 | 5,394 | 12,688 |
| < 30,000 | 48,240 | 13,455 | 2,076 | 14,627 | 5,394 | 12,688 | |
| 30,000-99,999 | 48,491 | 13,455 | 2,076 | 15,677 | 4,596 | 12,688 | |
| 100,000-499,999 | 53,350 | 14,320 | 2,076 | 19,066 | 4,580 | 13,308 | |
| Vancouver | 55,062 | 13,698 | 2,076 | 21,548 | 4,877 | 12,862 | |
| Source: Statistics Canada. Custom tabulation. | |||||||
Appendix B: Predicted poverty trends based upon trends in bottom-quintile disposable income from the Distributed Household Economic Accounts (DHEA) model
For predicted poverty trends, a model is estimated which describes the poverty rate as a function of the average bottom quintile disposable income, in current dollars, per household from the DHEA, the CPI and a time trend. National (all provinces) MBM poverty rates from 2002 through 2020 are used from all of the three MBM bases available (i.e., the 2000, 2008 and 2018 base data were all used). The model expresses poverty rate, the DHEA disposable income and the CPI index in logs, the time trend is linear and dummy variables are added to account for differences in poverty rates from different MBM bases. Results of the regression are in Table B.1.
| DV=ln(poverty rate) | ||
|---|---|---|
| Parameter | Standard Error | |
| Intercept | -5.806 | 12.274 |
| ln(disposable income) | -1.322Note *** | 0.376 |
| ln(CPI) | 4.694Note * | 2.726 |
| 2000-base | -0.364Note *** | 0.074 |
| 2008-base | - 0.142Note ** | 0.056 |
| Time | -0.079Note * | 0.046 |
| N | 31 | Note ...: not applicable |
| R2 | 0.742Note *** | Note ...: not applicable |
... not applicable
|
||
The regression has a modest quality overall fit, with an R2 of 0.742. As expected, disposable income enters the model with a negative coefficient, indicating poverty falls when disposable income rises, and CPI is estimated to have a positive coefficient indicating the poverty rate would fall when prices fall (all else being equal). Published and modelled data are shown in Table B.2.
| Official poverty rates | Average disposable income per household in the bottom income quintile (DHEA) | All-items Consumer Price Index, 2002=100 | Modelled poverty rates | |||||
|---|---|---|---|---|---|---|---|---|
| 2000-base | 2008-base | 2018-base | 2000-base | 2008-base | 2018-base | |||
| Year | ||||||||
| 2002 | 12.9 | Note ...: not applicable | Note ...: not applicable | 16,110 | 100.0 | 13.0 | Note ...: not applicable | Note ...: not applicable |
| 2003 | 12.5 | Note ...: not applicable | Note ...: not applicable | 16,719 | 102.8 | 13.0 | Note ...: not applicable | Note ...: not applicable |
| 2004 | 12.5 | Note ...: not applicable | Note ...: not applicable | 16,792 | 104.7 | 13.0 | Note ...: not applicable | Note ...: not applicable |
| 2005 | 11.8 | Note ...: not applicable | Note ...: not applicable | 16,468 | 107.0 | 13.6 | Note ...: not applicable | Note ...: not applicable |
| 2006 | 12.4 | 15.6 | Note ...: not applicable | 18,060 | 109.1 | 12.2 | 15.2 | Note ...: not applicable |
| 2007 | 10.8 | 13.9 | Note ...: not applicable | 19,253 | 111.5 | 11.5 | 14.3 | Note ...: not applicable |
| 2008 | 10.2 | 12.4 | Note ...: not applicable | 19,564 | 114.1 | 11.6 | 14.4 | Note ...: not applicable |
| 2009 | 11.3 | 13.4 | Note ...: not applicable | 20,329 | 114.4 | 10.3 | 12.8 | Note ...: not applicable |
| 2010 | 10.4 | 12.3 | Note ...: not applicable | 21,011 | 116.5 | 9.9 | 12.4 | Note ...: not applicable |
| 2011 | 10.5 | 12.7 | Note ...: not applicable | 21,689 | 119.9 | 10.1 | 12.6 | Note ...: not applicable |
| 2012 | 10.8 | 12.7 | Note ...: not applicable | 23,097 | 121.7 | 9.2 | 11.4 | Note ...: not applicable |
| 2013 | Note ...: not applicable | 12.1 | Note ...: not applicable | 22,766 | 122.8 | Note ...: not applicable | 11.2 | Note ...: not applicable |
| 2014 | Note ...: not applicable | 11.3 | Note ...: not applicable | 23,215 | 125.2 | Note ...: not applicable | 11.1 | Note ...: not applicable |
| 2015 | Note ...: not applicable | 12.1 | 14.5 | 22,867 | 126.6 | Note ...: not applicable | 11.0 | 12.7 |
| 2016 | Note ...: not applicable | 10.6 | 12.9 | 23,637 | 128.4 | Note ...: not applicable | 10.4 | 12.0 |
| 2017 | Note ...: not applicable | 9.7 | 11.9 | 24,025 | 130.4 | Note ...: not applicable | 10.1 | 11.7 |
| 2018 | Note ...: not applicable | 9.0 | 11.2 | 24,888 | 133.4 | Note ...: not applicable | 9.9 | 11.5 |
| 2019 | Note ...: not applicable | 8.3 | 10.3 | 25,633 | 136.0 | Note ...: not applicable | 9.7 | 11.2 |
| 2020 | Note ...: not applicable | Note ...: not applicable | 6.4 | 33,024 | 137.0 | Note ...: not applicable | Note ...: not applicable | 7.6 |
| 2021 | Note ...: not applicable | Note ...: not applicable | Note ...: not applicable | 32,716 | 141.6 | Note ...: not applicable | Note ...: not applicable | 8.3 |
| 2022 | Note ...: not applicable | Note ...: not applicable | Note ...: not applicable | 29,360Note * | 150.2Note ** | Note ...: not applicable | Note ...: not applicable | 11.8 |
... not applicable
Official poverty rates - Statistics Canada. Table 11-10-0135-01 Low income statistics by age, sex and economic family type. Average disposable income per household in the bottom income quintile (DHEA) - Statistics Canada. Table 36-10-0587-01 Distributions of household economic accounts, income, consumption and saving, by characteristic, annual & Table 36-10-0662-01 Distributions of household economic accounts, income, consumption and saving, by characteristic, quarterly. Consumer price index, 2002=100 - Statistics Canada. Table 18-10-0005-01 Consumer Price Index, annual average, not seasonally adjusted. Modelled poverty rates - Authors' calculations |
||||||||
References
Devin, Nancy, Burton Gustajtis, Keith Lam and Sarah McDermott (2021), “Construction of a Northern Market Basket Measure of poverty for Yukon and the Northwest Territories”. Catalogue no. 75F0002M2021007.
Djidel, Samir, Burton Gustajtis, Andrew Heisz, Keith Lam, Isabelle Marchand and Sarah McDermott (2020), “Report on the second comprehensive review of the Market Basket Measure”. Catalogue No. 75F0002M2020002.
Expert Group on Poverty Statistic (Rio Group). Rio de Janeiro, September 2006, “Compendium of best practices in poverty measurement”. ISBN 85-240-3908-6.
Gustajtis, Burton and Andrew Heisz (2022), “Market Basket Measure Technical Paper: The other necessities component”. Catalogue No. 75F0002M2022006.
Keshishbanoosy, Roobina and Lance Taylor (2019), “New approach for estimating the rent component of the Consumer Price Index”. Catalogue no. 62F0014M2019002.
Statistics Canada (2021), “Consumer Price Index: Annual review, 2021”. Catalogue No. 11-001-X.
- Date modified: