
Insights on Canadian Society
Gendered impacts of the COVID-19 pandemic on the proportion of youth neither in employment nor education at the start of the school year

Archived Content
Information identified as archived is provided for reference, research or recordkeeping purposes. It is not subject to the Government of Canada Web Standards and has not been altered or updated since it was archived. Please "contact us" to request a format other than those available.
by Katherine Wall

Skip to text
Text begins
This study was funded by Women and Gender Equality Canada (WAGE).
Start of text box
Highlights
- At the start of the 2020/2021 school year, the rate of young people aged 15 to 29 not in employment, education or training (NEET) was higher compared to a year earlier, especially for men. The rate stood at 12% for women (up from 11%) and 14% for men (up from 10%).
- Young women’s lower rate of NEET relative to young men may be partly explained by their increased engagement in postsecondary schooling between fall 2019 and 2020. Postsecondary school attendance rose by 3-4 percentage points for young women aged 15 to 19 and 20 to 24, but did not change significantly for young men in these age groups.
- In September-October 2020, both women and men aged 20-24 experienced similar decreases in the proportion working and not in school (-6 percentage points). However, women aged 25 to 29 did not experience a significant decrease in the proportion working and not in school, while similarly-aged men saw a 5 percentage point drop, primarily as a result of job losses in the construction industry.
- There was no significant increase in the NEET rate for mothers or fathers aged 25 to 29, though mothers continued to have higher NEET rates than fathers.
- The NEET rate for immigrant women, which was generally higher than that of non-immigrant women, increased during the COVID-19 pandemic. As a result, the gap between immigrant and non-immigrant women widened.
End of text box
Introduction
When the first wave of COVID-19 pandemic hit Canada in March 2020, Canadian youth and young people experienced major disruptions in their typical routines. The halt of in-person learning, the disappearance of jobs particularly among youth, and the resulting social isolation took a toll on their mental health. Over 6 in 10 people aged 15 to 34 experienced a worsening of their mental health, as self-reported in April-May 2020, more so than any other age group.Note
The decline of mental wellbeing was one of the biggest impacts for youth observed in the first wave. However, the pandemic’s impact on disrupted education and training, combined with a lack of employment opportunities, also raises questions on youth’s important life transitions. Previous research has shown that youth not in employment, education or training – known as NEET – are considered at risk of long-term economic and social difficulties.Note This risk grows if the situation persists, as NEET youth become more discouraged, disengaged and socially excluded.Note
While the months that followed the first wave (summer 2020) saw fewer cases of COVID, the lifting of restrictions and an initial re-opening of the economy, young people experienced fewer gains in employment compared to older age groups. The real possible turning point for youth, however, was the fall 2020 re-opening of schools – a social institution considered integral to the lives of youth, affecting their intellectual and social development, and their physical and mental health.
For many young people, it was back to school in the ‘new normal’. Many schools re-opened for in-person learning, while the online learning options offered by many schools had adapted and were more structured than during the first wave. Still, there were many existing restrictions on extra-curricular activities, school sports and clubs, and overall campus life. Online learning, which became the norm in most college and university programs, may have also been an unappealing option for some, who may have deferred or postponed studies.Note
This article examines the period of September to October 2020, which signalled the beginning of new school year and also the start of the second wave of COVID-19 in Canada. It illuminates the decisions that youth (and, in the case of secondary students, their parents) made about their schooling, and how the combination of these possibly difficult decisions, with the unprecedented drops in youth employment, affected the proportion of youth who were NEET. Knowing and understanding patterns in the youth NEET rate during the pandemic, particularly in light of possible physical re-entry into schools, can shed light on the possible long term economic and social wellbeing implications for this generation for years to come.
Not all youth have been equally affected by the disruptions in school and employment during the pandemic. For example, the economic downturn associated with the first wave of COVID-19 disproportionately affected women during spring and summer 2020, leading it to be widely termed a “she-cession”.Note Women’s employment dropped more rapidly than men’s in March during the early days of the economic shutdown and school closures, and was slower to recover.
Though this trend had largely subsided by early fall, the time period covered by this paper, the subsequent second wave brought further declines in employment, especially among young women aged 15 to 24, whose employment dropped by 14 percent from pre-pandemic levels as of February 2021, compared to decreases of 7 percent for men of the same age and 2 percent for women and men aged 25 to 54.Note More specifically, this employment decline among youth mainly involved a reduction in employment among female students, rather than large increases in the NEET rate among women.
Applying a gender lens, this article examines the impact of the pandemic on youth across key age groups, recognizing that NEET rates typically differ for men and women across various life stages. In the teen years (aged 15 to 19), despite the relatively low rates of NEET (given most youth aged 15-16 are in school), young men are more likely than women to be classified as NEET, as a result of lower participation in education.Note This gender difference in NEET largely disappears in the early 20s, when men are generally more likely to be working and not in school than women, while women are conversely more likely to be enrolled in post-secondary education.Note Among those in their later 20s, many of whom have completed their studies, the NEET rate is typically higher for women than men due to women shouldering a larger portion of childcare responsibilities.Note
In addition to analyzing the age and gender dimensions of NEET, the article examines the intersection of gender and other characteristics on the risk of NEET, including parenthood, immigrant status, belonging to a designated visible minority group, Indigenous identity, and province of residenceNote . The article builds on an earlier Statistics Canada paper on the pandemic’s impact on youth NEET rate by using data from September-October 2020 to show the changes associated with the new school year.Note Rates and characteristics are presented for three mutually exclusive categories: young people attending school, young people who are working and no longer attending school and young people who are NEET. Note
NEET rate decreased since the first wave, but had not completely returned to pre-pandemic levels
At the start of the 2020/2021 school year (September-October 2020), there were clear signs of improvement for youth since the first wave. The youth NEET rate had significantly decreased since the first wave. Specifically, 12% of women aged 15 to 29 were considered NEET, down from 24% in April 2020. For young men, the decrease was similar, dropping 11 percentage points, from 25% in April 2020 to 14% in September-October 2020.Note
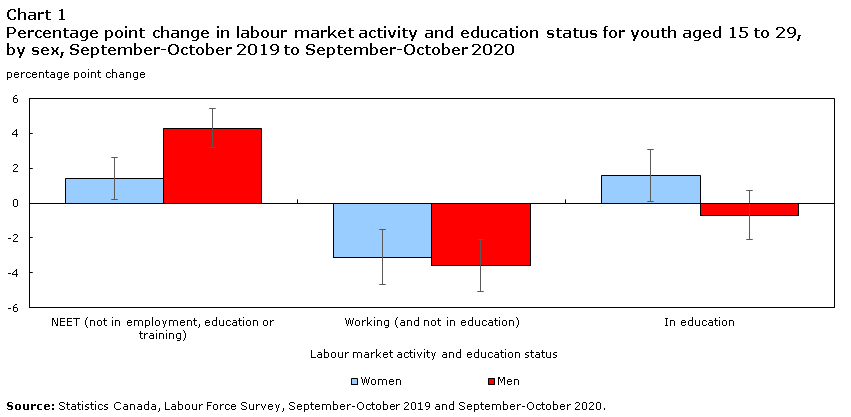
Despite these improvements, the NEET rate had not returned to the rates seen a year earlier. For young women, the NEET rate in September-October 2020 was one percentage point higher than a year earlier, while for men, the change was even more pronounced. Young men aged 15 to 29 experienced an increase of four percentage points in NEET, from 10% in September-October 2019 to 14% during the same period in 2020 (Chart 1).
As a result of the gender difference in the degree of change between the pre-pandemic and pandemic period, young women in September-October 2020 were less likely than young men to be neither employed nor enrolled in school (12% versus 14% for young men). This contrasts the relative gender parity a year earlier (11% for women and 10% for men).
Data table for Chart 1
| Labour market activity and education status | Estimates | 95% Confidence Interval | ||
|---|---|---|---|---|
| Women | Men | Women | Men | |
| percentage point change | ||||
| NEET (not in employment, education or training) | 1.4 | 4.3 | 1.2 | 1.1 |
| Working (and not in education) | -3.1 | -3.6 | 1.6 | 1.5 |
| In education | 1.6 | -0.7 | 1.5 | 1.4 |
|
Source: Statistics Canada, Labour Force Survey, September-October 2019 and September-October 2020. |
||||
Increased rates of post-secondary attendance partly explain young women’s smaller increase in NEET rates
Increased post-secondary school attendance appears to be a leading explanation for young women’s quicker rebound in September-October 2020, relative to young men, and their corresponding lower rate of NEET. Young women’s participation in postsecondary school increased to 32% at the start of the 2020/2021 academic year, compared to 29% at the start of the 2019/2020 school year. In comparison, young men’s stayed constant at 23%.
This increase was driven by those under the age of 25. Specifically, post-secondary attendance rose from 48% to 53% for young women aged 17 to 19, and from 46% to 50% for women aged 20 to 24.
Meanwhile, there was no significant changes among young men for any age category. Post-secondary attendance, which is typically lower among men than women, hovered around 38-40% for young men aged 17 to 19, and at the 35-36% range for 20-24-year-old men.
Young women’s increases in postsecondary attendance were likely, in part, a response to a lack of job opportunities. That said, it cannot explain why young men, facing similar challenges, would not also increase their postsecondary attendance. However, there is a longstanding pattern of young women being more likely to pursue and graduate from postsecondary studies compared to young men.Note
Both young women and men reported drops in high school attendance
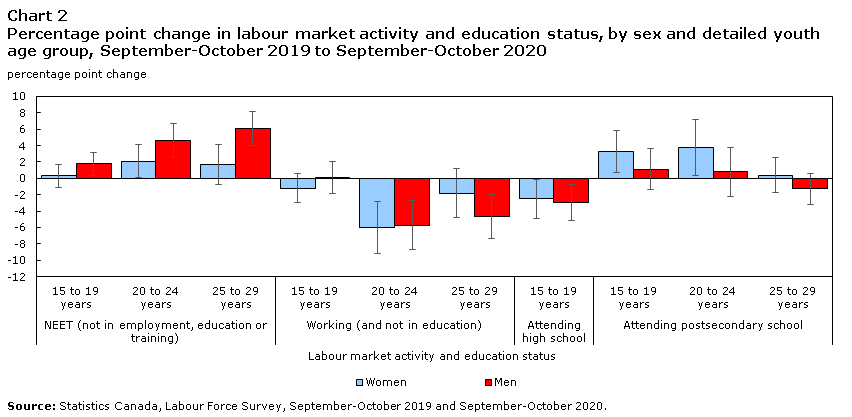
Unlike post-secondary attendance, young women and men both experienced declines in high school attendance between the start of 2019/2020 school year and the one in 2020/2021. Overall, attendance at high schools dropped by 2-3 percentage points for both sexes aged 15 to 19 (Chart 2). This drop was despite the re-opening of high schools for either complete or partial in-person learning in the fall of 2020.
Data table for Chart 2
| Labour market activity and education status | Age group | Estimates | 95% Confidence Interval | ||
|---|---|---|---|---|---|
| Women | Men | Women | Men | ||
| percentage point change | |||||
| NEET (not in employment, education or training) | 15 to 19 years | 0.3 | 1.8 | 1.4 | 1.4 |
| 20 to 24 years | 2.1 | 4.6 | 2.0 | 2.1 | |
| 25 to 29 years | 1.7 | 6.1 | 2.4 | 2.1 | |
| Working (and not in education) | 15 to 19 years | -1.2 | 0.1 | 1.8 | 1.9 |
| 20 to 24 years | -6.0 | -5.7 | 3.2 | 3.0 | |
| 25 to 29 years | -1.8 | -4.7 | 3.0 | 2.7 | |
| Attending high school | 15 to 19 years | -2.5 | -3.0 | 2.4 | 2.2 |
| Attending postsecondary school | 15 to 19 years | 3.3 | 1.1 | 2.6 | 2.5 |
| 20 to 24 years | 3.8 | 0.8 | 3.4 | 3.0 | |
| 25 to 29 years | 0.4 | -1.3 | 2.1 | 1.9 | |
| Source: Statistics Canada, Labour Force Survey, September-October 2019 and September-October 2020. | |||||
There are several potential elements that may have contributed to this decline, including later opening of schools in September in some provinces; small changes in the age distribution of respondents within this age category (as older ones are less likely to be in high school); possible increases in the high school dropout rate; and possible shift to homeschooling optionsNote . More research will be needed to confirm the reasons for the decline, as following the initial re-opening period, high school attendance rebounded to pre-pandemic levels during the November to February period.
The proportion working and not in school decreased for both women and men between fall 2019 and 2020
While school is central in the lives of many youth, a considerable portion of young people are no longer in school (sometimes for reasons unrelated to the pandemic), either temporarily, in the cases of gap years or to care for children, or more permanently, having transitioned from education to work.
The proportion of young women and men who were working and not in school fell among both sexes, by 3-4 percentage points. Note For women, however, this decrease only affected those aged 20 to 24, while the decline for men was observed for those aged 20 to 24 and 25 to 29.
Men and women aged 20 to 24 each experienced a 6-percentage point drop in the proportion who were working and not in school. In September-October 2020, 46% of men aged 20 to 24 were working and not in school, down from 52% a year earlier. For women, the proportion fell from 42% in 2019 to 36% in 2020. For young women, these declines were primarily attributable to employment decreases in the accommodation and food services sector, while for young men they were spread across many sectors.
For the next age cohort, those aged 25 to 29, the 5-percentage-point drop in the proportion of men who were working and not in school was mainly driven by job losses in the construction industry, which is largely male-dominated. Note Note The lack of change among similarly-aged women could be explained by the offset of the job losses in accommodation and food services with job increases in the finance and insurance sector. This pattern may have changed in later months, given the disproportionate impact of the second wave of the pandemic on certain majority-female industries, and the fact that construction is a seasonal industry where employment is typically higher during the fall.
Women aged 25 to 29 typically experience higher NEET rates compared to men, due to their greater likelihood of caring for children.Note However, with the increase in men’s NEET rate, the gender gap in NEET for those in the mid to late 20s all but disappeared in September-October 2020, standing at 16% for men aged 25 to 29 and 17% for women.
Start of text box
The “she-cession” among students
An important economic effect of the pandemic on young women that is not captured by the NEET rate is the fall in student employment, and this specifically affected women. Female students are typically more likely to work during their postsecondary studies than male students. The pandemic heavily disrupted this employment. Compared to the start of the 2019/2020 academic year, the employment rate of young women who were attending postsecondary school declined by 8 percentage points, from 56% to 49%Note , while that of young men stayed stable at 45%. The change for women was predominantly due to decreases in employment in the accommodation and food services sector. The trend may be influenced both by employment losses among female students who were already mid-way through their studies at the start of the 2020-21 school year, and by women responding to employment loss during the pandemic by enrolling in new postsecondary studies.
In later months, the second wave of the pandemic brought further declines in employment for young women attending school. This was the main explanation for the second wave’s disproportionate effect on women’s employment.Note In comparison, the employment losses among young non-students and older working-age adults differed comparatively little between the sexes.
These employment losses may affect the ability of young women to finance their education, and the amount of student debt they accrue. In a crowdsourcing questionnaire during spring of 2020, 47%Note of postsecondary student respondents said they were very or extremely concerned about having increased student debt due to the COVID-19 pandemic.Note
End of text box
NEET rate remained stable among young parents, though still higher among mothers
As has been historically the case,Note a significant gender-based difference is observed when children are in the household. In September-October 2020, the NEET rate of mothers aged 25 to 29 was three times higher than those of fathers (30% versus 10%).Note , Note This, however, did not represent a significant year-over-year change in the NEET rate for either young mothers or young fathers, who were primarily caring for pre-school-aged children (aged 0-5).Note
The lack of change in the NEET rates for young parents can be explained by the year-over-year stability in both school attendance and employment.
While there was no significant change in the NEET rate among mothers, they were still more likely than fathers to feel the effects of the pandemic, as evidenced by reduced work hours. In particular, the proportion of mothers working less than half their usual hours increased more during the pandemic than was the case among fathers.Note
NEET gap between immigrant and non-immigrant women widened
Certain population groups are more vulnerable to NEET, and may be more adversely affected by the pandemic restrictions. Previous research has found that immigrant status had an impact on youth NEET rates, with the proportion of youth not in employment or school being higher among landed immigrants aged 15 to 29, compared to their Canadian-born counterparts.Note This was mainly attributed to differences among youth in their late 20s, as labour force participation was lower among landed immigrants than non-immigrants in this age group.
In September-October 2020, the NEET rate had significantly increased from a year earlier for both immigrantNote men and immigrant women aged 15 to 29. Similar increases were seen for young non-immigrant men, while no significant change was recorded among young non-immigrant women.
The divergent patterns observed for young immigrant and non-immigrant women has widened the gap in the NEET rate. The NEET rate stayed steady at 10-11% for non-immigrant women, while it rose from 13% to 17% for immigrant women. Increases in postsecondary attendance among non-immigrant women, and the lack of increase among immigrant women, may partly explain these patterns. Conversely, there was no statistically significant gap in the NEET rate between immigrant men (16%) and non-immigrant men (14%) in September-October 2020.
NEET rate of young women belonging to groups designated as visible minorities was higher compared to young women not belonging to a visible minority group
The NEET rates of youth who belonged to groups designated as visible minorities cannot be compared to 2019, since data on individuals belonging to groups designated as visible minorities were not collected by the LFS until summer 2020. However, they can nonetheless provide insight on the situation of diverse groups of Canadians with regards to work and education during the pandemic.
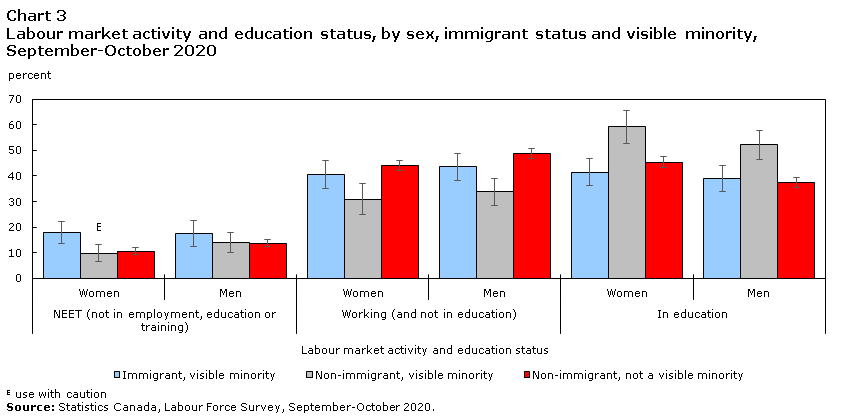
The NEET rate of youth aged 15 to 29 was higher for young women who belonged to groups designated as visible minoritiesNote (14%) than for young women who did not belong to a visible minority group (11%).Note In contrast, there was no significant difference between the NEET rates of young visible minority men (15%) and young men who were not a visible minority (14%).
Among young women belonging to groups designated as visible minorities, the NEET rate varied by immigrant status (Chart 3). In particular, the NEET rate among young visible minority women who were immigrants (18%) was higher than the rate among young Canadian-born visible minority women (10%)Note , who had a rate comparable to same-aged Canadian-born women who were not a visible minority (11%).
There may be important variations between specific visible minority population groups. For instance, some youth from certain population groups may be more likely to be in schools, or working and not in school. However, due to the focus on a specific period of two months, it is not possible to provide disaggregation by all groups designated as visible minority, given small sample size and high sampling variability. Further analysis, using a full year of LFS data, would be needed to examine the NEET patterns among specific population groups designated as visible minority.
Data table for Chart 3
| Labour market activity and education status | Sex | Estimate | 95% Confidence Interval | ||||
|---|---|---|---|---|---|---|---|
| Immigrant, visible minority | Non-immigrant, visible minority | Non-immigrant, not a visible minority | Immigrant, visible minority | Non-immigrant, visible minority | Non-immigrant, not a visible minority | ||
| percent | |||||||
| NEET (not in employment, education or training) | Women | 17.9 | 9.9Note E: Use with caution | 10.7 | 4.3 | 3.4 | 1.3 |
| Men | 17.5 | 14.1 | 13.8 | 5.1 | 3.8 | 1.3 | |
| Working (and not in education) | Women | 40.6 | 31.0 | 44.1 | 5.4 | 6.1 | 2.0 |
| Men | 43.5 | 33.8 | 48.8 | 5.1 | 5.3 | 1.9 | |
| In education | Women | 41.5 | 59.1 | 45.3 | 5.4 | 6.4 | 2.1 |
| Men | 39.0 | 52.1 | 37.4 | 5.0 | 5.6 | 1.9 | |
|
E use with caution Source: Statistics Canada, Labour Force Survey, September-October 2020. |
|||||||
NEET rate remained higher among Indigenous youth
NEET rates among Indigenous youth (aged 15 to 29) living off-reserveNote in the provinces remained higher than those of non-Indigenous youth, as they had been pre-pandemic. In September-October 2020, the NEET rate was 20% for young Indigenous women compared to 12% for non-Indigenous young women, and 21% for young Indigenous men compared to 14% for non-Indigenous young men. The NEET rates were 24-25% for young off-reserve First Nations women and men, and 15-17% for young Métis women and men.
The changes over time in the NEET rates of Indigenous youth need to be confirmed with further analysis, given small sample sizes over a two-month period.Note That said, the proportion of young off-reserve First Nations men who were working and not in school declined significantly, by an estimated 10 percentage points compared to a year earlier. Additionally, though the school attendance rate of young off-reserve First Nations men did not show a statistically significant change due to wide margins of error, its (non-statistically-significant) increase was 7 percentage points. This is a finding worth examining in later analyses using a larger sample of data over a longer period of time, in order to determine if the trend it suggests is valid.
The NEET rate increased among young men in five provinces, and among young women in none
The overall youth NEET rate (aged 15 to 29, both sexes combined) rose significantly in five provinces compared to a year earlier: British Columbia, Alberta, Ontario, Quebec and Nova Scotia. In all of these provinces, the increase was between 2 and 4 percentage points. This represented an improvement from the first wave, where the NEET rate rose by double digits in all provinces between February and April 2020.Note
Reflecting the smaller increase in the national NEET rate for young women, the NEET rates of young women aged 15 to 29 did not increase significantly year-over-year in any province as of September-October 2020. The NEET rates for young men increased in British Columbia, Alberta, Saskatchewan, Ontario and Nova Scotia (Chart 4).

Data table for Chart 4
| Geography | Estimate | 95% Confidence Interval | ||
|---|---|---|---|---|
| Women | Men | Women | Men | |
| percentage point | ||||
| Canada | 1.4 | 4.3 | 1.2 | 1.1 |
| N.L. | -3.4 | 1.7 | 5.9 | 5.3 |
| P.E.I. | 1.3Note E: Use with caution | 2.5Note E: Use with caution | 4.2 | 5.2 |
| N.S. | 1.0 | 7.2 | 4.0 | 5.1 |
| N.B. | 0.2 | 3.3 | 4.1 | 5.0 |
| Que. | 1.6 | 2.3 | 2.5 | 2.6 |
| Ont. | 1.8 | 4.9 | 2.1 | 2.0 |
| Man. | -3.9 | 0.8 | 3.0 | 2.4 |
| Sask. | -2.1 | 3.4 | 3.8 | 2.8 |
| Alta. | 2.8 | 6.0 | 3.4 | 3.5 |
| B.C. | 1.8 | 4.9 | 3.0 | 3.0 |
|
E use with caution Source: Statistics Canada, Labour Force Survey, September-October 2019 and September-October 2020. |
||||
Contrasting overall trends, Manitoba showed some improvements in the NEET rate between the fall of 2019 and 2020, albeit just for women. The NEET rate declined significantly among young women, driven by an increase in their post-secondary enrollment.Note In the case of young men, their rates of participation in post-secondary education also rose, which somewhat offset the decline in the proportion who were working and not in school, resulting in a stability in the male NEET rate in this province.
Young people as likely as their older counterparts to have received COVID-19 benefits
At the outset of the pandemic, the federal government introduced a number of programs to help Canadians adjust to the impact of the COVID-19 economic shutdown. The Canada Emergency Response Benefit (CERB) provided financial support to Canadians who lost employment due to COVID-19, while the Canada Emergency Student Benefit (CESB) was directed at post-secondary students and recent post-secondary and high school graduates who were unable to find work due to COVID-19.
As of September-October 2020, NEET young people were as likely to receive one of the COVID benefits as adults aged 30 to 54 who were not employed.Note An estimated 22% of NEET young women reported having received COVID benefits in the previous month, as did 20% of older-aged women who were not employed.Note Likewise, 26% of NEET young men and 25% of older-aged men who were not employed reported having received COVID benefits in the past month. The gender differences were statistically significant for adults aged 30 to 54, but not for youth aged 15 to 29.
The same was broadly true for government benefits overall (COVID or non-COVID).Note An estimated 37% of NEET young women and 35% of older non-employed women reported having received government benefits in the previous month, as had 41% of NEET young men and 45% of older non-employed men.Note
Non-NEET youth were much less likely to receive benefits than NEET youth. Among non-NEET youth, 8% of men and 9% of women reported having received COVID benefits in the past month (not a significant gender difference), while 9% of men and 13% of women reported having received any government benefits in the previous month (a significant gender difference).Note
Conclusion
At the beginning of the 2020/2021 school year, the impacts of COVID-19 on the youth NEET rate had been substantially reduced from what they were during the April economic shutdown and school closures. In April, the year-over-year increase in the youth NEET rate was in the double digits. By September-October 2020, it was slightly higher for young women (+1 percentage point) compared to a year earlier, and 4 percentage points higher for young men.
The relatively smaller increase in the NEET rate for young women compared to young men in September-October 2020 can be explained by increases in their post-secondary attendance at the start of the 2020/2021 school year, compared to 2019/2020.
Young women’s increase in postsecondary enrolment partially offset their decreases in high school attendance (for those aged 15 to 19) and the proportion working and not in school (aged 20 to 24). Among men, there was no change in postsecondary attendance, while drops were seen for high school attendance, as well as the proportion working and not in school among young men aged 20 to 24 and those aged 25 to 29. As a result of the gender difference trends between the pre-pandemic and pandemic period, young women in September-October 2020 were less likely than young men to be neither employed nor enrolled in school (12% versus 14% for young men). This contrasts the relative gender parity a year earlier (11% for women and 10% for men).
The divergent gendered patterns may have long-term implications on patterns for future economic wellbeing. For instance, given young women’s higher likelihood of enrolment in postsecondary school at the beginning of the 2020/2021 school year, particularly for non-immigrant women, it may be possible that they will see better future labour market outcomes compared to their male counterparts. Further work will be needed to access the differential gender impact of the pandemic interruptions on young people’s ability to successfully transition from high school to post-secondary school, from school to the labour market, or their re-entry into the labour market.
Certain population groups can be more adversely affected by the pandemic, even with the re-opening of schools and the economy. For instance, the NEET gap between immigrant and non-immigrant women widened between the fall of 2019 and 2020, as a result of the increased likelihood of non-immigrant women to enrol in postsecondary education. It would be critically important for research to further assess the impact of the pandemic on NEET rates among immigrant youth, as well as determining the role and impact of the pandemic lockdowns on NEET rates among different population groups.
The NEET rates of young Indigenous women and men, and specifically of young off-reserve First Nations women and men, remained higher than those of non-Indigenous young women and men. The proportion of young First Nations men who were working and not in school decreased by an estimated 10 percentage points. Their school attendance rate may have increased, but the change was not statistically significant and merits investigation with a larger sample size covering a longer period of time than two months.
| Sex and Age Group | NEET (not in employment, education or training) | Working (and not in education) | In education | ||||||
|---|---|---|---|---|---|---|---|---|---|
| Sept-Oct 2019 | Sept-Oct 2020 | Year-over-year change | Sept-Oct 2019 | Sept-Oct 2020 | Year-over-year change | Sept-Oct 2019 | Sept-Oct 2020 | Year-over-year change | |
| percent | percentage points | percent | percentage points | percent | percentage points | ||||
| 15 to 29 | 10.2 | 13.1 | 2.9Note * | 46.7 | 43.4 | -3.3Note * | 43.1 | 43.5 | 0.4 |
| Women | 10.6 | 12.0 | 1.4Note * | 43.3 | 40.2 | -3.1Note * | 46.1 | 47.8 | 1.6Note * |
| Men | 9.9 | 14.2 | 4.3Note * | 49.9 | 46.3 | -3.6Note * | 40.2 | 39.5 | -0.7 |
| 15 to 19 | 5.6 | 6.6 | 1.0Note * | 11.2 | 10.7 | -0.5 | 83.2 | 82.7 | -0.5 |
| Women | 4.8 | 5.1 | 0.3 | 9.5 | 8.3 | -1.2 | 85.7 | 86.6 | 0.8 |
| Men | 6.3 | 8.1 | 1.8Note * | 12.8 | 12.9 | 0.1 | 80.9 | 79.0 | -1.9 |
| 20 to 24 | 11.6 | 15.0 | 3.4Note * | 47.2 | 41.4 | -5.8Note * | 41.2 | 43.6 | 2.5Note * |
| Women | 10.9 | 13.0 | 2.1Note * | 42.2 | 36.2 | -6.0Note * | 46.9 | 50.8 | 3.9Note * |
| Men | 12.3 | 16.9 | 4.6Note * | 51.8 | 46.1 | -5.7Note * | 35.9 | 37.0 | 1.2 |
| 25 to 29 | 12.6 | 16.6 | 3.9Note * | 74.8 | 71.5 | -3.3Note * | 12.6 | 12.0 | -0.6 |
| Women | 15.0 | 16.7 | 1.7 | 71.5 | 69.6 | -1.8 | 13.6 | 13.7 | 0.2 |
| Men | 10.4 | 16.5 | 6.1Note * | 77.9 | 73.2 | -4.7Note * | 11.7 | 10.3 | -1.3 |
|
|||||||||
| Geography and Sex | NEET (not in employment, education or training) | Working (and not in education) | In education | ||||||
|---|---|---|---|---|---|---|---|---|---|
| Sept-Oct 2019 | Sept-Oct 2020 | Year-over-year change | Sept-Oct 2019 | Sept-Oct 2020 | Year-over-year change | Sept-Oct 2019 | Sept-Oct 2020 | Year-over-year change | |
| percent | percentage points | percent | percentage points | percent | percentage points | ||||
| Canada | 10.2 | 13.1 | 2.9Note * | 46.7 | 43.4 | -3.3Note * | 43.1 | 43.5 | 0.4 |
| Women | 10.6 | 12.0 | 1.4Note * | 43.3 | 40.2 | -3.1Note * | 46.1 | 47.8 | 1.6Note * |
| Men | 9.9 | 14.2 | 4.3Note * | 49.9 | 46.3 | -3.6Note * | 40.2 | 39.5 | -0.7 |
| Newfoundland and Labrador | 16.6 | 15.9 | -0.8 | 41.7 | 40.7 | -1.0 | 41.6 | 43.4 | 1.8 |
| Women | 18.0 | 14.5 | -3.4 | 36.3 | 38.1 | 1.8 | 45.7 | 47.3 | 1.6 |
| Men | 15.4 | 17.2 | 1.7 | 46.8 | 43.1 | -3.7 | 37.8 | 39.8 | 2.0 |
| Prince Edward Island | 9.4 | 11.4 | 1.9 | 52.9 | 44.2 | -8.8Note * | 37.6 | 44.5 | 6.8Note * |
| WomenTable 2 Note 1 | 7.4 | 8.7 | 1.3 | 51.5 | 37.7 | -13.8Note * | 41.1 | 53.6 | 12.5Note * |
| MenTable 2 Note 1 | 11.3 | 13.8 | 2.5 | 54.3 | 50.0 | -4.3 | 34.5 | 36.2 | 1.7 |
| Nova Scotia | 11.1 | 15.3 | 4.2Note * | 46.7 | 42.0 | -4.7Note * | 42.2 | 42.7 | 0.5 |
| Women | 10.2 | 11.1 | 1.0 | 45.2 | 43.8 | -1.4 | 44.6 | 45.1 | 0.5 |
| Men | 12.1 | 19.3 | 7.2Note * | 48.1 | 40.3 | -7.9Note * | 39.8 | 40.4 | 0.6 |
| New Brunswick | 12.4 | 14.2 | 1.8 | 49.5 | 47.6 | -1.9 | 38.1 | 38.2 | 0.1 |
| Women | 10.7 | 10.9 | 0.2 | 46.2 | 43.6 | -2.6 | 43.2 | 45.6 | 2.4 |
| Men | 14.0 | 17.4 | 3.3 | 52.7 | 51.5 | -1.2 | 33.2 | 31.1 | -2.1 |
| Quebec | 8.3 | 10.3 | 1.9Note * | 46.2 | 42.0 | -4.3Note * | 45.4 | 47.7 | 2.3Table 2 Note † |
| Women | 7.6 | 9.2 | 1.6 | 41.2 | 37.2 | -4.1Note * | 51.1 | 53.6 | 2.5 |
| Men | 9.0 | 11.3 | 2.3Table 2 Note † | 51.0 | 46.5 | -4.5Note * | 40.0 | 42.2 | 2.2 |
| Ontario | 10.7 | 14.1 | 3.4Note * | 44.7 | 42.5 | -2.2Note * | 44.6 | 43.3 | -1.2 |
| Women | 11.2 | 13.0 | 1.8Table 2 Note † | 42.0 | 39.2 | -2.8Table 2 Note † | 46.8 | 47.9 | 1.1 |
| Men | 10.3 | 15.2 | 4.9Note * | 47.1 | 45.6 | -1.5 | 42.5 | 39.1 | -3.4Note * |
| Manitoba | 12.7 | 11.2 | -1.5 | 49.4 | 46.4 | -3.0Table 2 Note † | 37.9 | 42.4 | 4.5Note * |
| Women | 14.8 | 11.0 | -3.9Note * | 44.1 | 43.8 | -0.3 | 41.1 | 45.3 | 4.2Note * |
| Men | 10.7 | 11.5 | 0.8 | 54.4 | 48.9 | -5.4Note * | 35.0 | 39.6 | 4.7Note * |
| Saskatchewan | 11.7 | 12.5 | 0.8 | 48.0 | 49.0 | 1.0 | 40.3 | 38.6 | -1.8 |
| Women | 14.7 | 12.6 | -2.1 | 41.9 | 43.7 | 1.8 | 43.4 | 43.7 | 0.3 |
| Men | 9.0 | 12.4 | 3.4Note * | 53.6 | 53.9 | 0.3 | 37.5 | 33.8 | -3.7 |
| Alberta | 11.0 | 15.5 | 4.5Note * | 50.6 | 44.8 | -5.8Note * | 38.4 | 39.8 | 1.4 |
| Women | 11.9 | 14.7 | 2.8 | 47.8 | 43.3 | -4.5Table 2 Note † | 40.3 | 41.9 | 1.6 |
| Men | 10.1 | 16.1 | 6.0Note * | 53.2 | 46.1 | -7.1Note * | 36.6 | 37.8 | 1.1 |
| British Columbia | 8.9 | 12.3 | 3.4Note * | 49.2 | 44.9 | -4.3Note * | 41.9 | 42.8 | 0.9 |
| Women | 9.6 | 11.4 | 1.8 | 46.0 | 42.9 | -3.2 | 44.4 | 45.7 | 1.4 |
| Men | 8.3 | 13.2 | 4.9Note * | 52.2 | 46.8 | -5.4Note * | 39.5 | 40.0 | 0.5 |
|
|||||||||
| Characteristics | NEET (not in employment, education or training) | Working (and not in education) | In education | ||||||
|---|---|---|---|---|---|---|---|---|---|
| Sept-Oct 2019 | Sept-Oct 2020 | Year-over-year change | Sept-Oct 2019 | Sept-Oct 2020 | Year-over-year change | Sept-Oct 2019 | Sept-Oct 2020 | Year-over-year change | |
| percent | percentage points | percent | percentage points | percent | percentage points | ||||
| Aged 15 to 29 (Total) | 10.2 | 13.1 | 2.9Note * | 46.7 | 43.4 | -3.3Note * | 43.1 | 43.5 | 0.4 |
| Indigenous identity | |||||||||
| Indigenous population | 18.7 | 20.3 | 1.6 | 43.6 | 39.9 | -3.6 | 37.7 | 39.7 | 2.0 |
| Indigenous women | 20.3 | 19.7 | -0.5 | 36.2 | 36.3 | 0.1 | 43.5 | 43.9 | 0.4 |
| Indigenous men | 17.2 | 21.0 | 3.7 | 50.5 | 43.8 | -6.7Table 3 Note † | 32.3 | 35.3 | 3.0 |
| Non-Indigenous population | 9.9 | 13.0 | 3.1Note * | 46.9 | 43.6 | -3.3Note * | 43.2 | 43.5 | 0.3 |
| Non-Indigenous women | 10.2 | 11.8 | 1.7Note * | 43.6 | 40.4 | -3.2Note * | 46.2 | 47.8 | 1.5Table 3 Note † |
| Non-Indigenous men | 9.6 | 14.0 | 4.4Note * | 50.0 | 46.5 | -3.5Note * | 40.4 | 39.5 | -0.9 |
| Immigrant status | |||||||||
| Immigrants | 11.2 | 16.8 | 5.6Note * | 44.9 | 42.6 | -2.3 | 43.9 | 40.6 | -3.3Table 3 Note † |
| Immigrant women | 13.0 | 17.3 | 4.3Note * | 40.8 | 40.6 | -0.3 | 46.2 | 42.1 | -4.1 |
| Immigrant men | 9.3 | 16.3 | 7.0Note * | 49.2 | 44.5 | -4.8Note * | 41.5 | 39.2 | -2.2 |
| Non-immigrants | 9.8 | 12.2 | 2.3Note * | 47.6 | 43.8 | -3.8Note * | 42.6 | 44.0 | 1.5Note * |
| Non-immigrant women | 9.6 | 10.5 | 1.0Table 3 Note † | 44.2 | 40.8 | -3.4Note * | 46.3 | 48.7 | 2.4Note * |
| Non-immigrant men | 10.1 | 13.7 | 3.6Note * | 50.8 | 46.6 | -4.2Note * | 39.2 | 39.7 | 0.5 |
| Aged 25 to 29 (Total) | 12.6 | 16.6 | 3.9Note * | 74.8 | 71.5 | -3.3Note * | 12.6 | 12.0 | -0.6 |
| Parents (i.e. children under 15 present in household) | 24.8 | 24.0 | -0.8 | 69.3 | 68.3 | -1.0 | 5.8 | 7.7 | 1.9 |
| Mothers | 32.4 | 30.2 | -2.2 | 61.4 | 61.9 | 0.4 | 6.2 | 7.9 | 1.7 |
| FathersTable 3 Note 1 | 8.1 | 9.7 | 1.6 | 86.8 | 83.1 | -3.7 | 5.1 | 7.2 | 2.1 |
|
|||||||||
Start of text box
Data sources, Methods and Definitions
Data sources
The data used in this article come from the Labour Force Survey (LFS). The LFS estimates for September 2020 are for the week of September 13 to 19, and the estimates for October 2020 are for the week of October 11 to 17. The sample is representative of Canada’s population aged 15 and older, excluding persons living on reserves and other Indigenous settlements in the provinces; full-time members of the Canadian Armed Forces; the institutionalized population; and households in extremely remote areas with very low population density. The population of the territories is also excluded from the national estimates. These excluded groups together represent approximately 2% of the population aged 15 and over.
Methods
In the context of the NEET indicator, respondents are divided into three mutually exclusive categories totalling 100%: those who are NEET (not in employment, education or training); those who are attending school (including employed students); and those who are working and not in school. A respondent is deemed to be in school if they attend an educational institution (primary, secondary, trade school, college, CEGEP or university) full-time or part-time. In this article, following OECD methodology, a respondent who attends an “other” school, such as homeschooling, is not deemed to be in school.
NEET rates are usually calculated using the first three months of the year (OECD methodology, for international comparisons) or using the months of September to April for national and interprovincial studies. To measure the impact of the COVID-19 pandemic on NEET rates, monthly estimates, and therefore smaller sample sizes, were used, since there are seasonal pattern in the NEET rate. As a result, the NEET rates in this paper should not be compared to the yearly NEET rates.
If comparing the findings in this article to those of the monthly Labour Force Survey releases in The Daily, note that in this paper “youth” refers to persons aged 15 to 29 (as is customary for the NEET indicator), whereas in the monthly Labour Force Survey releases it refers to persons aged 15 to 24. Also note that the NEET concept of “working and not in school” (which excludes employed students) differs from the LFS concept of “employed” (which includes employed students); the employment rate will therefore always be higher than the proportion of youth working and not in school. Another difference is that the Labour Force Survey mainly makes comparisons to pre-pandemic circumstances (February 2020), with adjustments for seasonality; whereas this article compares September-October 2020 to September-October 2019.
Parenthood is defined based on the presence of at least one child aged 0 to 15 years in the household. The age cut-off at 15 years is because the parenthood concept is used here to determine whether having children who cannot be at home on their own is associated with changes in the NEET rate; however, most parents aged 25 to 29 would have children who were pre-school-age (i.e., 5 or younger).
The variable used for characterizing parenthood (age of youngest child) is only available for people who are either the reference person in their household, or the spouse of the reference person. Respondents with other relationships to the reference person (e.g., son, daughter or sibling) are excluded from the analysis of NEET by parenthood. The household reference person is normally an adult with responsibility for the care or support of the family.
The bootstrap method uses 1000 bootstrap weights to calculate variation in the estimates caused by sampling. The 95% confidence intervals in the estimates of percentage point change are shown by the lines superimposed on the bars in the charts. A change in a rate (NEET rate, school attendance rate, or proportion working and not in school) is statistically significant if the bars do not overlap with the x axis.
Definitions
NEET: Persons who are not in employment, education or training; i.e., not working and not in school.
In school: Persons who are attending, online or in-person, an elementary or secondary school; college, CEGEP, trade school or similar institution; or university. Persons who report attending “other” educational institutions, including homeschooling, are not included in this category.
Parent: An LFS respondent who is either designated as the household reference person or whose spouse is the household reference person, and who lives in a household that includes a child between the ages of 0 and 14 years. This definition also pertains to the use of “mothers” (female parents) and “fathers” (male parents). Almost all parents aged 25 to 29, the group discussed in this article, would have children younger than school-age (i.e., under 5 years).
Visible minority: Refers to whether a person who self-identifies as being a member of a group identified as a visible minority as defined by the Employment Equity Act, which defines visible minorities as “persons, other than Aboriginal peoples, who are non-Caucasian in race or non-white in colour.”
Immigrant: Immigrants are defined as people who are or once were landed immigrants (permanent residents). Those who immigrated during 2020 are excluded from the 2020 analyses, and those who immigrated in 2019 are excluded from the 2019 analysis; this is to control for the fact that the pandemic caused particularly low immigration in 2020. People born outside Canada who are not and have never been landed immigrants are excluded from the immigrant analysis.
Non-immigrant: Non-immigrants are defined as people born in Canada.
End of text box
- Date modified: