
Impact of the COVID-19 pandemic on the NEET (not in employment, education or training) indicator, March and April 2020

Archived Content
Information identified as archived is provided for reference, research or recordkeeping purposes. It is not subject to the Government of Canada Web Standards and has not been altered or updated since it was archived. Please "contact us" to request a format other than those available.
Skip to text
Text begins
Abstract
This fact sheet explores the impact of the COVID-19 pandemic on the NEET (not in employment, education or training) indicator for young Canadians aged 15 to 29 during the first two months of the pandemic. Findings include the following:
- In March and April 2020, NEET rates for young Canadians increased to unprecedented levels. These increases were comparable between men and women and they were similar among the provinces.
- Among Canadians aged 15 to 19, the increase in NEET rates in the early months of the COVID-19 pandemic, when most of the school closures took place, was primarily the result of youth who reported that they were not attending school. It is likely that these closures, as well as the change in the way in which education was delivered, are the reasons why youth reported not attending school. However, as of May 2020, Canadian youth plan to continue their studies in fall 2020, despite the pandemic.
- Among Canadians aged 20 to 24 and 25 to 29, the increase in NEET rates in the first two months of the pandemic was mostly because of a decrease in employment. When highest level of education attained was examined, youth aged 25 to 29 with a trades diploma showed the largest increase in NEET rates.
- During the early months of the pandemic, certain groups typically at higher risk for being NEET (young women with children, immigrant youth and off-reserve Indigenous youth) did not experience greater increases in their NEET rates than the overall population.
Introduction
The proportion of young people who are not in employment, education or training (NEET) is a well-established indicator that has been regularly published by the Organisation for Economic Cooperation and Development (OECD) since the late 1990s (OECD, various years) and by Statistics Canada and the Council of Ministers of Education, Canada (CMEC), since 2009 (Statistics Canada and CMEC, various years). This indicator has been closely monitored by policy-makers as young people who are NEET may be experiencing difficulties transitioning from school to the labour market, and could be at risk for low income and social exclusion.
NEET rates in the wake of the COVID-19 pandemic can provide insight into whether the economic uncertainty generated by the pandemic could cause young people to delay their transition from education to the labour market. In addition, the way education is being delivered (e.g., the shift to online learning) during the pandemic may influence young adults’ decisions to start or continue an education program, which in turn would impact the NEET rate.
This fact sheet examines the impact of the COVID-19 pandemic on the NEET indicator in Canada by exploring monthly Labour Force Survey (LFS) data, from January to April 2020.
In March and April 2020, NEET rates for young Canadians increased to unprecedented levels
Recent LFS results showed that, starting in March 2020, the measures implemented by public health officials across the country in an effort to combat the COVID-19 pandemic had a clear impact on the Canadian labour market. Youth, in particular, experienced the fastest rate of employment decline since they were more likely to hold less secure jobs in hard-hit industries such as accommodation and food services (Statistics Canada 2020a; Statistics Canada 2020b).
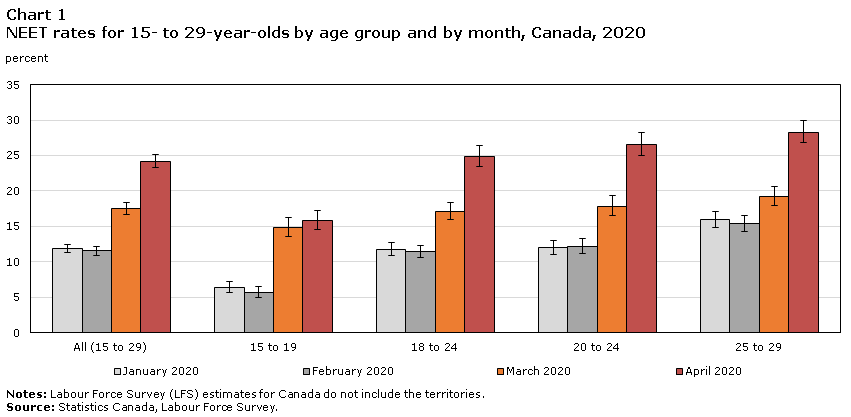
In February 2020, just before the pandemic, the NEET rate for young Canadians aged 15 to 29 was 12%, - a rate similar to that observed in each February in recent years. This rate rose to 18% in March 2020, the first month during which pandemic-related measures were implemented. In April 2020, the NEET rate increased again to reach 24%, the highest rate measured in the past 20 years.Note All age groups typically considered for NEET rate studies (15-29, 15-19, 18-24, 20-24 and 25-29) showed significant increases, with April rates being approximately two to three times higher than those observed in February 2020 (Chart 1 and Table 1).
Data table for Chart 1
| January 2020 | 95% confidence interval down | 95% confidence interval up | February 2020 | 95% confidence interval down | 95% confidence interval up | March 2020 | 95% confidence interval down | 95% confidence interval up | April 2020 | 95% confidence interval down | 95% confidence interval up | |
|---|---|---|---|---|---|---|---|---|---|---|---|---|
| percent | ||||||||||||
| All (15 to 29) | 12 | 1 | 1 | 12 | 1 | 1 | 18 | 1 | 1 | 24 | 1 | 1 |
| 15 to 19 | 6 | 1 | 1 | 6 | 1 | 1 | 15 | 1 | 1 | 16 | 1 | 1 |
| 18 to 24 | 12 | 1 | 1 | 11 | 1 | 1 | 17 | 1 | 1 | 25 | 1 | 1 |
| 20 to 24 | 12 | 1 | 1 | 12 | 1 | 1 | 18 | 1 | 1 | 27 | 2 | 2 |
| 25 to 29 | 16 | 1 | 1 | 15 | 1 | 1 | 19 | 1 | 1 | 28 | 2 | 2 |
|
Notes: Labour Force Survey (LFS) estimates for Canada do not include the territories. Source: Statistics Canada, Labour Force Survey. |
||||||||||||
At the beginning of the pandemic, similar increases in NEET rates were observed across the provinces
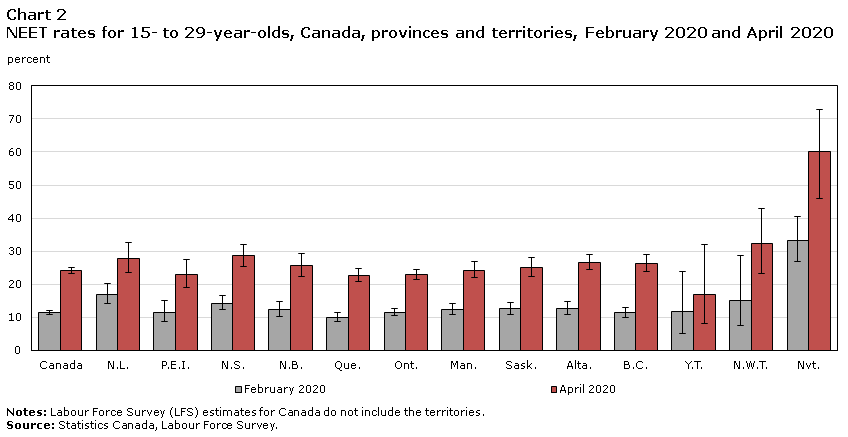
While the nature and timing of strategies to combat the pandemic varied across the country, similar effects on NEET rates were observed across the provinces. In all provinces, NEET rates among Canadians aged 15 to 29 increased substantially from February to April 2020. These increases ranged from +11 percentage points in Newfoundland and Labrador, Prince Edward Island and Ontario to +15 percentage points in British Columbia (Chart 2 and Table 2). In the territories, Nunavut’s NEET rate increased by 27 percentage points while the increases for Yukon and Northwest Territories were not statistically significant.
Data table for Chart 2
| February 2020 | 95% confidence interval down | 95% confidence interval up | April 2020 | 95% confidence interval down | 95% confidence interval up | |
|---|---|---|---|---|---|---|
| percent | ||||||
| Canada | 12 | 1 | 1 | 24 | 1 | 1 |
| N.L. | 17 | 3 | 3 | 28 | 4 | 5 |
| P.E.I. | 12 | 3 | 4 | 23 | 4 | 5 |
| N.S. | 14 | 2 | 2 | 29 | 3 | 3 |
| N.B. | 12 | 2 | 2 | 26 | 3 | 4 |
| Que. | 10 | 1 | 1 | 23 | 2 | 2 |
| Ont. | 12 | 1 | 1 | 23 | 2 | 2 |
| Man. | 13 | 2 | 2 | 24 | 2 | 3 |
| Sask. | 13 | 2 | 2 | 25 | 3 | 3 |
| Alta. | 13 | 2 | 2 | 27 | 2 | 2 |
| B.C. | 11 | 1 | 2 | 26 | 3 | 3 |
| Y.T. | 12 | 6 | 12 | 17 | 9 | 15 |
| N.W.T. | 15 | 8 | 14 | 32 | 9 | 11 |
| Nvt. | 33 | 7 | 7 | 60 | 14 | 13 |
|
Notes: Labour Force Survey (LFS) estimates for Canada do not include the territories. Source: Statistics Canada, Labour Force Survey. |
||||||
Among Canadians aged 20 to 24 and 25 to 29, the increase in NEET rates during the first months of the pandemic was mostly caused by a decrease in employment
Young Canadians aged 15 to 29 are a diverse group and the reasons they may be NEET vary with age, as they transition from primarily being in school, to entering the labour market, and through their early labour market experiences (Brunet 2019).
From February to April 2020, NEET rates increased by +14 percentage points for Canadians aged 20 to 24 and +13 percentage points for those aged 25 to 29. During this period, a decline in employment contributed to most of the increase in NEET ratesNote for these older age groups, with the proportion of employed non-students decreasing by 9 percentage points for those aged 20 to 24 and by 11 percentage points for those aged 25 to 29 (Table 1).
Among Canadians aged 15 to 19, the increase in NEET rates in the early months of the pandemic was primarily because of youth reporting not attending school
In April 2020, the proportion of youth aged 15 to 19 who reported “attending a school, college or university” (Statistics Canada 2020c) during the reference week decreased by 9 percentage points compared with February 2020 (Table 1). This accounted for most of the increase in the NEET rate (+ 10 percentage points) for this age group, which is dominated by students. This decrease was already observed in March 2020, when most of the school closures occurred across the provinces and territories.
It is likely that these closures, as well as the change in the way in which education was delivered, are the reasons why youth reported not attending school, rather than students actually dropping out of their studies. This is supported by the fact that a significant decline is also observed among 15- to 17-years-olds, for whom education is compulsory in the majority of the provinces. However, data from the LFS on school attendance cannot distinguish between young people who are not attending school because they have dropped out and those who did not attend school because of school closures.
Canadian youth plan to continue their studies despite the COVID-19 pandemic
In the context of the pandemic, some young people may be tempted to delay their education because of a drop in income, or because of a change in education delivery (e.g., shift to online learning).Note However, the data show that young Canadians do not intend to stop their studies because of the COVID-19 pandemic.
From May to August, the LFS asks Canadians aged 15 to 24 whether they were full-time students in March and whether they are planning to return to full-time studies in September (Statistics Canada 2020c). The proportion who indicated their intent to return to their studies was similar in May 2020 to what was measured in May of previous years.Note This was observed for both the younger (aged 15 to 19) and the older (aged 20 to 24) age groups, and for both men and women. Actual education participation rates can be measured starting in September 2020.
NEET rates for all levels of education were affected by the COVID-19 pandemic
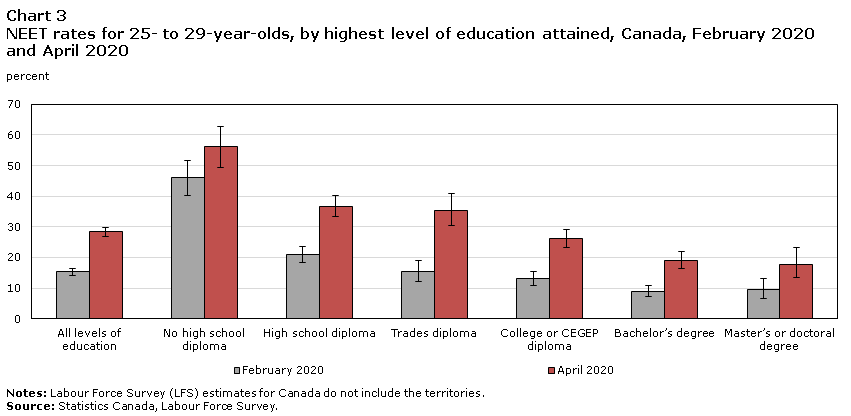
A previous study has shown that youth aged 25 to 29 who have completed postsecondary education are less likely to be NEETNote (Brunet 2018). From February to April 2020, NEET rates for Canadians aged 25 to 29 approximately doubled for all levels of education -- except for those with less than a high school diploma, for whom the increase was not statistically significant (Chart 3 and Table 3). Youth with a trades diploma as their highest level of educational attainment experienced the largest increase in NEET rates (+20 percentage points). This may be related to the fact that individuals with this level of education typically work in occupations where the opportunity to work from home is low (Deng et al 2020).
Data table for Chart 3
| February 2020 | 95% confidence interval down | 95% confidence interval up | April 2020 | 95% confidence interval down | 95% confidence interval up | |
|---|---|---|---|---|---|---|
| percent | ||||||
| All levels of education | 15 | 1 | 1 | 28 | 2 | 2 |
| No high school diploma | 46 | 6 | 6 | 56 | 7 | 7 |
| High school diploma | 21 | 2 | 3 | 37 | 3 | 3 |
| Trades diploma | 15 | 3 | 4 | 35 | 5 | 5 |
| College or CEGEP diploma | 13 | 2 | 2 | 26 | 3 | 3 |
| Bachelor’s degree | 9 | 2 | 2 | 19 | 3 | 3 |
| Master’s or doctoral degree | 9 | 3 | 4 | 18 | 4 | 5 |
|
Notes: Labour Force Survey (LFS) estimates for Canada do not include the territories. Source: Statistics Canada, Labour Force Survey. |
||||||
At the beginning of the pandemic certain groups typically at higher risk for being NEET did not experience a greater increase in NEET rates than the general population
Some groups may have been disproportionately affected by the pandemic in terms of their risk of becoming NEET. For example, school and daycare closures may have had a greater impact on the NEET rates for women compared with men. In April 2020, the NEET rates for women aged 25 to 29 with children were higher than those of men with children. This is typical,Note but NEET rates for these women did not increase more than those of their male counterparts after the school and daycare closures (Table 3). In fact, from February 2020 to April 2020, the NEET rate for men aged 25 to 29 with children increased more (+13 percentage points) than women of the same age with children (+6 percentage points). This is because 25- to-29-year-olds typically have young children, and a higher proportion of women than men were on parental leave.Note Therefore, women aged 25 to 29 with children were less at risk than their male counterparts of losing their job in the early months of the COVID-19 pandemic. Overall, NEET rates for men and women saw similar increases between February and April 2020.
Similar observations were made for other groups of youth who are typically at higher risk for being NEET (Table 3). For example, overall increases in NEET rates were similar between immigrants and non-immigrants, and between youth living in rural areas and those living in population centres. Off-reserve Indigenous youth did not experience a larger increase in NEET rates compared with the total population.
Conclusion
In March and April 2020, pandemic-related measures had exceptional impacts on the Canadian labour market and education systems.
From February to April 2020, NEET rates for young Canadians increased to unprecedented levels. For the older age groups (aged 20 to 24 and 25 to 29), the increase in NEET rates was mostly because of a decrease in employment. For the youngest age group (aged 15 to 19), the increase was primarily because youth reported not attending school, which is likely due to school closures and switch to online learning that occurred during these months. Nevertheless, according to interviews conducted in May 2020, the pandemic did not discourage those who were full-time students in March from planning to continue their full-time studies in fall 2020.
Overall, it was observed that certain groups typically at higher risk for being NEET (young women with children, immigrants and off-reserve Indigenous youth) did not experience a greater increase in NEET rates compared with the overall population. However, youth aged 25 to 29 who had a trades diploma as their highest level of education showed the largest increase in NEET rates among all levels of education attained. This was possibly related to a limited ability to work from home.
As the labour market and education environment continue to evolve throughout the COVID-19 pandemic, it will be important to monitor the NEET rates of young Canadians in the fall of 2020.
Methodology
The data used in this fact sheet are from the Labour Force Survey (Statistics Canada 2020f). The LFS estimates for March 2020 are for the week of March 15 to 21, and the estimates for April 2020 are for the week of April 12 to 18. The sample is representative of Canada’s population aged 15 and older, and each respondent aged 15 and older is classified as employed, unemployed or not in the labour force (inactive).
In the context of the NEET indicator, young people are divided into three mutually exclusive categories totalling 100%: young people who are in school, young people who are employed and no longer in school, and, young people who are NEET (unemployed or not in the labour force, and no longer in school). A respondent is deemed to be in school if they attend an educational institution (primary, secondary, college or university) full-time or part-time. In this fact sheet, following OECD methodology, a respondent who attends an “other” school is not deemed to be in school.
NEET rates are usually calculated using the first three months of the year (OECD methodology, for international comparisons) or using the months of September to April for national and interprovincial studies. To measure the impact of the COVID-19 pandemic on NEET rates, monthly estimates, and therefore smaller sample sizes, were used. The May 2020 data sample is not studied in the analysis, since it may include some summer jobs that are typically excluded in measurements of NEET rates.
The bootstrap method is used to calculate variation in the estimates caused by sampling (i.e. only one sample was used for calculating each estimate; additional samples drawn from the same population may yield slightly different results). The 95% confidence intervals in the percentage estimates are shown by the lines superimposed on the bars in the charts. The gap between two percentages is deemed statistically significant if both intervals are distinct from each other (i.e., they do not overlap).
Although Statistics Canada collects and produces labour force data on the territories using an identical questionnaire as the one used for the provinces, a different methodology is used to produce estimates for the territories, and these data are collected separately from that of the provinces. Hence, the territories are not included in the national estimates (Statistics Canada 2020f).
A respondent with a child is a respondent who is either designated as the household reference person or one whose spouse is the household reference person and lives in a household that includes a child between the ages of 0 and 24 years. The household reference person is normally an adult with responsibility for the care or support of the family (Statistics Canada 2020f).
An immigrant refers to a person who is or has ever been a landed immigrant or permanent resident in Canada. This person has been granted the right to live in Canada permanently by immigration authorities. Some immigrants are Canadian citizens, while others are not (Statistics Canada 2020f).
The Indigenous population is composed of persons who reported being an Aboriginal person, that is, First Nations (North American Indian), Métis or Inuk (Inuit). Excluded from the survey’s coverage are persons living on reserves and other Aboriginal settlements in the provinces, as well as those living in the territories (Statistics Canada 2020f).
A population centre has a population of at least 1,000 and a population density of 400 persons or more per square kilometre, based on the current census population count. All areas outside population centres are classified as rural areas. Taken together, population centres and rural areas cover all of Canada (Statistics Canada 2020f).
Annex - Tables
| In Education | Working (not in Education) | NEET | |||||||
|---|---|---|---|---|---|---|---|---|---|
| February 2020 | April 2020 | Change between February 2020 and April 2020 | February 2020 | April 2020 | Change between February 2020 and April 2020 | February 2020 | April 2020 | Change between February 2020 and April 2020 | |
| rate (%) | percentage points | rate (%) | percentage points | rate (%) | percentage points | ||||
| 15 to 29 | 44 | 39 | -5Note * | 45 | 37 | -8Note * | 12 | 24 | +13Note * |
| Women | 47 | 41 | -5Note * | 43 | 35 | -8Note * | 11 | 24 | +13Note * |
| Men | 41 | 36 | -5Note * | 47 | 39 | -8Note * | 12 | 25 | +12Note * |
| 15 to 19 | 85 | 76 | -9Note * | 10 | 8 | -2 | 6 | 16 | +10Note * |
| Women | 89 | 79 | -10Note * | 7 | 6 | -1 | 4 | 15 | +11Note * |
| Men | 81 | 73 | -8Note * | 12 | 10 | -2 | 7 | 17 | +10Note * |
| 18 to 24 | 50 | 46 | -5Note * | 38 | 29 | -9Note * | 11 | 25 | +13Note * |
| Women | 57 | 51 | -5Note * | 34 | 25 | -9Note * | 9 | 23 | +14Note * |
| Men | 45 | 41 | -4Note * | 42 | 33 | -8Note * | 14 | 26 | +13Note * |
| 20 to 24 | 44 | 39 | -5Note * | 44 | 35 | -9Note * | 12 | 27 | +14Note * |
| Women | 49 | 44 | -5Note * | 41 | 31 | -10Note * | 10 | 26 | +15Note * |
| Men | 39 | 34 | -5 | 47 | 39 | -9Note * | 14 | 28 | +14Note * |
| 25 to 29 | 12 | 10 | -2 | 73 | 61 | -11Note * | 15 | 28 | +13Note * |
| Women | 13 | 11 | -1 | 71 | 60 | -11Note * | 16 | 29 | +13Note * |
| Men | 11 | 9 | -2 | 74 | 63 | -11Note * | 15 | 28 | +13Note * |
Source : Statistics Canada, Labour Force Survey, February and April 2020. |
|||||||||
| NEET rate | ||||
|---|---|---|---|---|
| February 2020 | March 2020 | April 2020 | Change between February 2020 and April 2020 | |
| percent | percentage points | |||
| Canada | ||||
| 15 to 29 | 12 | 18 | 24 | +13Note * |
| 15 to 19 | 6 | 15 | 16 | +10Note * |
| 18 to 24 | 11 | 17 | 25 | +13Note * |
| 20 to 24 | 12 | 18 | 27 | +14Note * |
| 25 to 29 | 15 | 19 | 28 | +13Note * |
| Newfoundland and Labrador | ||||
| 15 to 29 | 17 | 22 | 28 | +11Note * |
| 15 to 19 | 3 | 21 | 19 | +16Note * |
| 18 to 24 | 16 | 21 | 26 | +11 |
| 20 to 24 | 19 | 21 | 28 | +9 |
| 25 to 29 | 28 | 25 | 36 | +8 |
| Prince Edward Island | ||||
| 15 to 29 | 12 | 18 | 23 | +11Note * |
| 15 to 19 | 4 | 16 | 14 | +10 |
| 18 to 24 | 12 | 17 | 23 | +12Note * |
| 20 to 24 | 13 | 17 | 27 | +14Note * |
| 25 to 29 | 17 | 20 | 27 | +10 |
| Nova Scotia | ||||
| 15 to 29 | 14 | 20 | 29 | +14Note * |
| 15 to 19 | 4 | 15 | 16 | +12Note * |
| 18 to 24 | 16 | 20 | 32 | +16Note * |
| 20 to 24 | 19 | 22 | 36 | +17Note * |
| 25 to 29 | 18 | 23 | 31 | +13Note * |
| New Brunswick | ||||
| 15 to 29 | 12 | 20 | 26 | +13Note * |
| 15 to 19 | 4 | 16 | 20 | +16Note * |
| 18 to 24 | 11 | 20 | 25 | +14Note * |
| 20 to 24 | 13 | 20 | 27 | +14Note * |
| 25 to 29 | 20 | 23 | 30 | +10 |
| Quebec | ||||
| 15 to 29 | 10 | 16 | 23 | +13Note * |
| 15 to 19 | 7 | 16 | 16 | +10Note * |
| 18 to 24 | 10 | 16 | 22 | +11Note * |
| 20 to 24 | 11 | 17 | 25 | +14Note * |
| 25 to 29 | 12 | 15 | 25 | +14Note * |
| Ontario | ||||
| 15 to 29 | 12 | 17 | 23 | +11Note * |
| 15 to 19 | 5 | 15 | 13 | +8Note * |
| 18 to 24 | 11 | 16 | 24 | +12Note * |
| 20 to 24 | 12 | 18 | 25 | +13Note * |
| 25 to 29 | 16 | 19 | 28 | +13Note * |
| Manitoba | ||||
| 15 to 29 | 13 | 16 | 24 | +12Note * |
| 15 to 19 | 5 | 10 | 17 | +12Note * |
| 18 to 24 | 13 | 17 | 25 | +12Note * |
| 20 to 24 | 14 | 19 | 26 | +12Note * |
| 25 to 29 | 17 | 18 | 28 | +11Note * |
| Saskatchewan | ||||
| 15 to 29 | 13 | 18 | 25 | +12Note * |
| 15 to 19 | 9 | 17 | 25 | +16Note * |
| 18 to 24 | 15 | 17 | 26 | +11Note * |
| 20 to 24 | 14 | 16 | 24 | +9Note * |
| 25 to 29 | 14 | 19 | 27 | +12Note * |
| Alberta | ||||
| 15 to 29 | 13 | 20 | 27 | +14Note * |
| 15 to 19 | 6 | 12 | 18 | +12Note * |
| 18 to 24 | 11 | 19 | 28 | +17Note * |
| 20 to 24 | 12 | 20 | 28 | +16Note * |
| 25 to 29 | 19 | 25 | 32 | +13Note * |
| British Columbia | ||||
| 15 to 29 | 11 | 18 | 26 | +15Note * |
| 15 to 19 | 7 | 16 | 19 | +12Note * |
| 18 to 24 | 11 | 17 | 29 | +18Note * |
| 20 to 24 | 12 | 17 | 30 | +18Note * |
| 25 to 29 | 15 | 20 | 29 | +14Note * |
| Yukon | ||||
| 15 to 29 | 12 | 20 | 17 | +5 |
| Northwest Territories | ||||
| 15 to 29 | 15 | 30 | 32 | +17 |
| Nunavut | ||||
| 15 to 29 | 33 | 37 | 60 | +27Note * |
Source : Statistics Canada, Labour Force Survey, February, March and April 2020. |
||||
| NEET rate (women and men) |
NEET rate (women) |
NEET rate (men) |
|||||||
|---|---|---|---|---|---|---|---|---|---|
| February 2020 | April 2020 | Change between February 2020 and April 2020 | February 2020 | April 2020 | Change between February 2020 and April 2020 | February 2020 | April 2020 | Change between February 2020 and April 2020 | |
| (%) | percentage points | (%) | percentage points | (%) | percentage points | ||||
| 15 to 29 (Total) | 12 | 24 | +13Note * | 11 | 24 | +13Note * | 12 | 25 | +12Note * |
| Indigenous population | 22 | 31 | +9Note * | 23 | 33 | +10Note * | 20 | 29 | +8 |
| Immigrants | 13 | 27 | +13Note * | 14 | 32 | +17Note * | 12 | 22 | +9Note * |
| Rural areas | 13 | 24 | +11Note * | 13 | 23 | +10Note * | 13 | 25 | +12Note * |
| Population centres | 11 | 24 | +13Note * | 10 | 24 | +13Note * | 12 | 24 | +12Note * |
| 25 to 29 (Total) | 15 | 28 | +13Note * | 16 | 29 | +13Note * | 15 | 28 | +13Note * |
| Children present in household | 25 | 33 | +9Note * | 30 | 37 | +6 | 12 | 26 | +13Note * |
| Educational attainment | |||||||||
| No high school diploma | 46 | 56 | +10 | 55 | 63 | +7 | 39 | 51 | +12 |
| High school diploma | 21 | 37 | +16Note * | 26 | 41 | +16Note * | 18 | 34 | +16Note * |
| Trades diploma | 15 | 35 | +20Note * | 12 | 34 | +22Note * | 17 | 36 | +20Note * |
| College, CEGEP diploma | 13 | 26 | +13Note * | 15 | 28 | +13Note * | 11 | 24 | +13Note * |
| Bachelor's degree | 9 | 19 | +10Note * | 8 | 21 | +13Note * | 10 | 17 | +7Note * |
| Master's or doctoral degree | 9 | 18 | +8Note * | 12 | 18 | +7 | 6 | 17 | +11 |
Source : Statistics Canada, Labour Force Survey, February and April 2020. |
|||||||||
References
Brunet, S. 2018. “The transition from school to work: The NEET (not in employment, education or training) indicator for 25- to 29-year-old women and men in Canada.” Education Indicators in Canada: Fact Sheet, no. 13. Statistics Canada Catalogue no. 81-599-X.
Brunet, S. 2019. “The transition from school to work: The NEET (not in employment, education or training) indicator for 20- to 24-year-olds in Canada.” Education Indicators in Canada: Fact Sheet, no. 14. Statistics Canada Catalogue no. 81-599-X.
Deng Z., R. Morissette and D. Messacar. 2020. “Running the economy remotely: Potential for working from home during and after COVID-19.” StatCan COVID-19: Data to Insights for a Better Canada. Statistics Canada Catalogue no. 45280001.
Organisation for Economic Co-operation and Development (OECD). Various years. “Indicator A2. Transition from education to work: Where are today’s youth?” Education at a Glance: OECD Indicators. OECD Publishing, Paris.
Statistics Canada. 2020a. “Labour Force Survey, March 2020.” The Daily, released on 2020-04-09.
Statistics Canada. 2020b. “Labour Force Survey, April 2020.” The Daily, released on 2020-05-08.
Statistics Canada. 2020c. Labour Force Survey questionnaire, Guide to the Labour Force Survey, Appendix C. Statistics Canada Catalogue no. 71-543-G.
Statistics Canada. 2020d. “COVID-19 Pandemic: Financial impacts on postsecondary students in Canada.” StatCan COVID-19: Data to Insights for a Better Canada. Statistics Canada Catalogue no. 45280001.
Statistics Canada. 2020e. “COVID-19 Pandemic: Academic impacts on postsecondary students in Canada.” StatCan COVID-19: Data to Insights for a Better Canada. Statistics Canada Catalogue no. 45280001.
Statistics Canada. 2020f. Guide to the Labour Force Survey. Statistics Canada Catalogue no. 71-543-G.
Statistics Canada and Council of Ministers of Education, Canada (CMEC). Various years. “Chapter A4, Transitions to the labour market.” Education Indicators in Canada: An International Perspective. Statistics Canada Catalogue no. 81-604-X.
- Date modified: