
The transition from school to work: the NEET (not in employment, education or training) indicator for 20- to 24-year-olds in Canada

Archived Content
Information identified as archived is provided for reference, research or recordkeeping purposes. It is not subject to the Government of Canada Web Standards and has not been altered or updated since it was archived. Please "contact us" to request a format other than those available.
by Sylvie Brunet
Skip to text
Text begins
Start of text box
Highlights
- This fact sheet presents the NEET indicator for young people aged 20 to 24. It is the last in a series of three fact sheets that examine the NEET population in Canada based on the three age groups that are usually considered when studying the transition from school to work (young people aged 15 to 19, 20 to 24, and 25 to 29).
- Data from the Labour Force Survey are used to classify young people according to three mutually exclusive categories: young people in education, young people who work and no longer attend school, and young people who are NEETs, that is, not in employment or education.
- Among young Canadians aged 20 to 24 in 2018/2019, 45% were no longer in school and were working, while 43% were still in school. Women were more likely to be in school than men, whereas men were more likely to be working and no longer in school.
- In 2018/2019, 287,400 young Canadians aged 20 to 24 (12%) were NEETs, with rates ranging between 10% and 17% among the provinces. In each province, the NEET rate was similar for men and women.
- For several years, Canadian women aged 20 to 24 have had lower NEET rates than the average for women of the same age in OECD countries.
- Young people aged 20 to 24 without a high school diploma are particularly at risk of finding themselves in a NEET situation and more likely to be permanently unable to work than those with more schooling. In 2018/2019, 37% of young people who did not have their high school diploma were in a NEET situation, a proportion that was higher among women (47%) than men (30%).
- A low proportion of young people aged 20 to 24 have children, but the presence of children in households significantly affects the participation of women in the labour market.
- Aboriginal youth (excluding those on reserves) have higher NEET rates than youth overall for both women and men. In 2018/2019, the NEET rate for Aboriginal young people aged 20 to 24 was 23%, whereas it was 12% for the overall population of the same age.
- In 2018/2019, immigrants aged 20 to 24 were more likely to be studying and less likely to be employed and no longer in school than non‑immigrants. However, the NEET rates of the two groups were similar. In contrast, the same pattern is not observed among youth aged 25 to 29. For this older age group, immigrant women were more likely than non‑immigrant women to find themselves out of the labour force.
- In 2018/2019, NEET rates of young people aged 20 to 24 were generally not significantly different between population centres and rural areas. However, young people aged 20 to 24 in rural areas were more likely to work and no longer be in school, while the same group in population centres was more likely than rural youth to still be in school.
- Most NEETs aged 20 to 24 who were out of the labour force did not want a job.
- Among Canadians aged 20 to 24, NEETs were more likely than employed young people or students to have a partner who was also NEET. This type of social homogamy could lead to a precarious situation for households in which there are no employed adults.
End of text box
Introduction
Young people who are not in education, employment or training make up what is known as the NEET population. The NEET indicator has been regularly published by the Organisation for Economic Co-operation and Development (OECD) since the late 1990s, as NEET youth may be at risk of low‑income or social exclusion. At Statistics Canada, the NEET indicator has been part of the annual publication "Education Indicators in Canada: An International Perspective" since its creation in 2009.
The NEET indicator focuses on the transition of young people between school and work, and complements more classic indicators such as unemployment rate, employment rate and labour market participation rate. It is intended to quantify the proportion of young people who do not follow a traditional path (i.e., go to school, then get a job) and who find themselves outside of the educational system and without work. Young people are therefore classified according to three mutually exclusive categories: young people who are attending school, young people who are working and no longer attend school, and young people who are NEETs. Young NEETs form a heterogeneous group, and it is important, when possible, to study them based on different age groups (see text box) and type of NEET—unemployed NEETs who are looking for work, and inactive NEETsNote who are not looking for work.
Start of text box
Why study young NEETs by different age groups?
This fact sheet focuses on young NEETs aged 20 to 24. It is the last in a series of three fact sheets that examine the NEET population in Canada based on the three age groups that are usually considered for studying the transition from school to work (people aged 15 to 19, 20 to 24, and 25 to 29).Note
Young people aged 15 to 29 form a heterogeneous group as the relationships that the three age groups have with education and the labour market are very different. The vast majority of those aged 15 to 19 are still in school, those aged 20 to 24 have started their transition from school to the labour market, while the majority of those aged 25 to 29 are working adults. The reasons for which young people are part of the NEET population therefore partly depends on their age group.
For example, the fact sheet that examined NEET youth aged 15 to 19 showed that young people aged 15 and 16 who are not in school when they should be by law have probably left school before receiving a high school diploma, and are therefore particularly vulnerable to future socioeconomic difficulties (Statistics Canada and CMEC 2018). It has also highlighted the fact that there appears to be a relationship between a country’s typical age of high school graduation and the NEET rate of youth aged 15 to 19. In this way, using the group aged 15 to 19 for international comparisons becomes an exercise in comparing the education systems of different countries. The fact sheet that examined NEETs aged 25 to 29 demonstrated that young women aged 25 to 29 with children were four times more likely to be inactive NEETs than women without children (Brunet 2018). Since most young people in this age group have finished their schooling, it becomes relevant to study the relationship between their educational attainment and their NEET rate. This study demonstrated that the higher the level of education, the lower the NEET rate. However, the NEET rates were similar between the different levels of postsecondary education.
End of text box
The NEET indicator is of interest because it can reveal problems in certain systems (education, labour market), populations at risk, or social trends among young people. For example, young unemployed NEETs (those who are actively looking for work) may be in this situation because of difficult economic conditions, precarious previous jobs or because they have inadequate training to meet labour market needs. For their part, inactive NEET young people (who are not looking for work) may be discouraged from looking for work or be permanently unable to work, but they could also have a job that is to start sometime in the future,Note or could be taking a break after their studies, looking after family, travelling, considering going back to school, or involved in other activities.
Certain young people may therefore be in a NEET situation voluntarily and be engaged in productive activities. However, the transition to the labour market is not always easy and it is important to identify the young people who are most at risk of finding themselves in a NEET situation involuntarily, so as to provide them with as much support as possible and to align policies accordingly.
Young NEETs have been the focus of other studies (Marshall 2012; OECD 2017; Institut de la Statistique du Québec 2013; Bourbeau and Pelletier 2019). This fact sheet, which uses recent 2018/2019 data from the Labour Force Survey (LFS), is distinguished by the specific age group it studies, the 20- to 24-year-olds, as well as by its international comparisons and historical trends. In addition to painting an overall picture of young NEETs in this age group, the data, gathered over a period of eight months, make it possible to draw interprovincial comparisons, to further examine the effect of having a high school diploma or not, of being an immigrant, of having disabilities, of residing in a rural area or in a population centre, of belonging to an Aboriginal group and of having children in the household.
This fact sheet is organized as follows. To put things in context, the proportions of young people aged 20 to 24 in education and employment will be examined, as well as their conditions in the labour market. Next, an overall picture of young NEETs of this age will be painted, at the Canada-wide, provincial and territorial levels, as well as among OECD countries. Finally, a number of characteristics of the NEET population will be studied in order to identify groups that may be particularly at risk of finding themselves in a NEET situation. The methodology is found in Annex A1 and a summary table in Annex A2. It should be noted that even if this study focuses mainly on young NEETs aged 20 to 24, it also adds some information on other age groups to provide context or where certain specific characteristics were not covered in the previous fact sheets.
Start of text box
What is the situation of young Canadians aged 20 to 24 with respect to school and the labour market?
In comparison with young people aged 15 to 19, most of whom are in school, and those aged 25 to 29, most of whom are employed, the period from age 20 to 24 is a transition period for Canadian youth. In 2018/2019, 45% of those aged 20 to 24 were out of school and employed, 43% were still in school, and 12% were in a NEET situation, i.e., they were no longer in school, and they were either unemployed (looking for a job) or inactive (not looking for a job). In this age group, women were more likely than men to be in school, while men were more likely to be working and no longer be in school.
At age 20, over 90% of Canadians have a high school diploma, and only a small proportion of those who do not have one at that age will obtain one at a later stage (Chart 1). The vast majority of youth aged 20 to 24 who are still in school are therefore pursuing postsecondary education.

Data table for Chart 1
| Age | Women | Men |
|---|---|---|
| percent | ||
| 15 | 7 | 8 |
| 16 | 9 | 8 |
| 17 | 24 | 22 |
| 18 | 78 | 69 |
| 19 | 92 | 86 |
| 20 | 95 | 90 |
| 21 | 94 | 93 |
| 22 | 94 | 92 |
| 23 | 95 | 93 |
| 24 | 94 | 91 |
| 25 | 96 | 93 |
| 26 | 95 | 93 |
| 27 | 94 | 92 |
| 28 | 95 | 94 |
| 29 | 95 | 92 |
| 30 | 96 | 93 |
|
Notes: Labour Force Survey (LFS) estimates for Canada are derived using the results of the LFS in the provinces; the territories are not included. Source: Statistics Canada, Labour Force Survey, September 2018 to April 2019. |
||
Those who are no longer in school and working are often in their first job after completing their studies and, in general, have limited experience and seniority. Several studies have focused on youth and the labour market (e.g., Bernard 2013; Galarneau et al. 2013; Expert Panel on Youth Employment 2016) and support the idea that the youth employment situation is more difficult and precarious than that of the adult population in general with higher unemployment rates, more frequent lay‑offs, lower wages, more unwanted part‑time work and fewer permanent jobs.
This is reflected in the LFS data. In 2018/2019, among young Canadians aged 20 to 24 who were not at school and who were working part time, 25% were considered involuntary part‑time workers, i.e., they would have liked to work full time and looked for such employment, without success. This was in comparison with 18% for those aged 25 to 29, and 8% for those aged 30 to 64. In terms of job permanence,Note 81% of people aged 20 to 24 who were working and no longer in school held permanent employment, compared with 88% for those aged 25 to 29 and 92% for those aged 30 to 64. Lastly, among youth aged 20 to 24 who were working and not in school, 20% belonged to a union or were covered under a collective agreement, compared with 28% for those aged 25 to 29 and 34% for those aged 30 to 64. Even though employment in early adulthood is more precarious, periods of unemployment among youth are generally shorter than those in the adult population (Bernard 2013) and those in a NEET situation over a long period of time are rare (LaRochelle-Côté 2013).
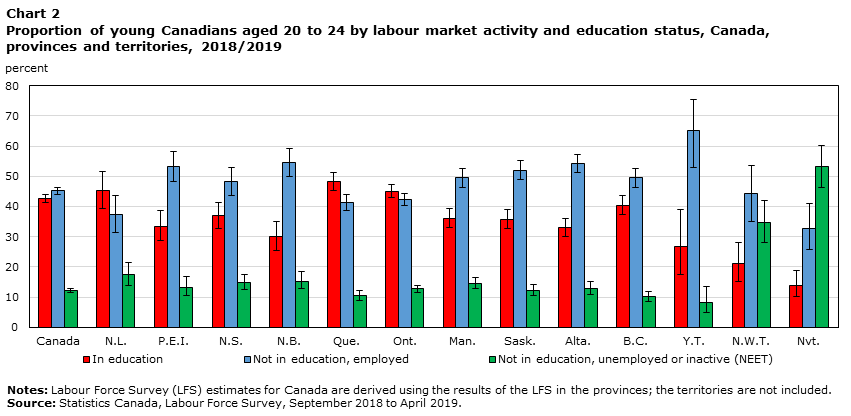
In 2018/2019, activities of young people aged 20 to 24 varied among the provinces and territories (Chart 2 and Table A2.1). For example, in Quebec, a significantly higher proportion of youth aged 20 to 24 were still in education (48%) compared with the Canadian average (43%). In other provinces, youth aged 20 to 24 were more likely to be working and no longer in school. This was the case in Prince Edward Island, New Brunswick, Saskatchewan and Alberta, all four of which posted proportions significantly higher than the Canadian average of 45%. Youth in the same age range living in the Canadian territories were more likely to no longer be in school than Canadian youth overall, which is possibly due to the fact that access to postsecondary education is more difficult in the territories (Conference Board of Canada 2019a). In Yukon, a proportion of young people that is significantly higher than the Canadian average was no longer in school and had a job, which is consistent with the low unemployment rate observed in that territory (Conference Board of Canada 2019b).
Data table for Chart 2
| In education | 95 % confidence interval | Not in education, employed | 95 % confidence interval | Not in education, unemployed or inactive (NEET) | 95 % confidence interval | ||||
|---|---|---|---|---|---|---|---|---|---|
| lower | upper | lower | upper | lower | upper | ||||
| percent | |||||||||
| Canada | 43 | 1.2 | 1.2 | 45 | 1.2 | 1.2 | 12 | 0.7 | 0.7 |
| N.L. | 45 | 6.0 | 6.2 | 37 | 5.8 | 6.2 | 17 | 3.5 | 4.1 |
| P.E.I. | 34 | 4.7 | 5.1 | 53 | 5.0 | 5.0 | 13 | 2.8 | 3.4 |
| N.S. | 37 | 4.3 | 4.6 | 48 | 4.6 | 4.6 | 15 | 2.3 | 2.7 |
| N.B. | 30 | 4.6 | 5.0 | 55 | 4.7 | 4.6 | 15 | 2.6 | 3.0 |
| Que. | 48 | 2.9 | 2.9 | 41 | 2.7 | 2.8 | 10 | 1.6 | 1.8 |
| Ont. | 45 | 2.1 | 2.1 | 42 | 2.0 | 2.0 | 13 | 1.2 | 1.3 |
| Man. | 36 | 3.1 | 3.2 | 49 | 3.2 | 3.2 | 14 | 1.8 | 2.0 |
| Sask. | 36 | 3.1 | 3.2 | 52 | 3.2 | 3.1 | 12 | 1.8 | 2.1 |
| Alta. | 33 | 2.9 | 3.0 | 54 | 3.0 | 3.0 | 13 | 1.9 | 2.2 |
| B.C. | 40 | 3.1 | 3.2 | 49 | 3.1 | 3.1 | 10 | 1.4 | 1.6 |
| Y.T. | 27 | 9.4 | 12.2 | 65 | 12.0 | 10.4 | 8 | 3.4 | 5.4 |
| N.W.T. | 21 | 5.7 | 7.1 | 44 | 9.1 | 9.5 | 35 | 6.6 | 7.3 |
| Nvt. | 14 | 3.7 | 4.8 | 33 | 6.9 | 8.3 | 53 | 6.9 | 6.8 |
|
Notes: Labour Force Survey (LFS) estimates for Canada are derived using the results of the LFS in the provinces; the territories are not included. Source: Statistics Canada, Labour Force Survey, September 2018 to April 2019. |
|||||||||
End of text box
In Canada, 287,400 young people aged 20 to 24 were NEETs in 2018/2019
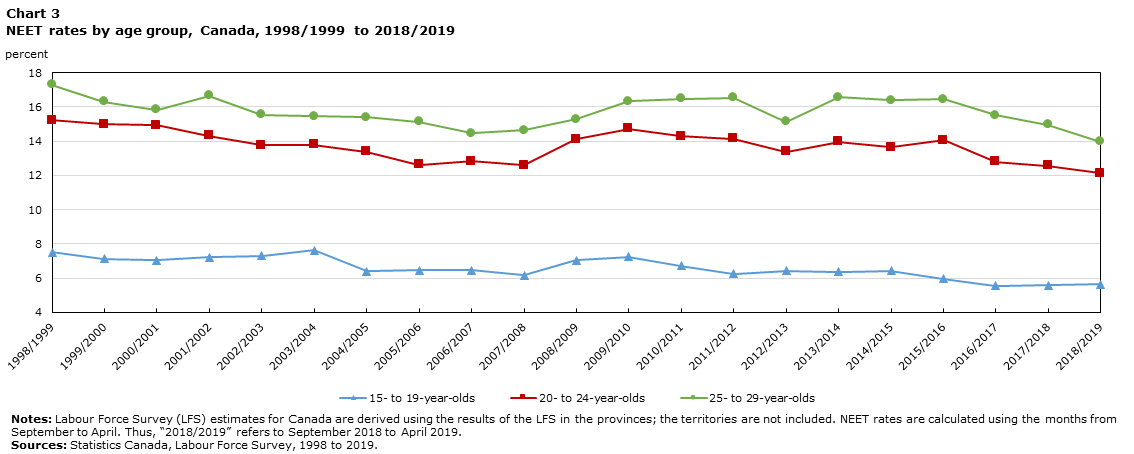
In 2018/2019, 12% of youth across Canada aged 20 to 24, representing 287,400 people, were neither employed nor in school: they were NEET. This NEET rate has ranged between 12% and 15% over the past 20 years (Chart 3). It was at its lowest in 2018/2019, which is a level similar to that observed before the 2008/2009 recession. Among young NEETs aged 20 to 24 in 2018/2019, 60% were inactive NEETs (they were not looking for a job), while 40% were unemployed NEETs (looking for a job).
In order to provide some comparisons, Chart 3 shows the NEET rates of other age groups for the past 20 years. As mentioned in the introduction, young Canadians form a heterogeneous group and it is important to study them by age group when possible. Typically, young people aged 15 to 19 have low NEET rates, since the vast majority of them are in school. People aged 25 to 29 who have, for the most part, completed their studies and transitioned to the labour market post the highest NEET rates year after year among those aged 15 to 29.
Data table for Chart 3
| 15- to 19-year-olds | 20- to 24-year-olds | 25- to 29-year-olds | |
|---|---|---|---|
| percent | |||
| 1998/1999 | 8 | 15 | 17 |
| 1999/2000 | 7 | 15 | 16 |
| 2000/2001 | 7 | 15 | 16 |
| 2001/2002 | 7 | 14 | 17 |
| 2002/2003 | 7 | 14 | 16 |
| 2003/2004 | 8 | 14 | 15 |
| 2004/2005 | 6 | 13 | 15 |
| 2005/2006 | 6 | 13 | 15 |
| 2006/2007 | 6 | 13 | 14 |
| 2007/2008 | 6 | 13 | 15 |
| 2008/2009 | 7 | 14 | 15 |
| 2009/2010 | 7 | 15 | 16 |
| 2010/2011 | 7 | 14 | 16 |
| 2011/2012 | 6 | 14 | 17 |
| 2012/2013 | 6 | 13 | 15 |
| 2013/2014 | 6 | 14 | 17 |
| 2014/2015 | 6 | 14 | 16 |
| 2015/2016 | 6 | 14 | 16 |
| 2016/2017 | 6 | 13 | 16 |
| 2017/2018 | 6 | 13 | 15 |
| 2018/2019 | 6 | 12 | 14 |
|
Notes: Labour Force Survey (LFS) estimates for Canada are derived using the results of the LFS in the provinces; the territories are not included. NEET rates are calculated using the months from September to April. Thus, “2018/2019” refers to September 2018 to April 2019. Sources: Statistics Canada, Labour Force Survey, 1998 to 2019. |
|||
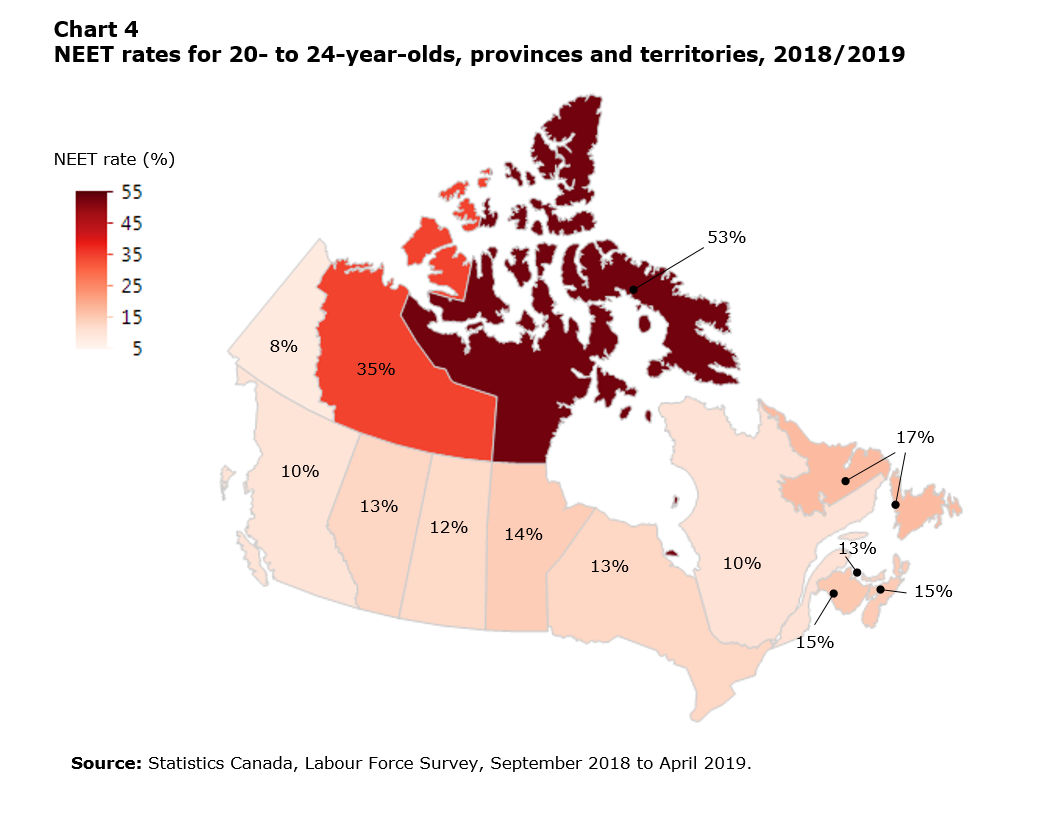
In 2018/2019, among the provinces, NEET rates of young people aged 20 to 24 ranged between 10% and 17%
Among the provinces, in 2018/2019, the NEET rate of youth aged 20 to 24 ranged from 10% (Quebec and British Columbia) to 17% in Newfoundland and Labrador (Chart 4 and Table A2.1). Only Newfoundland and Labrador had significantly higher NEET rate than the national average of 12%. As regards to the territories,Note Nunavut and the Northwest Territories had significantly higher NEET rates than the Canadian average.
Data table for Chart 4
| NEET rates | |
|---|---|
| percent | |
| N.L. | 17 |
| P.E.I. | 13 |
| N.S. | 15 |
| N.B. | 15 |
| Que. | 10 |
| Ont. | 13 |
| Man. | 14 |
| Sask. | 12 |
| Alta. | 13 |
| B.C. | 10 |
| Y.T. | 8 |
| N.W.T. | 35 |
| Nvt. | 53 |
| Source: Statistics Canada, Labour Force Survey, September 2018 to April 2019. | |
In 2018/2019, NEET rates of young people aged 20 to 24 were similar for men and women
In contrast to the 25 to 29-year-old age group, among which women accounted for the majority of NEETs (Brunet 2018), the proportion of women and men represented was similar among young NEETs aged 20 to 24 (Chart 5). However, female NEETs were 2.5 times more likely to be inactive than unemployed, and men were two times more likely than women to be unemployed NEETs.

Data table for Chart 5
| Percent | |
|---|---|
| Women - NEET inactive | 33 |
| Women - NEET unemployed | 13 |
| Men - NEET unemployed | 26 |
| Men - NEET inactive | 27 |
|
Notes: Labour Force Survey (LFS) estimates for Canada are derived using the results of the LFS in the provinces; the territories are not included. Source: Statistics Canada, Labour Force Survey, September 2018 to April 2019. |
|
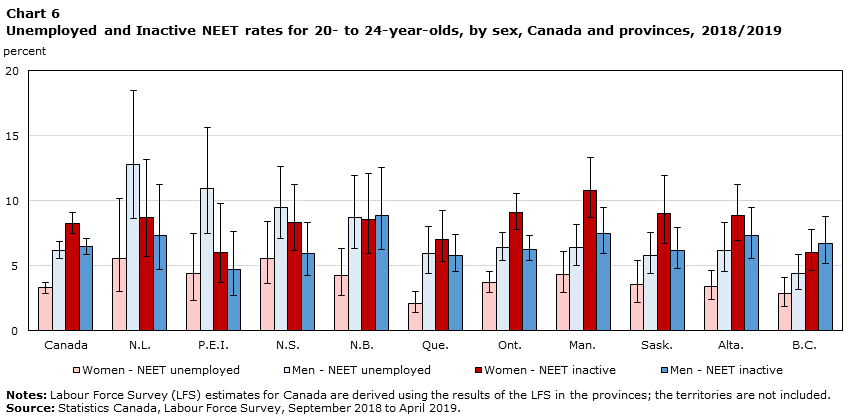
A similar picture was observed in the provinces. In each province, the NEET rate for women did not differ significantly from that of men (Chart 6 and Table A2.1). However, in six out of 10 provinces, NEET women were significantly more likely to be inactive than unemployed,Note and in four out of 10 provinces, men were significantly more likely than women to be unemployed NEETs.Note In contrast with young people aged 25 to 29, only one province—Ontario—had significantly higher inactive NEET rates among women than among men.
Data table for Chart 6
| Women - NEET unemployed | 95% confidence interval | Men - NEET unemployed | 95% confidence interval | Women - NEET inactive | 95% confidence interval | Men - NEET inactive | 95% confidence interval | |||||
|---|---|---|---|---|---|---|---|---|---|---|---|---|
| lower | upper | lower | upper | lower | upper | lower | upper | |||||
| percent | ||||||||||||
| Canada | 3 | 0.4 | 0.4 | 6 | 0.6 | 0.7 | 8 | 0.8 | 0.8 | 6 | 0.6 | 0.6 |
| N.L. | 6 | 2.6 | 4.6 | 13 | 4.1 | 5.7 | 9 | 3.1 | 4.5 | 7 | 2.6 | 3.9 |
| P.E.I. | 4 | 2.1 | 3.1 | 11 | 3.4 | 4.7 | 6 | 2.4 | 3.7 | 5 | 2.0 | 2.9 |
| N.S. | 6 | 1.9 | 2.8 | 10 | 2.4 | 3.1 | 8 | 2.2 | 2.9 | 6 | 1.7 | 2.4 |
| N.B. | 4 | 1.5 | 2.0 | 9 | 2.4 | 3.2 | 9 | 2.6 | 3.6 | 9 | 2.7 | 3.7 |
| Que. | 2 | 0.7 | 0.9 | 6 | 1.6 | 2.1 | 7 | 1.7 | 2.2 | 6 | 1.3 | 1.6 |
| Ont. | 4 | 0.7 | 0.9 | 6 | 1.0 | 1.2 | 9 | 1.3 | 1.5 | 6 | 0.9 | 1.0 |
| Man. | 4 | 1.4 | 1.8 | 6 | 1.4 | 1.8 | 11 | 2.1 | 2.5 | 8 | 1.6 | 2.0 |
| Sask. | 4 | 1.4 | 1.9 | 6 | 1.4 | 1.8 | 9 | 2.3 | 2.9 | 6 | 1.4 | 1.8 |
| Alta. | 3 | 1.0 | 1.3 | 6 | 1.6 | 2.1 | 9 | 1.9 | 2.4 | 7 | 1.7 | 2.2 |
| B.C. | 3 | 1.0 | 1.3 | 4 | 1.2 | 1.5 | 6 | 1.4 | 1.8 | 7 | 1.6 | 2.1 |
|
Notes: Labour Force Survey (LFS) estimates for Canada are derived using the results of the LFS in the provinces; the territories are not included. Source: Statistics Canada, Labour Force Survey, September 2018 to April 2019. |
||||||||||||
Among young people aged 20 to 24, the NEET rate differences between men and women are therefore less pronounced than for those aged 25 to 29, an age group in which motherhood is more prevalent. Nevertheless, as will be seen below, women with children and those with less education are more likely than their male counterparts to be in a NEET situation.
NEET rates for 20- to 24-year-old Canadian women are lower than those for 20- to 24-year-old women at the OECD average
In 2017, the NEET rate for young people aged 20 to 24 in Canada (13%)Note was the 13th lowest rate among the 34 countriesNote that provided data to OECD for that year (Chart 7). The countries that had the lowest OECD NEET rates were Iceland, the Netherlands, Switzerland, Norway and Germany (NEET rates between 6% and 10%), while the countries that had the highest NEET rates were Spain, Mexico, Greece, Italy and Turkey, with NEET rates ranging from 23% to 33%.

Data table for Chart 7
| Country | Women | Men | Women and Men |
|---|---|---|---|
| percent | |||
| Iceland | 5.4 | 5.7 | 5.6 |
| Netherlands | 7.5 | 7.9 | 7.7 |
| Switzerland | 6.9 | 11.3 | 9.1 |
| Norway | 9.9 | 10.3 | 10.1 |
| Germany | 10.8 | 9.4 | 10.1 |
| Luxembourg | 8.5 | 11.9 | 10.2 |
| Sweden | 9.6 | 11.3 | 10.5 |
| Slovenia | 9.9 | 10.9 | 10.5 |
| Czech Republic | 13.7 | 7.5 | 10.5 |
| Australia | 13.0 | 10.2 | 11.5 |
| Austria | 9.7 | 13.9 | 11.8 |
| United Kingdom | 14.2 | 11.7 | 12.9 |
| Canada | 12.1 | 14.2 | 13.2 |
| Estonia | 17.3 | 9.3 | 13.2 |
| New Zealand | 15.9 | 10.8 | 13.3 |
| Denmark | 13.3 | 15.1 | 14.2 |
| United States | 15.9 | 12.6 | 14.2 |
| Ireland | 13.9 | 14.9 | 14.4 |
| Belgium | 13.6 | 16.7 | 15.2 |
| OECD - Average | 17.1 | 14.1 | 15.6 |
| Poland | 18.1 | 13.8 | 15.9 |
| Lithuania | 17.4 | 14.8 | 16.1 |
| Hungary | 19.7 | 12.7 | 16.1 |
| Slovak Republic | 19.3 | 13.7 | 16.5 |
| Finland | 15.8 | 18.1 | 17.0 |
| Portugal | 16.6 | 17.7 | 17.1 |
| Israel | 19.9 | 14.9 | 17.3 |
| Latvia | 22.0 | 18.7 | 20.3 |
| France | 20.0 | 21.5 | 20.7 |
| Chile | 26.4 | 15.0 | 20.7 |
| Spain | 22.5 | 23.9 | 23.2 |
| Mexico | 39.2 | 8.0 | 23.8 |
| Greece | 26.0 | 22.1 | 24.0 |
| Italy | 29.4 | 30.7 | 30.1 |
| Turkey | 47.1 | 18.7 | 32.9 |
|
Notes: At the time of publication, the most recent OECD data were for 2017. Reference year for Chile is 2015. Sources: OECD.Stat. Data were extracted on January 7, 2019, from the section Education at a glance: Transition from school to work, table Trends in the percentage of young adults in education/not in education, employed or not, by age group and gender. |
|||
During the past 20 years, the Canadian NEET rate for those aged 20 to 24 was systematically one to five percentage points lower than the average NEET rate among OECD countries. This is attributable to Canadian women, who have an unemployed NEET rate as well as an inactive NEET rate that is systematically lower than those of the average for women from OECD countries. By contrast, NEET rates for Canadian men are similar to those of the average of their counterparts in OECD countries. Even when considering this observation, Canada is still among the countries where the male-to-female NEET rate differences are relatively small. Some countries, such as Mexico, Turkey and Chile, have large male-to-female NEET rate differences, with women being more likely than men to be NEET (Chart 7).
Young people aged 20 to 24 without a high school diploma are overrepresented among NEETs
Following the overall picture of NEET youth aged 20 to 24 for Canada, the provinces and OECD countries, several characteristics of this population will be studied in order to identify groups that may be more likely to be in NEET.
The first characteristic considered is educational attainment. It was mentioned that, at age 20, most young Canadians have a high school diploma, and that only a very small proportion of those who do not have one will obtain one at a later age (Chart 1). For the past 20 years, the number of young people aged 20 to 24 who have not obtained their high school diploma has continued to decline (Chart 8, dotted line). However, these young people who have not obtained their high school diploma are particularly at risk of being NEET: in 2018/2019, 37% of them were NEET, and this proportion was higher among women (47%) than men (30%). The vast majority of these NEETs without a high school diploma were inactive NEETs (they were not looking for work). During the past 20 years, the NEET rate for these young people was between 31% and 39%(Chart 8).

Data table for Chart 8
| Unemployed NEET rate | Inactive NEET rate | Total NEET rate | Proportion of youth without high school diploma | |
|---|---|---|---|---|
| percent | ||||
| 1998/1999 | 15 | 25 | 39 | 18 |
| 1999/2000 | 13 | 23 | 36 | 18 |
| 2000/2001 | 13 | 24 | 37 | 18 |
| 2001/2002 | 14 | 23 | 36 | 18 |
| 2002/2003 | 14 | 21 | 35 | 18 |
| 2003/2004 | 13 | 22 | 34 | 16 |
| 2004/2005 | 13 | 23 | 35 | 17 |
| 2005/2006 | 11 | 20 | 31 | 16 |
| 2006/2007 | 10 | 21 | 32 | 16 |
| 2007/2008 | 11 | 22 | 33 | 16 |
| 2008/2009 | 13 | 24 | 37 | 15 |
| 2009/2010 | 15 | 22 | 37 | 15 |
| 2010/2011 | 13 | 24 | 38 | 14 |
| 2011/2012 | 12 | 25 | 37 | 14 |
| 2012/2013 | 13 | 23 | 36 | 13 |
| 2013/2014 | 12 | 23 | 35 | 12 |
| 2014/2015 | 12 | 27 | 39 | 12 |
| 2015/2016 | 10 | 27 | 37 | 12 |
| 2016/2017 | 11 | 22 | 33 | 11 |
| 2017/2018 | 8 | 26 | 35 | 10 |
| 2018/2019 | 10 | 27 | 37 | 10 |
|
Notes: Labour Force Survey (LFS) estimates for Canada are derived using the results of the LFS in the provinces; the territories are not included. Source: Statistics Canada, Labour Force Survey, 1998 to 2019. |
||||
Even though their numbers have declined, young people without a high school diploma were overrepresented among NEETs by an overrepresentation factor that varied from 1.8 to 2.1 over the past 20 years.Note Women without a high school diploma are more overrepresented among NEETs than their male counterparts, which is attributable to the high proportion of women without a high school diploma who are inactive NEETs.Note For example, in 2018/2019, the overrepresentation factor for these women was 2.7, whereas, for men, it was 1.8. Young people aged 20 to 24 without a high school diploma, particularly women, are therefore especially at risk of being NEET, which has been the case for many years. These observations highlight the importance of support for students, perseverance in school and educational engagement for young Canadians.
For their part, young people aged 20 to 24 with at most a high school diploma in 2018/2019 were slightly overrepresented among NEETs, and this overrepresentation factor has varied between 1.0 and 1.2 for the past 20 years. Year after year, young people in the same age group with a postsecondary education diploma (trade school, college/CEGEP, university) are underrepresented among NEETs. Little difference was observed between women and men in terms of under- or overrepresentation for levels of education beyond or equivalent to a high school diploma.
Young NEETs aged 20 to 24 without a high school diploma and who are out of the labour force are more likely to be permanently unable to work
Youth aged 20 to 24 without a high school diploma are not only overrepresented among NEETs, as shown in the previous section, but also overrepresented among young people of the same age who report being permanently unable to work.
In 2018/2019, of all inactive NEET young people aged 20 to 24, 12% reported being permanently unable to work. Among those without a high school diploma, this proportion jumps to 18%. Inactive NEET young people without a high school diploma are therefore more likely to have reported being permanently unable to work than the overall inactive NEET population of the same age.
A recent study (Morris et al. 2018) showed that disabilities have an impact on school attendance and employment and that the risk of not being in school or employed increases with the severity of the disability. The article also states that among youth (aged 15 to 24) with disabilities who were neither in school nor employed, 84% had a mental health-related disability, a learning disability, or both and that youth with these types of disabilities are disproportionately affected when it comes to being neither in school nor employed. The article mentions that understanding these disabilities is important, then, for supporting youth in continuing their studiesNote and entering the labour market. Accommodations and support responsive to the various difficulties encountered could help these youth, who are at greater risk of being in the NEET population.
A low proportion of young people aged 20 to 24 have children, but their presence has a significant impact on women’s participation in the labour market
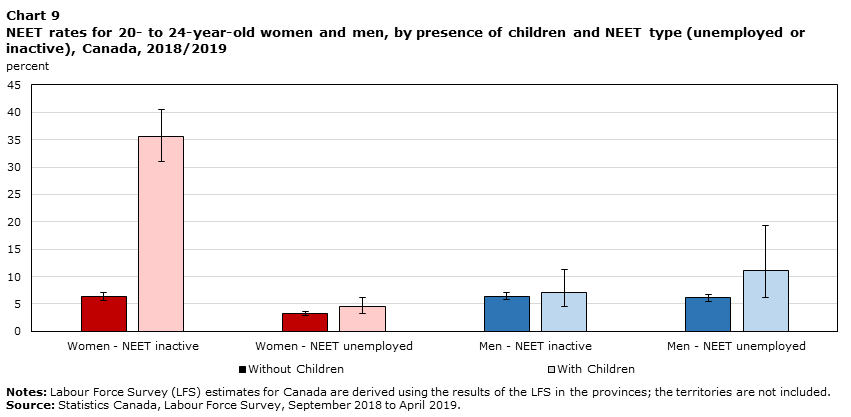
It was observed that the presence of children in the household had a significant effect on the inactive NEET rate for women aged 25 to 29 (Brunet 2018): women with childrenNote were four times more likely to be inactive NEETs than women without children. For young people aged 20 to 24, the effect of the presence of children on the inactivity of women is also significant (Chart 9) and this is also the case in all Canadian provinces. However, only 4% of young people aged 20 to 24 have children in the household, compared with 19% for those aged 25 to 29 (Brunet 2018). The net effect of the presence of children on the participation of women aged 20 to 24 is therefore smaller than that for those aged 25 to 29. However, it remains important for women of this age group with children to have access to the necessary resources (e.g., affordable child care) to avoid finding themselves involuntarily in a NEET situation. The presence of children in the household does not affect the NEET rate for young men. However, men aged 20 to 24 with children are more likely to be working and less likely to be in school than men without children.
Data table for Chart 9
| Women - NEET inactive | 95% confidence interval | Women - NEET unemployed | 95% confidence interval | Men - NEET inactive | 95% confidence interval | Men - NEET unemployed | 95% confidence interval | |||||
|---|---|---|---|---|---|---|---|---|---|---|---|---|
| lower | upper | lower | upper | lower | upper | lower | upper | |||||
| percent | ||||||||||||
| Without Children | 6 | 0.7 | 0.8 | 3 | 0.4 | 0.5 | 6 | 0.6 | 0.6 | 6 | 0.6 | 0.7 |
| With Children | 36 | 4.6 | 4.9 | 5 | 1.3 | 1.7 | 7 | 2.7 | 4.1 | 11 | 5.0 | 8.2 |
|
Notes: Labour Force Survey (LFS) estimates for Canada are derived using the results of the LFS in the provinces; the territories are not included. Source: Statistics Canada, Labour Force Survey, September 2018 to April 2019. |
||||||||||||
It should be noted that there is a link between early parenthood and low educational attainment. Uppal (2017) notes that young adults with lower levels of education are more likely to have children at a young age and that lone parenthood was also higher among women with lower levels of education, which can have an impact on the participation of these women in the labour market.
Start of text box
Most young NEETs aged 20 to 24 who were out of the labour force did not want to work
The information that the LFS gives us on young people who are not in school, are not working and are not looking for work (inactive NEETs) shows that, as was also the case for people aged 25 to 29, nearly seven in ten inactive NEET young people aged 20 to 24 did not want a job. However, the proportions were more similar between men and women aged 20 to 24 (64% - 73%) than for those aged 25 to 29 (56% - 81%, Brunet 2018). This is possibly due to motherhood, which is less common among young people aged 20 to 24.
LFS data do not provide details on the activities of young NEETs. However, for September 2018, additional questions were added to the LFS to examine the main activities of NEETs aged 15 to 29 over the 12‑month period preceding data collection (Bourbeau and Pelletier 2019). While the size of the sample was limited to one month, the study showed that the main activities of young NEETs in the 12 months preceding September 2018 were "going to school" (27%), "working" (26%), "caring for children" (14%), "other activities" (13%), "own illness or disability" (12%) and "looking for paid work" (8%). This means that more than half of young NEETs in September 2018 reported working or being in school as their main activity in the previous 12 months; therefore, they had not been in NEET for a long period of time.
End of text box
Immigrants aged 20 to 24 are more likely to be in school than non-immigrants
Immigrant status can have an impact on youth labour force participation. It was observed in Bourbeau and Pelletier (2019) that NEET rates were higher for landed immigrants aged 15 to 29 than for the Canadian-born of the same age, and that this was due to the high NEET rate for immigrants aged 25 to 29. This observation can be taken further by examining the age groups, sexes, and types of NEETs (unemployed or inactive) separately.
In 2018/2019, it was observed among young people aged 20 to 24, similar to those aged 15 to 19,Note that young immigrants were more likely to be in school and less likely to be working and to have left school than non-immigrants, for both women and men. However, NEET rates for these two age groups were similar between immigrants and non-immigrants.
However, when looking at youth aged 25 to 29, it is observed that the proportion of inactive NEET young people is significantly higher among immigrants than non-immigrants. This difference is attributable to immigrant women, whose inactive NEET rate (16%) is significantly higher that of non-immigrant women (10%), which could be related to motherhood. Moreover, Bourbeau and Pelletier (2019) note that immigrants who were NEET were more likely than non-immigrants to have reported caring for children as their main activity in the previous 12 months.
Aboriginal youth (excluding those on reserves) have higher NEET rates than youth overall
Aboriginal people are more likely than non-Aboriginal people to encounter difficulties in the labour market: their unemployment rates are typically higher, and their participation rates lower (Moyser 2017). This is also reflected in the NEET indicator.
The LFS provides data on Aboriginal people (First Nations, Métis and Inuit)Note living off-reserve. For the past 10 years, for all age groupsNote and for both men and women, Aboriginal youth have had significantly higher unemployed and inactive NEET rates than the overall population (Chart 10). The high NEET rates for Aboriginal people are offset by lower rates of youth in education for the first two age groups (people aged 15 to 19 and 20 to 24), and by lower proportions of Aboriginal youth aged 25 to 29 who were working and no longer in school.

Data table for Chart 10
| 15- to 19-year-olds, Aboriginal population | 95% confidence interval | 20- to 24-year-olds, Aboriginal population | 95% confidence interval | 25- to 29-year-olds, Aboriginal population | 95% confidence interval | 15- to 19-year-olds, total population | 95% confidence interval | 20- to 24-year-olds, total population | 95% confidence interval | 25- to 29-year-olds, total population | 95% confidence interval | |||||||
|---|---|---|---|---|---|---|---|---|---|---|---|---|---|---|---|---|---|---|
| lower | upper | lower | upper | lower | upper | lower | upper | lower | upper | lower | upper | |||||||
| percent | ||||||||||||||||||
| 2007/2008 | 12 | 2 | 2 | 23 | 3 | 3 | 24 | 3 | 4 | 6 | 0.3 | 0.4 | 13 | 0.6 | 0.6 | 15 | 0.7 | 0.7 |
| 2008/2009 | 12 | 2 | 2 | 27 | 3 | 4 | 27 | 3 | 4 | 7 | 0.4 | 0.4 | 14 | 0.6 | 0.6 | 15 | 0.6 | 0.7 |
| 2009/2010 | 13 | 2 | 2 | 26 | 3 | 3 | 31 | 4 | 4 | 7 | 0.4 | 0.4 | 15 | 0.6 | 0.7 | 16 | 0.7 | 0.7 |
| 2010/2011 | 12 | 2 | 2 | 31 | 4 | 4 | 33 | 4 | 4 | 7 | 0.4 | 0.4 | 14 | 0.6 | 0.6 | 16 | 0.7 | 0.7 |
| 2011/2012 | 11 | 1 | 2 | 25 | 3 | 4 | 28 | 3 | 4 | 6 | 0.4 | 0.4 | 14 | 0.8 | 0.8 | 17 | 0.7 | 0.8 |
| 2012/2013 | 13 | 2 | 2 | 25 | 3 | 3 | 27 | 4 | 4 | 6 | 0.4 | 0.4 | 13 | 0.6 | 0.6 | 15 | 0.6 | 0.7 |
| 2013/2014 | 11 | 2 | 2 | 24 | 3 | 3 | 29 | 4 | 4 | 6 | 0.4 | 0.4 | 14 | 0.6 | 0.7 | 17 | 0.7 | 0.7 |
| 2014/2015 | 12 | 2 | 2 | 24 | 3 | 3 | 29 | 3 | 4 | 6 | 0.4 | 0.4 | 14 | 0.6 | 0.6 | 16 | 0.7 | 0.7 |
| 2015/2016 | 11 | 2 | 2 | 25 | 3 | 3 | 33 | 4 | 4 | 6 | 0.4 | 0.4 | 14 | 0.7 | 0.7 | 16 | 0.7 | 0.7 |
| 2016/2017 | 11 | 2 | 2 | 25 | 3 | 3 | 28 | 3 | 4 | 6 | 0.4 | 0.4 | 13 | 0.6 | 0.6 | 16 | 0.7 | 0.7 |
| 2017/2018 | 11 | 2 | 2 | 23 | 3 | 3 | 23 | 3 | 4 | 6 | 0.4 | 0.4 | 13 | 0.6 | 0.7 | 15 | 0.7 | 0.7 |
| 2018/2019 | 11 | 2 | 3 | 23 | 3 | 3 | 25 | 3 | 4 | 6 | 0.4 | 0.4 | 12 | 0.7 | 0.7 | 14 | 0.7 | 0.7 |
|
Notes: Labour Force Survey (LFS) estimates for Canada are derived using the results of the LFS in the provinces; the territories are not included. Source: Statistics Canada, Labour Force Survey, 2007 to 2019. |
||||||||||||||||||
In 2018/2019, among youth aged 20 to 24, the age group of interest for this fact sheet, the NEET rate for Aboriginal people was 23%, compared with 12% for the national population of the same age. Over the past 10 years, NEET rates for Aboriginal people in this age group have varied between 23% and 31%, peaking after the 2008/2009 recession (Chart 10).
In 2018/2019, NEET rates were not significantly different between population centres and rural areas
Young people could have more or less difficulty entering the labour market, depending on whether their place of residence was in a rural area or a population centre. The unemployed and inactive NEET rates for women and men aged 20 to 24 were thus compared between population centres and rural areas in Canada and in the provinces for the year 2018/2019. No significant difference was observed, with the exception of Manitoba, where women in rural areas were more likely to be inactive NEETs than women residing in population centres.
Although the NEET rates of youth aged 20 to 24 were similar between rural areas and population centres, it is noted that young people of this age in rural areas were more likely to be working and no longer in school, and those in population centres were more likely than rural youth to be in school.
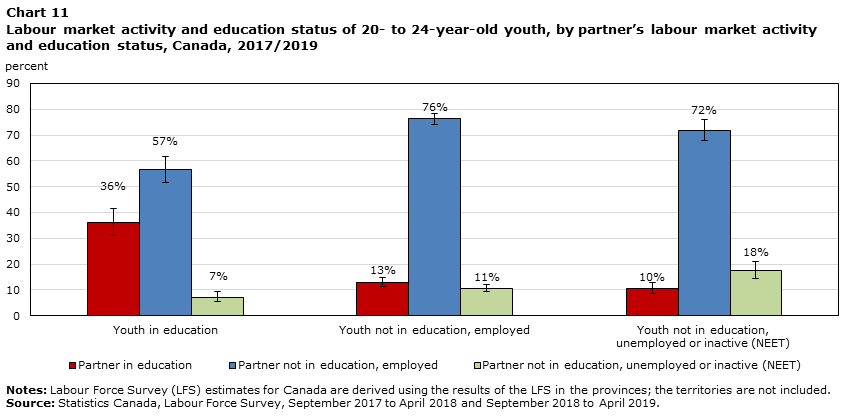
Young NEETs aged 20 to 24 are more likely than young employed people or students to have a partner who is also NEET
Homogamy, which is the tendency of seeking a partner in the social group to which one belongs, is observed among those aged 20 to 24 (Chart 11), as it was among those aged 25 to 29 (Brunet 2018). Thus, even if the majority of their partners are working adults, the respondents in the NEET category are more likely to have a NEET partnerNote (18%) than the respondents who are not in school and employed (11%) or who are in school (7%).Note This could lead to a precarious income situation for households in which there are no employed adults.
Data table for Chart 11
| Youth in education | 95% confidence interval | Youth not in education, employed | 95% confidence interval | Youth not in education, unemployed or inactive (NEET) |
95% confidence interval | ||||
|---|---|---|---|---|---|---|---|---|---|
| lower | upper | lower | upper | lower | upper | ||||
| percent | |||||||||
| Partner in education | 36 | 6 | 6 | 13 | 2 | 2 | 10 | 2 | 3 |
| Partner not in education, employed | 57 | 6 | 5 | 76 | 2 | 2 | 72 | 5 | 4 |
| Partner not in education, unemployed or inactive (NEET) | 7 | 2 | 2 | 11 | 1 | 1 | 18 | 3 | 4 |
|
Notes: Labour Force Survey (LFS) estimates for Canada are derived using the results of the LFS in the provinces; the territories are not included. Source: Statistics Canada, Labour Force Survey, September 2017 to April 2018 and September 2018 to April 2019. |
|||||||||
Conclusion
This fact sheet helps to better understand the situation of young NEETs aged 20 to 24 in Canada. The NEET rate, which is complementary to other, more traditional rates (unemployment rate, employment rate and participation rate), quantifies the proportion of young people who are not in school or employed. This indicator may reveal populations who are at risk of low‑income or social exclusion. It is therefore important to identify and support young people who may involuntarily find themselves in this situation.
In 2018/2019, 287,400 or approximately 12% of Canadians aged 20 to 24 were young NEETs. For the same period, the NEET rate among the provinces was between 10% and 17%. During the past 20 years, the Canadian NEET rate for those aged 20 to 24 was systematically one to five percentage points lower than the average NEET rate among OECD countries. This is attributable to Canadian women, who have an unemployed NEET rate as well as an inactive NEET rate that is systematically lower than those of the average for women from OECD countries.
This study indicates that young people aged 20 to 24 without a high school diploma are overrepresented among NEETs. In 2018/2019, 47% of young women and 30% of young men aged 20 to 24 who did not have a high school diploma were in a NEET situation, with the vast majority of them being inactive NEETs. It has also been shown that young inactive NEETs without a high school diploma are more likely to be permanently unable to work, and that according to Morris et al. (2018), most young people with a disability who are neither in school nor employed have a mental health-related disability, a learning disability, or both. Young NEETs aged 20 to 24 without a high school diploma are therefore identified as being a population particularly at risk of finding themselves in a NEET situation. It would be important to understand the difficulties encountered by these young people throughout their educational career to adequately support them and to align the policies accordingly.
In general, fewer differences were found between the NEET rates of 20- to 24-year-old women and men than was the case for 25- to 29-year-olds. In fact, across the country as well as in each province, women aged 20 to 24 were not more likely to be in a NEET situation than men, which is possibly related to the fact that motherhood is less frequent among those aged 20 to 24. However, the presence of children has an impact that is just as significant on the inactivity of women in this age group.
This study also shows that Aboriginal youth living off‑reserve aged 20 to 24 have higher NEET rates than young Canadians of the same age overall, both for men and women. As for immigrants in this age group, they are more likely to be in school than non‑immigrants, but their NEET rates are not higher, as opposed to those aged 25 to 29, among whom immigrant women are more likely than non‑immigrant women to be inactive NEETs.
Generally, NEET rates of young people aged 20 to 24 were not significantly different between population centres and rural areas. However, young people in rural areas were more likely to be working and no longer in school, while youth in population centres were more likely than rural youth to remain in school.
This study also shows that young NEETs aged 20 to 24 were more likely to have a partner who was also NEET than 20- to 24-year-olds who were students or working. This could lead to a precarious situation for households in which there are no employed adults. Also, as observed among those aged 25 to 29, almost 70% of inactive NEETs aged 20 to 24 did not want to work, but this proportion was more balanced between men and women aged 20 to 24 than it was for those aged 25 to 29.
For future research, it would be interesting to better understand the reasons why young people aged 20 to 24 did not obtain their high school diploma, as these youth are particularly at risk of finding themselves in a NEET situation. It would also be interesting to understand in more detail some of the gender differences for these young people aged 20 to 24, such as the fact that women generally have a lower unemployment NEET rate than men, that they are more likely to be in school while men are more likely to have left school and be working, or the fact that NEET rates for women in Canada are systematically lower than the OECD average, which is not observed for men.
Annexes
Annex A1 – Definitions and methodology
The data used in this fact sheet are from the Labour Force Survey (LFS) and the definitions found in this section are from the Guide to the LFS (Statistics Canada, 2018). The sample is representative of Canada’s population aged 15 years and older, and each respondent aged 15 and over is classified as employed, unemployed or not in the labour force (inactive).
- Employed persons (who have a job) are "those who, during the reference week, did any work for pay or profit, or had a job and were absent from work", including women on maternity leave. It should be noted that the months from May to August are not used in this fact sheet to exclude summer jobs.
- Unemployed persons "are those who, during reference week, were without work, were available for work and were either on temporary layoff, had looked for work in the past four weeks or had a job to start within the next four weeks."
- Not in the labour force (inactive) are "Persons who were neither employed nor unemployed during the reference period. This includes persons who, during the reference period, were either unable to work or unavailable for work. It also includes persons who were without work and who had neither looked for work in the past four weeks nor had a job to start within four weeks of the reference period." Those not in the labour force include persons who are permanently unable to work.
- A respondent is deemed to be in school if they attend an educational institution (primary, secondary, college or university) full- or part-time. Based on OECD methodology, a respondent who attends an "other" school is not deemed to be in school in this fact sheet.
Therefore, NEET individuals are those who are not in school and not employed (either inactive or unemployed).
A respondent with a child is a respondent who is either designated as the household reference person or one whose spouse is the household reference person and there is a child between the ages of 0 and 24 years living in the household. The household reference person is "normally an adult with responsibility for the care or support of the family".
An immigrant “refers to a person who is or has ever been a landed immigrant or permanent resident in Canada. This person has been granted the right to live in Canada permanently by immigration authorities. Some immigrants are Canadian citizens, while others are not."
The Aboriginal population is composed of "persons who reported being an Aboriginal person, that is, First Nations (North American Indian), Métis or Inuk (Inuit). Excluded from the survey’s coverage are persons living on reserves and other Aboriginal settlements in the provinces, as well as those living in the territories."
"A population centre has a population of at least 1,000 and a population density of 400 persons or more per square kilometre, based on the current census population count. All areas outside population centres are classified as rural areas. Taken together, population centres and rural areas cover all of Canada."
"Part-time employment consists of persons who usually work less than 30 hours per week at their main or only job." In this fact sheet, involuntary part-time workers represent "respondents who work part-time because they could not find work with 30 or more hours or because business conditions do not permit it, and who looked for full-time work during the past four weeks."
"A permanent job is one that is expected to last as long as the employee wants it, business conditions permitting. That is, there is no pre-determined termination date."
In international comparisons, NEET rates are calculated using only the first three months of the reference year, in accordance with OECD methodology. For national and interprovincial studies, unless stated otherwise, NEET rates are calculated using the months from September to April in order to maximize the sample size. Thus, "2018/2019" refers to September 2018 to April 2019.
The bootstrap method is used to calculate uncertainties and includes sampling uncertainties. Uncertainty bars on the percentages in this document correspond to the 95% confidence interval. The gap between two percentages is deemed significant if both intervals are distinct from one another and do not overlap.
The level of education corresponds to the highest level of schooling completed by a person. These levels are based on the International Standard Classification of Education ISCED-2011 (UNESCO Institute of Statistics, 2013). Table A1.1 shows the link between the terms used in this fact sheet, the Labour Force Survey terminology, and the ISCED-2011.
| In this document | Labour Force Survey | International Standard Classification of Education (ISCED-2011) |
|---|---|---|
| Below a high school diploma | Grade 8 or lower (Quebec: Secondary II or lower) Grade 9 to 10 (Quebec: Secondary III or IV, Newfoundland and Labrador: 1st year of secondary) Grade 11 to 13 (Quebec: Secondary V, Newfoundland and Labrador: 2nd to 4th year of secondary) (non-graduate) |
ISCED 0: Early childhood education/Pre-primary education ISCED 1: Primary education ISCED 2: Lower secondary education |
| High school diploma | Grade 11 to 13 (Quebec: Secondary V, Newfoundland and Labrador: 2nd to 4th year of secondary) (graduate) Some postsecondary education (non-graduate) |
ISCED 3: Upper secondary education |
| Trades diploma | Trade certificate or diploma from a vocational school or apprenticeship training | ISCED 4: Postsecondary non-tertiary education |
| College or CEGEP diploma | Non-university certificate or diploma from a community college, CEGEP, school of nursing, etc. University certificate below bachelor’s level |
ISCED 5: Short-cycle tertiary education |
| Bachelor’s degree | Bachelor’s degree | ISCED 6: Bachelor’s or equivalent level |
| Master’s or doctoral degree | University degree or certificate above bachelor’s degree | ISCED 7: Master’s or equivalent level ISCED 8: Doctoral or equivalent level. |
| Sources: UNESCO Institute for Statistics, International Standard Classification of Education (ISCED) 2011, 2013; Statistics Canada, Guide to the Labour Force Survey, Catalogue no. 71-543-G, 2016. | ||
Annex A2 – Proportion of youth aged 20 to 24 by their labour market activity and education status, by sex and other characteristics, 2018/2019.
| In education | Working (not in education) | Unemployed NEETs | Inactive NEETs | Total NEETs | |||||||||||
|---|---|---|---|---|---|---|---|---|---|---|---|---|---|---|---|
| Men and women | Men | Women | Men and women | Men | Women | Men and women | Men | Women | Men and women | Men | Women | Men and women | Men | Women | |
| number | |||||||||||||||
| Canada (Total) | 1,010,700 | 469,200 | 541,500 | 1,073,000 | 595,900 | 477,200 | 113,800 | 75,600 | 38,200 | 173,600 | 78,800 | 94,800 | 287,400 | 154,400 | 133,000 |
| percent (rate) | |||||||||||||||
| Canada (Total) | 43 | 38 | 47 | 45 | 49 | 41 | 5 | 6 | 3 | 7 | 6 | 8 | 12 | 13 | 12 |
| N.L. | 45 | 40 | 51 | 37 | 40 | 34 | 9 | 13 | 6 | 8 | 7 | 9 | 17 | 20 | 14 |
| P.E.I. | 34 | 27 | 42 | 53 | 58 | 48 | 8 | 11 | 4 | 5 | 5 | 6 | 13 | 16 | 10 |
| N.S. | 37 | 29 | 45 | 48 | 56 | 41 | 8 | 10 | 6 | 7 | 6 | 8 | 15 | 15 | 14 |
| N.B. | 30 | 26 | 34 | 55 | 56 | 53 | 7 | 9 | 4 | 9 | 9 | 9 | 15 | 18 | 13 |
| Que. | 48 | 44 | 52 | 41 | 44 | 39 | 4 | 6 | 2 | 6 | 6 | 7 | 10 | 12 | 9 |
| Ont. | 45 | 41 | 49 | 42 | 46 | 38 | 5 | 6 | 4 | 8 | 6 | 9 | 13 | 13 | 13 |
| Man. | 36 | 33 | 40 | 49 | 53 | 45 | 5 | 6 | 4 | 9 | 8 | 11 | 14 | 14 | 15 |
| Sask. | 36 | 32 | 40 | 52 | 56 | 47 | 5 | 6 | 4 | 8 | 6 | 9 | 12 | 12 | 13 |
| Alta. | 33 | 29 | 37 | 54 | 58 | 50 | 5 | 6 | 3 | 8 | 7 | 9 | 13 | 14 | 12 |
| B.C. | 40 | 36 | 45 | 49 | 53 | 46 | 4 | 4 | 3 | 6 | 7 | 6 | 10 | 11 | 9 |
| Level of education | |||||||||||||||
| Less than high school | 17 | 17 | 19 | 46 | 53 | 34 | 10 | 12 | 7 | 27 | 19 | 40 | 37 | 30 | 47 |
| High school | 52 | 46 | 58 | 37 | 41 | 31 | 4 | 6 | 3 | 7 | 7 | 8 | 12 | 13 | 11 |
| Postsecondary | 36 | 32 | 39 | 56 | 59 | 53 | 4 | 5 | 3 | 4 | 3 | 5 | 8 | 9 | 8 |
| Other characteristics | |||||||||||||||
| Aboriginal population | 27 | 18 | 36 | 50 | 57 | 44 | 9 | 12 | 6 | 14 | 13 | 15 | 23 | 25 | 20 |
| Immigrants | 50 | 46 | 55 | 37 | 42 | 32 | 5 | 7 | 3 | 7 | 5 | 10 | 12 | 12 | 13 |
| Children present in household | 18 | 10 | 20 | 47 | 72 | 40 | 6 | 11 | 5 | 29 | 7 | 36 | 35 | 18 | 40 |
| Rural areas | 32 | 25 | 38 | 54 | 60 | 47 | 6 | 7 | 4 | 9 | 8 | 10 | 15 | 15 | 15 |
| Population centres | 44 | 40 | 48 | 44 | 47 | 41 | 5 | 6 | 3 | 7 | 6 | 8 | 12 | 12 | 11 |
|
Notes: Labour Force Survey (LFS) estimates for Canada are derived using the results of the LFS in the provinces; the territories are not included. Estimates are rounded to the nearest hundred. Totals may not add up due to rounding. Source: Statistics Canada, Labour Force Survey, September 2018 to April 2019. |
|||||||||||||||
References
Arim, R. and Frenette, M. 2019. Are Mental Health and Neurodevelopmental Conditions Barriers to Postsecondary Access?, Statistics Canada Catalogue no. 11F0019M, no. 417.
Bernard, A. 2013. Unemployment Dynamics Among Canada's Youth, Statistics Canada Catalogue no. 11-626-X.
Bourbeau, E. and Pelletier, R. 2019. Young people not in employment, education or training: What did they do in the past 12 months?, Statistics Canada Catalogue no. 71-222-X.
Brunet, S. 2018. The transition from school to work - the NEET (not in employment, education or training) indicator for 25- to 29-year-old women and men in Canada, Statistics Canada Catalogue no. 81-599-X.
Expert Panel on Youth Employment, 2016. Understanding the Realities: Youth Employment in Canada – Interim report of the Expert Panel on Youth Employment, ESDC Catalogue no. SP-1133-12-16F.
Galarneau, D., Morissette, R., Usalcas, J. 2013. What has changed for young people in Canada?, Statistics Canada Catalogue no. 75-006-X.
Hango, D. 2011. Length of Time between High School Graduation and Enrolling in Postsecondary Education: Who Delays and Who Does Not?, Statistics Canada Catalogue no. 81-004-X.
LaRochelle-Côté, S. 2013. Employment Instability Among Younger Workers, Labour Statistics: Research Papers, Statistics Canada Catalogue no. 75-004-M.
Marshall, K. 2012. Youth neither enrolled nor employed, Perspectives on Labour and Income, Statistics Canada Catalogue no. 75-001-X.
Morris, S., Fawcett, G., Brisebois, L. and Hughes, J. 2018. A demographic, employment and income profile of Canadians with disabilities aged 15 years and over, 2017, Statistics Canada Catalogue no. 89-654-X.
Moyser, M. 2017. Aboriginal People Living Off-Reserve and the Labour Market: Estimates from the Labour Force Survey, 2007-2015, Statistics Canada Catalogue no. 71-588-X.
Organisation for Economic Co-operation and Development (OECD). 2017. Society at a Glance 2016 OECD Social Indicators, Chapter 1 - The NEET challenge: What can be done for jobless and disengaged youth?
Statistics Canada. 2018. Guide to the Labour Force Survey, Statistics Canada Catalogue no. 71-543-G.
Statistics Canada and Council of Ministers of Education, Canada (CMEC). 2018. The transition from school to work - the not in employment, education or training (NEET) indicator for 15 to 19 year olds in Canada, Statistics Canada Catalogue no. 81-599-X, no. 12.
The Conference Board of Canada. 2019a. Education and Skills in the Territories (accessed on April 16, 2019)
The Conference Board of Canada. 2019b. Social Outcomes in the Territories (accessed on April 16, 2019)
The Institut de la statistique du Québec. 2013. Les jeunes qui ne sont ni au travail ni aux études : une perspective québécoise, Travail et Rémunération - Flash-info, volume 14, no. 1. Available in French only.
UNESCO Institute of Statistics. 2013. International, Standard Classification of Education ISCED 2011.
Uppal, S. 2017. Young men and women without a high school diploma, Statistics Canada Catalogue no. 75-006-X.
- Date modified: