
Insights on Canadian Society
Results from the 2016 Census: Housing, income and residential dissimilarity among Indigenous people in Canadian cities

Archived Content
Information identified as archived is provided for reference, research or recordkeeping purposes. It is not subject to the Government of Canada Web Standards and has not been altered or updated since it was archived. Please "contact us" to request a format other than those available.
by Thomas Anderson

Skip to text
Text begins
Start of text box

Today, Insights on Canadian Society is releasing a study based on 2016 Census data. This study uses census information on geography, housing and income to provide a profile of Indigenous people living in Canadian cities. Information from previous censuses is also used to provide comparisons over time.
End of text box
Start of text box
Residential dissimilarity describes the extent to which one population group lives apart from another in a shared urban space. This study uses data from the 2016 Census to examine the housing, income and residential dissimilarity of the Indigenous population living in private households in the 49 census metropolitan areas (CMAs) and census agglomerations (CAs) that were large enough to be divided into census tracts. It also provides a short description of neighbourhoods with a large concentration of Indigenous people.
- In 2016, 731,480 Indigenous people lived in the 49 CMAs and CAs that were large enough to be divided into census tracts, accounting for 44% of the total Indigenous population. Of these, 51% were First Nations people, 45% Métis and 1% Inuit.
- Among Indigenous people living in an urban area, about half lived in rented dwellings, compared with 29% of the non-Indigenous population. Among the 355,400 Indigenous people who lived in a rented dwelling in 2016, one in five lived in subsidized housing.
- About 11% of Indigenous people living in an urban area were in housing that needed major repairs in 2016, down from 13% in 2006. The proportion of Indigenous people who lived in a crowded dwelling was 3.6%, lower than the proportion of the non-Indigenous population (4.8%).
- Just under one-quarter (24%) of Indigenous people who lived in an urban area were in a low-income household in 2016, down from 28% in 2006.
- From 1996 to 2016, the Indigenous population became more evenly distributed across neighbourhoods in Canadian cities. At least in part, however, this result could be due to more people identifying themselves as Indigenous in 2016.
End of text box
Introduction
The number of First Nations people, Métis and Inuit living in cities has been growing for decades.Note Note In 2016, more than half of all Indigenous peopleNote in Canada lived in a metropolitan area.Note Note While the growth of the Indigenous population in cities is somewhat reflective of the growth of Canadian cities as a whole,Note the experiences of Indigenous people who have moved into urban areas are unique from those of other migrants. Among the differences are timing, since the urbanization of Indigenous people began to take hold in the middle of the 20th century after several waves of urban migration had already happened. In addition, the move into urban areas for many Indigenous people represents a move within their traditional territories, not a move into a wholly new region.Note Furthermore, the Indigenous population in Canadian cities is not homogeneous, but a combination of diverse cultures, histories and languages.Note
The cause of the growing Indigenous population in cities has received much attention: is it because of migration,Note natural growth (e.g., high birth rates) or response mobility (e.g., increasing numbers of people self-identifying as Indigenous)?Note This growth, particularly growth due to response mobility, may also impact the characteristics of the Indigenous population within cities. While factors such as housing, income and employment are often considered for the Indigenous population in distinct geographies—such as reserves, Métis settlements and Inuit communities—the characteristics of the urban neighbourhoods where First Nations people, Metis and Inuit live are examined less often.
Residential dissimilarityNote describes the extent to which one population group lives apart from another in a shared urban space. In a sense, it attempts to measure whether or not two or more groups are geographically integrated or live separately from one another.
While this idea has been sparingly applied to the Indigenous population in Canada, much of the research is based on older dataNote Note Note or is centred on a single urban area.Note The rapid growth of the Indigenous population in cities highlights the need to revisit past conclusions. This paper will use the concept of dissimilarity to try to understand to what degree the Indigenous population lives in different neighbourhoods of Canadian cities from the non-Indigenous population.
This research will examine the characteristics of Indigenous people living in private households in Canadian cities through two main aspects: first, examining the housing and income conditions of Indigenous people in Canadian cities, and second, helping to understand how much residential dissimilarity exists within the urban Canadian landscape. Where appropriate, this report will provide separate results for First Nations people, Métis and Inuit.
Among Canadian cities, Winnipeg had the largest Indigenous population in 2016
In 2016, 49 census metropolitan areas (CMAs) and census agglomerations (CAs) were large enough to be divided into census tracts. The smallest, Grande Prairie, had a total population of 62,050, while the largest, Toronto, held more than 5.8 million people. Within all applicable urban areas, there were 731,480 Indigenous people, representing 44% of the total Indigenous population.Note
Winnipeg had the largest Indigenous population, followed by Edmonton and Vancouver. The three cities had 230,475 Indigenous people, accounting for 14% of the total Indigenous population in Canada. Chart 1 shows the 10 CMAs with the largest number of Indigenous people.

Data table for Chart 1
| Census metropolitan areas | Indigenous population |
|---|---|
| number | |
| Winnipeg | 92,810 |
| Edmonton | 76,205 |
| Vancouver | 61,460 |
| Toronto | 46,320 |
| Calgary | 41,645 |
| Ottawa–Gatineau | 38,120 |
| Montréal | 34,750 |
| Saskatoon | 31,350 |
| Regina | 21,650 |
| Victoria | 17,245 |
|
Note: While the universe for this article is restricted to those living off reserve, both on and off reserve numbers are used in the calculations for this chart. Source: Statistics Canada, Census of Population, 2016. |
|
The majority of the Indigenous population in these cities comprised First Nations people (51%) and Métis (45%), with Inuit making up another 1%.Note
Most Indigenous people who lived in an urban area lived within the same CMA or CA five years prior (86%). This figure was highest for Métis (88%) and lowest for Inuit (78%). Among First Nations people, 84% lived in the same CMA or CA five years prior, while within the non-Indigenous population, 88% did.
Indigenous people are more likely to live in a dwelling that is owned by a household member than a decade ago
Among Indigenous people in urban settings, housing is one of the most commonly examined factors in existing research. Among other findings, research has pointed to the need for improved core housing among Indigenous people who own their homes.Note
In general, First Nations people, Métis and Inuit living in urban areas were less likely (51%) than the non-Indigenous population (71%) to live in a dwelling that was owned by one of the household members. The other half of the Indigenous population lived in a rented dwelling. Among the Indigenous population, the rate of living in an owned dwelling was highest for Métis (61%), followed by Inuit (48%) and First Nations people (43%).
However, while the rate of living in an owned dwelling was lower for Indigenous people than for the non-Indigenous population, the rate of living in an owned home increased for Indigenous people from 2006 to 2016. In fact, the proportion of Indigenous people living in an owned dwelling rose from 40% to 43% among First Nations people, from 57% to 61% among Métis and from 45% to 48% among Inuit.
Among the 355,400 Indigenous people who lived in a rented dwelling within an urban area in 2016, just over one in five (21%) lived in subsidized housing. This was higher than the figure for the non-Indigenous population (11%). First Nations people who lived in a rented dwelling were most likely to live in subsidized housing (25%), followed by Inuit (17%) and Métis (16%).
Dwelling conditions are improving for Indigenous people in urban areas
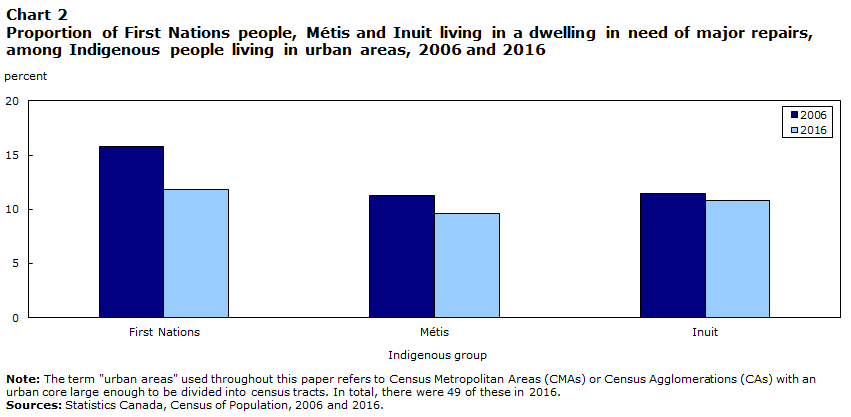
Roughly 1 in 10 Indigenous people living in an urban area in 2016 (11%) lived in housing that was in need of major repairs. This is roughly half the level for the total Indigenous population in both urban and non-urban settings, as found in past research.Note
The proportion of Indigenous people living in a dwelling in need of major repairs declined from its prior level in 2006 (14%); this decline was apparent for all three Indigenous groups, but remained stable for the non-Indigenous population (6% in both years). Chart 2 shows the proportion of First Nations people, Métis and Inuit in urban areas who lived in a dwelling in need of major repairs in both 2006 and 2016.
Data table for Chart 2
| Indigenous group | 2006 | 2016 |
|---|---|---|
| percent | ||
| First Nations | 15.8 | 11.8 |
| Métis | 11.3 | 9.6 |
| Inuit | 11.4 | 10.8 |
|
Note: The term "urban areas" used throughout this paper refers to Census Metropolitan Areas (CMAs) or Census Agglomerations (CAs) with an urban core large enough to be divided into census tracts. In total, there were 49 of these in 2016. Sources: Statistics Canada, Census of Population, 2006 and 2016. |
||
Indigenous people who lived in a rented dwelling were more likely to be in housing that was in need of major repairs (14%) than those who lived in a dwelling that was owned (8%). This finding was true for First Nations people, Métis and Inuit. The discrepancy between rented and owned dwellings was largest for Inuit (14% versus 7%), followed by First Nations people (14% versus 9%) and Métis (13% versus 8%).
While past research has found that household crowding is higher for the Indigenous population than the non-Indigenous population,Note this pattern did not hold true in urban areas. Crowding, in this case, is based upon the census concept “number of persons per room.” A crowded dwelling is defined as a dwelling with more than one person per room. Within urban areas, the proportion of Indigenous people who lived in a crowded dwelling was 3.6%, which was slightly lower than that proportion of the non-Indigenous population (4.8%).Note
Furthermore, over the 10-year period from 2006 to 2016, the share of Indigenous people who lived in a crowded dwelling went down, from 5.7% to 5.0% among First Nations people, from 2.4% to 2.1% among Métis and from 4.9% to 3.2% among Inuit. In contrast, the rate of living in a crowded dwelling increased over this period for the non-Indigenous population (3.5% to 4.8%).
As with dwellings in need of repairs, the share of the Indigenous population who lived in a crowded dwelling was higher among those who lived in a rented dwelling (5.8%) than among those who lived in an owned dwelling (1.5%). This difference in crowding was greatest for First Nations people (7.2% in a rented dwelling compared with 2.1% in an owned dwelling), followed by Métis (3.7% versus 1.0%) and Inuit (4.0% versus 2.3%).
The proportion of First Nations people, Métis and Inuit living in a low-income household is going down
While income is not the only thing researchers consider when measuring poverty, it is known to constitute a major aspect of it. According to the low-income measure, after tax, and data from the 2016 Census of Population, 4.8 million people in Canada lived in a low-income household in 2016.Note
As with housing, the proportion of Indigenous people in urban areas living in a low-income household has improved over time. In 2006, 28% of Indigenous people lived in a low-income household; by 2016, this figure had declined to 24%.
The same pattern held true for each of the Indigenous groups. The proportion of people living in a low-income household decreased from 33% to 30% among First Nations people, from 22% to 17% among Métis and from 26% to 23% among Inuit.
Yet, while these changes may signal important developments within the urban Indigenous population, it is worth remembering that the long-form census collects data on Indigenous identity, but enumerates only people who live in occupied private dwellings. Indigenous people who are homeless or living in non-permanent or collective dwellings may represent a significant number of uncounted people living under the low-income line.Note
Overall, the Indigenous population was more likely to live in a low-income household than the non-Indigenous population in 2016. The share of non-Indigenous people who lived in a low-income household was 14%, nearly 10 percentage points lower than the figure for the total Indigenous population.
Dissimilarity is highest in Toronto and lowest in Grande Prairie
While factors such as housing and income are important for understanding how First Nations people, Métis and Inuit live within Canadian cities, it is also important to consider the neighbourhoods Indigenous people live in. Are Indigenous people who live in urban areas geographically integrated? Or do they live in separate neighbourhoods from the non-Indigenous population because of income, choice or factors relating to social exclusion?
The dissimilarity index is a measure of how separately two population groups live in a shared urban space. A score of 0 indicates that the two groups are evenly distributed, while a score of 1 indicates that the two groups live in completely separate neighbourhoods.
The index is calculated by summing the (absolute) differences between the percentage distributions of two population groups across a city. The total is then divided by 2. The resulting index can be thought of as the percentage of people from one of the two groups who would need to move for the two groups to be equally distributed across the city. Table 1 illustrates how the index is calculated within a hypothetical urban area.
Table 1 start
| Urban area 1 | Group 1 | Group 2 | Absolute difference |
|---|---|---|---|
| distribution in % | |||
| Census tract 1 | 0.19 | 0.15 | 0.04 |
| Census tract 2 | 0.08 | 0.06 | 0.02 |
| Census tract 3 | 0.04 | 0.05 | 0.01 |
| Census tract 4 | 0.16 | 0.05 | 0.11 |
| Census tract 5 | 0.09 | 0.14 | 0.05 |
| Census tract 6 | 0.08 | 0.09 | 0.01 |
| Census tract 7 | 0.13 | 0.14 | 0.01 |
| Census tract 8 | 0.04 | 0.19 | 0.15 |
| Census tract 9 | 0.08 | 0.07 | 0.02 |
| Census tract 10 | 0.10 | 0.06 | 0.04 |
| Sum of all differences | Note ...: not applicable | Note ...: not applicable | 0.46 |
| Dissimilarity index score | Note ...: not applicable | Note ...: not applicable | 0.23 |
| ... not applicable | |||
Table 1 end
Past research on residential dissimilarity has found that dissimilarity is generally low between different population groups in Canadian cities compared with U.S. cities, particularly for the Indigenous populations in these cities.Note Other research has categorized dissimilarity into groupings of low (0.30 or below), moderate (0.30 to 0.60) or high (0.60 or above).Note
Using this classification, Toronto (0.36) and Regina (0.31) were the only urban areas to be classified as having moderate levels of dissimilarity (Table 2). Hamilton was third highest among all cities (0.29).
Table 2 start
| CMA or CA | Total population | Indigenous identity population | Dissimilarity index | |
|---|---|---|---|---|
| number | percent | |||
| St. John's | 203,305 | 6,695 | 3.3 | 0.15 |
| Halifax | 397,395 | 15,730 | 4.0 | 0.16 |
| Moncton | 141,480 | 3,485 | 2.5 | 0.11 |
| Saint John | 123,520 | 2,305 | 1.9 | 0.20 |
| Fredericton | 98,840 | 3,040 | 3.1 | 0.15 |
| Saguenay | 157,170 | 6,700 | 4.3 | 0.12 |
| Québec | 776,945 | 9,935 | 1.3 | 0.22 |
| Sherbrooke | 205,735 | 2,430 | 1.2 | 0.16 |
| Trois-Rivières | 149,965 | 2,145 | 1.4 | 0.19 |
| Drummondville | 92,875 | 1,080 | 1.2 | 0.20 |
| Granby | 82,745 | 895 | 1.1 | 0.15 |
| Montréal | 4,009,795 | 34,750 | 0.9 | 0.28 |
| Ottawa–Gatineau | 1,300,730 | 38,120 | 2.9 | 0.19 |
| Kingston | 156,465 | 5,585 | 3.6 | 0.20 |
| Belleville | 101,285 | 5,240 | 5.2 | 0.13 |
| Peterborough | 117,350 | 4,450 | 3.8 | 0.15 |
| Oshawa | 375,605 | 8,965 | 2.4 | 0.21 |
| Toronto | 5,862,590 | 46,110 | 0.8 | 0.36 |
| Hamilton | 734,880 | 14,440 | 2.0 | 0.29 |
| St. Catharines–Niagara | 396,870 | 11,645 | 2.9 | 0.23 |
| Kitchener–Cambridge–Waterloo | 516,080 | 8,880 | 1.7 | 0.21 |
| Brantford | 131,635 | 6,335 | 4.8 | 0.26 |
| Guelph | 150,030 | 2,280 | 1.5 | 0.18 |
| London | 486,500 | 12,070 | 2.5 | 0.25 |
| Windsor | 325,005 | 8,485 | 2.6 | 0.19 |
| Sarnia | 94,255 | 3,390 | 3.6 | 0.24 |
| Barrie | 194,445 | 6,905 | 3.6 | 0.15 |
| North Bay | 68,710 | 7,130 | 10.4 | 0.12 |
| Greater Sudbury | 161,315 | 15,240 | 9.4 | 0.14 |
| Sault Ste. Marie | 75,545 | 8,495 | 11.2 | 0.13 |
| Thunder Bay | 117,900 | 14,280 | 12.1 | 0.23 |
| Winnipeg | 761,025 | 92,310 | 12.1 | 0.25 |
| Regina | 232,615 | 21,650 | 9.3 | 0.31 |
| Saskatoon | 288,450 | 30,905 | 10.7 | 0.25 |
| Medicine Hat | 74,670 | 3,680 | 4.9 | 0.11 |
| Lethbridge | 113,920 | 6,130 | 5.4 | 0.22 |
| Calgary | 1,373,005 | 41,030 | 3.0 | 0.22 |
| Red Deer | 98,480 | 5,185 | 5.3 | 0.15 |
| Edmonton | 1,292,890 | 71,995 | 5.6 | 0.23 |
| Grande Prairie | 62,055 | 6,550 | 10.6 | 0.10 |
| Wood Buffalo | 71,475 | 6,560 | 9.2 | 0.24 |
| Kelowna | 180,120 | 10,010 | 5.6 | 0.15 |
| Kamloops | 97,370 | 9,365 | 9.6 | 0.17 |
| Chilliwack | 93,585 | 7,315 | 7.8 | 0.18 |
| Abbotsford–Mission | 176,045 | 9,505 | 5.4 | 0.22 |
| Vancouver | 2,417,230 | 57,860 | 2.4 | 0.26 |
| Victoria | 352,575 | 14,535 | 4.1 | 0.21 |
| Nanaimo | 101,030 | 7,360 | 7.3 | 0.20 |
| Prince George | 85,030 | 12,300 | 14.5 | 0.20 |
| Source: Statistics Canada, Census of Population, 2016. | ||||
Table 2 end
The lowest index scores were in Grande Prairie (0.10), Medicine Hat (0.11) and Moncton (0.11). These are all smaller cities, each with a total population of less than 150,000.
However, while a relationship exists between the size of a city and its level of dissimilarity, this relationship is far from definitive. Although some large cities such as Toronto (0.36) and Montréal (0.28) had relatively higher levels of dissimilarity, other large cities such as Ottawa–Gatineau (0.19) had a lower index score. Conversely, some smaller cities had higher levels of dissimilarity, such as Brantford (0.26) and Sarnia (0.24), while others had lower levels, such as the aforementioned Grande Prairie (0.10) and Medicine Hat (0.11).
There was also no clear relationship between the proportion of Indigenous people living in a city and the index score of that city. For example, Indigenous people made up 0.8% of the population of Toronto—the lowest figure among the cities in this study—while in Regina, the Indigenous population made up 9.3% of the total population—a higher figure than that of 39 of the 49 cities studied.
Finally, the geographic location of these cities does not give a clear explanation of their level of dissimilarity since every region has examples of both higher and lower dissimilarity.
Dissimilarity is going down in all urban areas
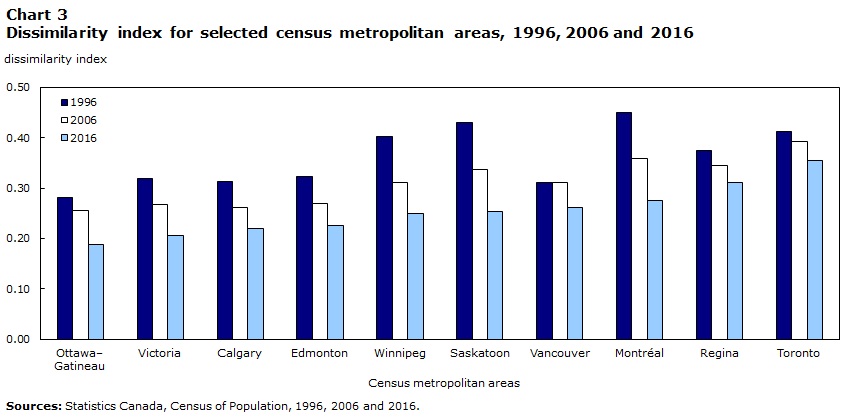
For all applicable CMAs and CAs , the level of dissimilarity between the Indigenous and non-Indigenous populations went down over the 20-year period from 1996 to 2016. Chart 3 shows the declines over this period within the 10 CMAs with the largest Indigenous populations in Canada.
Data table for Chart 3
| Census metropolitan areas | 1996 | 2006 | 2016 |
|---|---|---|---|
| dissimilarity index | |||
| Ottawa–Gatineau | 0.28 | 0.25 | 0.19 |
| Victoria | 0.32 | 0.27 | 0.21 |
| Calgary | 0.31 | 0.26 | 0.22 |
| Edmonton | 0.32 | 0.27 | 0.23 |
| Winnipeg | 0.40 | 0.31 | 0.25 |
| Saskatoon | 0.43 | 0.34 | 0.25 |
| Vancouver | 0.31 | 0.31 | 0.26 |
| Montréal | 0.45 | 0.36 | 0.28 |
| Regina | 0.37 | 0.35 | 0.31 |
| Toronto | 0.41 | 0.39 | 0.36 |
| Sources: Statistics Canada, Census of Population, 1996, 2006 and 2016. | |||
Because dissimilarity has gone down in all of the CMAs and CAs that were measured, the Indigenous population seems to have become increasingly geographically integrated into these cities. However, response mobility may play a role in this change. In other words, what appears to be increased geographic integration could be the result of people who were already geographically integrated reporting an Indigenous identity for the first time in the Census.
In 2016, there were no CMAs or CAs with a dissimilarity index score of 0.40 or higher. Twenty years earlier, there were nine such cities: Québec, Saint John, Montréal, Sherbrooke, Saskatoon, Toronto, Moncton, Hamilton and Winnipeg.
Although Toronto had the highest index score in 2016, this has not always been the case. Table 3 shows the CMAs and CAs with the highest dissimilarity index scores for 1996, 2006 and 2016.
Table 3 start
| CMA or CA | Dissimilarity index score |
|---|---|
| 1996 | |
| Québec | 0.47 |
| Saint John | 0.46 |
| Montréal | 0.45 |
| Sherbrooke | 0.43 |
| Saskatoon | 0.43 |
| 2006 | |
| Toronto | 0.39 |
| Hamilton | 0.36 |
| Montréal | 0.36 |
| Brantford | 0.35 |
| Regina | 0.35 |
| 2016 | |
| Toronto | 0.36 |
| Regina | 0.31 |
| Hamilton | 0.29 |
| Montréal | 0.28 |
| Brantford | 0.26 |
| Sources: Statistics Canada, Census of Population, 1996, 2006 and 2016. | |
Table 3 end
While the level of dissimilarity declined in all applicable cities, it did not decline equally. The largest changes in dissimilarity from 1996 to 2016 were found in two cities in New Brunswick (Moncton and Saint John) and two in Quebec (Sherbrooke and the city of Québec). In each of these cities, the dissimilarity index between the Indigenous and non-Indigenous populations went down by at least 0.25.
This may be related to the former size of the Indigenous population within these cities. Past research has noted that the dissimilarity index is often affected when the proportion of a minority population is particularly small.Note
In some other cities, dissimilarity declined more modestly. In five cities, the dissimilarity index scores went down by less than 0.05 over the 20-year period. These cities were Thunder Bay, Lethbridge, Prince George, Abbotsford–Mission and Vancouver.
Housing in need of major repairs, crowding and low income are more common in neighbourhoods with a high concentration of Indigenous people
Although the low and declining rates of dissimilarity among Indigenous people suggest that the Indigenous population is becoming more evenly distributed across neighbourhoods in Canadian cities, it is also important to examine the areas where Indigenous people are concentrated.
In 2016, Indigenous people made up 4.9% of the total population in Canada. In all applicable CMAs and CAs , there were 4,594 census tracts that had an Indigenous population of less than 5%, 677 census tracts with an Indigenous population from 5% to less than 10%, and 303 census tracts with an Indigenous population of 10% or more.Note
More than two-thirds of neighbourhoods with an Indigenous population of at least 10% were in urban areas in Manitoba, Saskatchewan, Alberta or British Columbia.
Indigenous people living in neighbourhoods where the Indigenous population made up at least 10% of the population were more likely to live in a low-income household than those in other types of neighbourhoods. One-third (34%) of the Indigenous population living in a neighbourhood where at least 10% of the population had an Indigenous identity lived in a low-income household, compared with 22% of those living in a neighbourhood where 5% to 10% had an Indigenous identity and with 19% of those who lived in a census tract where Indigenous people made up less than 5% of the population.
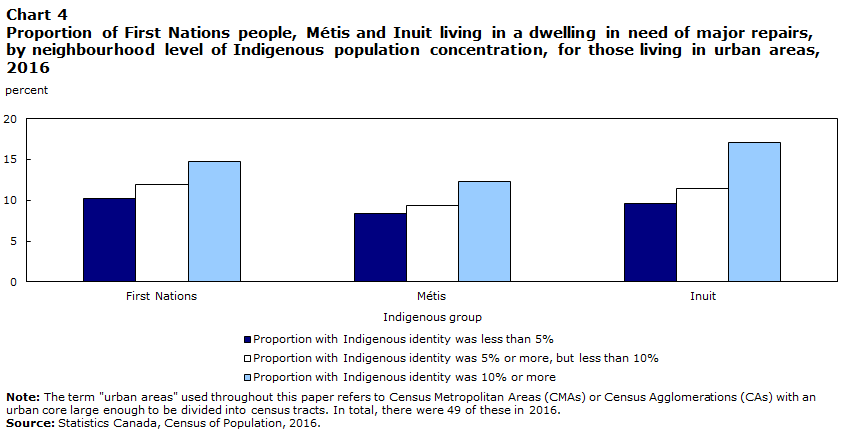
The same pattern was also apparent when considering dwellings in need of major repairs and household crowding. Within neighbourhoods where at least 10% of the population had an Indigenous identity, 14% of Indigenous people lived in a dwelling that was in need of major repairs, and close to 7% lived in a crowded dwelling. Both were higher than in neighbourhoods where less than 5% of the population had an Indigenous identity (where 9% of Indigenous people lived in a dwelling needing major repairs and 2% lived in a crowded dwelling). Similar trends were found for all three Indigenous groups (Chart 4).
Data table for Chart 4
| Proportion of population in census tract with an Indigenous identity | First Nations | Métis | Inuit |
|---|---|---|---|
| percent | |||
| Proportion with Indigenous identity was less than 5% | 10.2 | 8.4 | 9.6 |
| Proportion with Indigenous identity was 5% or more, but less than 10% | 11.9 | 9.3 | 11.4 |
| Proportion with Indigenous identity was 10% or more | 14.8 | 12.3 | 17.1 |
|
Note: The term "urban areas" used throughout this paper refers to Census Metropolitan Areas (CMAs) or Census Agglomerations (CAs) with an urban core large enough to be divided into census tracts. In total, there were 49 of these in 2016. Source: Statistics Canada, Census of Population, 2016. |
|||
Conclusion
By examining the housing, income and geographic location of Indigenous people in Canadian cities, this paper explored the characteristics of First Nations people, Métis and Inuit living in urban areas. Specifically, this was assessed by asking “how” Indigenous people in cities live—that is, their housing and income characteristics—and “where” they live in comparison with the non-Indigenous population.
Regarding housing and income in urban areas, disparities persist between the Indigenous and non-Indigenous populations. Compared with the non-Indigenous population, First Nations people, Métis and Inuit were less likely to live in a dwelling that was owned, more likely to live in a dwelling in need of major repairs and more likely to live in a low-income household. However, each of these domains has improved over time. These findings remain notable even though the absence of information on those who were living in temporary or collective dwellings or were homeless at the time of the census reveals an unfilled data gap.
This paper follows a trend in past research that finds that residential dissimilarity for the Indigenous population is generally low in Canadian cities. Moreover, dissimilarity has consistently gone down from 1996 to 2016 in every urban area for which this analysis could be conducted. This seems to indicate that First Nations people, Métis and Inuit are becoming more geographically integrated into Canadian cities.
These findings, however, should be looked at with caution since the rapid growth of the Indigenous population could be because of factors related to response mobility,Note particularly since much of this growth has occurred in urban settings. A question that warrants future study is whether the geographic integration of Indigenous people is driven by residential mobility causing dispersion, or by respondents who were already dispersed reporting an Indigenous identity for the first time in the Census.
Although this question currently remains unanswered, dissimilarity went down in all urban areas—not only those with the highest response mobility. This seems to indicate that the results are not due to response mobility alone.
Lastly, while the Indigenous population seems to be more geographically integrated throughout urban areas than in the past, Indigenous people living in neighbourhoods where the Indigenous population made up a larger share of the total population were more likely to live in a dwelling that was in need of major repairs, a crowded dwelling and a low-income household. This suggests that while gains have been made, the urban neighbourhoods in which many First Nations people, Métis and Inuit are concentrated appear to be areas where housing conditions and income fall below the levels found in the rest of these cities.
Thomas Anderson is a researcher with the Centre for Indigenous Statistics and Partnerships at Statistics Canada.
Start of text box
Data sources, methods and definitions
Data sources
Data in this article are from the 2016 Census of Population, as well as the 1996 and 2006 censuses. More information on the census can be found in the Guide to the Census of Population, 2016, Statistics Canada Catalogue no. 98-304-X.
Additional information on census data quality and comparability for Aboriginal peoples can be found in the Aboriginal Peoples Reference Guide, Census of Population, 2016, Statistics Canada Catalogue no. 98-500-X.
Methods
The universe for this paper was limited to people in private households living in a census metropolitan area (CMA) or census agglomeration (CA) large enough to be divided into census tracts. Specifically, this included a total of 49 CMAs and CAs . It also excluded people living on a reserve or Indian settlement within the boundaries of a CMA or CA .
When data on Aboriginal peoples from the 2016 Census of Population are compared with previous cycles, several factors should be considered, such as differences in methodology, changes to the wording and format of Aboriginal questions, legislative changes, and differences in the list of incompletely enumerated reserves.
In addition, some people, for a variety of reasons, report their Aboriginal identity differently from one data collection period to another.
Random rounding and percentage distributions: To ensure the confidentiality of responses collected for the 2016 Census, a random rounding process is used to alter the values reported in individual cells. As a result, when these data are summed or grouped, the total value may not match the sum of the individual values since the total and subtotals are independently rounded. Similarly, percentage distributions, which are calculated on rounded data, may not necessarily add up to 100%.
Because of random rounding, counts and percentages may vary slightly between different census products such as analytical documents, highlight tables and data tables.
Definitions
Most definitions within this article are accessible through the 2016 Census Dictionary, Statistics Canada Catalogue no. 98-301-X.
Urban areas: These include census metropolitan areas (CMAs) and census agglomerations (CAs) that were large enough to be divided into census tracts. See the following definition from the Census Dictionary for more detail on CMAs and CAs .
Dissimilarity index: Scores range from 0.00 to 1.00. The index is calculated by summing the absolute difference between the percentage distributions of how two different population groups are spread across a city. The resulting total is then divided by 2.
End of text box
- Date modified: