
Labour Force Information
June 10 to 16, 2018

Archived Content
Information identified as archived is provided for reference, research or recordkeeping purposes. It is not subject to the Government of Canada Web Standards and has not been altered or updated since it was archived. Please "contact us" to request a format other than those available.
Note
The data tables within this publication were moved, and can now be accessed by selecting the link to the Labour Force Survey release in The Daily provided above.
Skip to text
Text begins
Charts
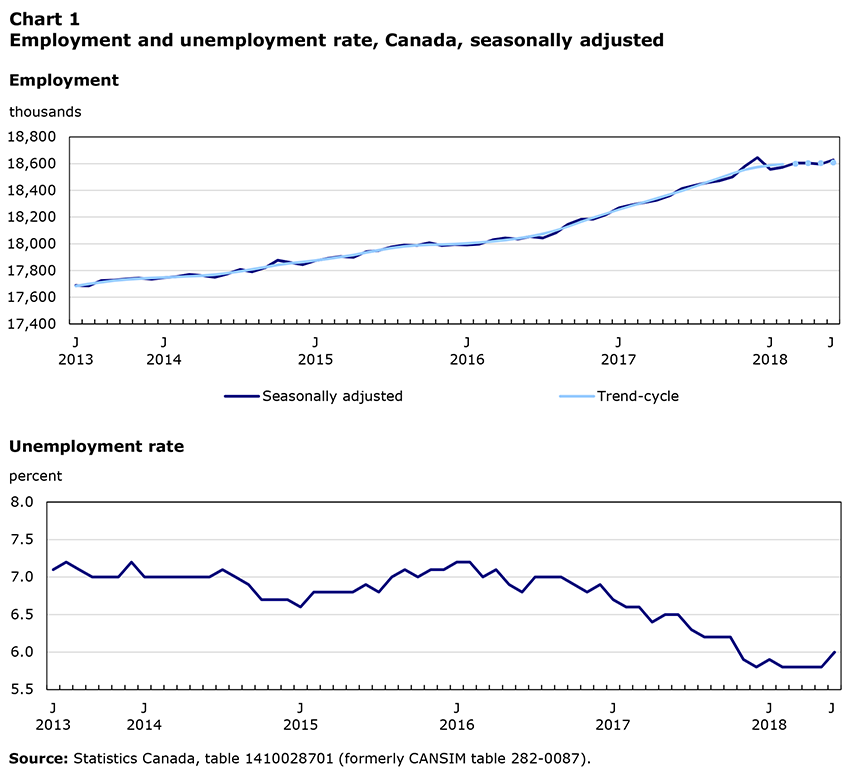
Data table for Chart 1
| Employment | Unemployment rate | ||
|---|---|---|---|
| Seasonally adjusted | Trend-cycle | ||
| in thousands | percent | ||
| June 2013 | 17,688.60 | 17,683.90 | 7.1 |
| July 2013 | 17,684.40 | 17,698.90 | 7.2 |
| August 2013 | 17,724.10 | 17,712.90 | 7.1 |
| September 2013 | 17,728.40 | 17,724.90 | 7.0 |
| October 2013 | 17,737.80 | 17,733.00 | 7.0 |
| November 2013 | 17,743.90 | 17,739.60 | 7.0 |
| December 2013 | 17,735.40 | 17,744.90 | 7.2 |
| January 2014 | 17,746.40 | 17,749.00 | 7.0 |
| February 2014 | 17,754.90 | 17,753.40 | 7.0 |
| March 2014 | 17,771.00 | 17,758.20 | 7.0 |
| April 2014 | 17,762.60 | 17,761.60 | 7.0 |
| May 2014 | 17,749.50 | 17,769.20 | 7.0 |
| June 2014 | 17,774.80 | 17,781.00 | 7.0 |
| July 2014 | 17,807.50 | 17,794.30 | 7.1 |
| August 2014 | 17,791.40 | 17,809.60 | 7.0 |
| September 2014 | 17,820.80 | 17,826.00 | 6.9 |
| October 2014 | 17,876.30 | 17,842.50 | 6.7 |
| November 2014 | 17,859.40 | 17,854.90 | 6.7 |
| December 2014 | 17,843.60 | 17,864.60 | 6.7 |
| January 2015 | 17,874.70 | 17,875.30 | 6.6 |
| February 2015 | 17,891.70 | 17,887.80 | 6.8 |
| March 2015 | 17,904.80 | 17,901.40 | 6.8 |
| April 2015 | 17,898.60 | 17,915.90 | 6.8 |
| May 2015 | 17,941.70 | 17,935.10 | 6.8 |
| June 2015 | 17,949.00 | 17,953.00 | 6.9 |
| July 2015 | 17,976.30 | 17,968.30 | 6.8 |
| August 2015 | 17,990.40 | 17,980.60 | 7.0 |
| September 2015 | 17,987.10 | 17,988.30 | 7.1 |
| October 2015 | 18,007.10 | 17,992.70 | 7.0 |
| November 2015 | 17,986.60 | 17,994.60 | 7.1 |
| December 2015 | 17,995.60 | 17,997.50 | 7.1 |
| January 2016 | 17,991.10 | 18,002.20 | 7.2 |
| February 2016 | 17,998.10 | 18,009.90 | 7.2 |
| March 2016 | 18,029.40 | 18,018.00 | 7.0 |
| April 2016 | 18,043.30 | 18,027.60 | 7.1 |
| May 2016 | 18,035.10 | 18,039.90 | 6.9 |
| June 2016 | 18,054.30 | 18,054.50 | 6.8 |
| July 2016 | 18,044.20 | 18,073.60 | 7.0 |
| August 2016 | 18,081.10 | 18,099.60 | 7.0 |
| September 2016 | 18,147.70 | 18,130.20 | 7.0 |
| October 2016 | 18,183.50 | 18,163.70 | 6.9 |
| November 2016 | 18,185.50 | 18,196.10 | 6.8 |
| December 2016 | 18,217.80 | 18,226.30 | 6.9 |
| January 2017 | 18,268.40 | 18,256.10 | 6.7 |
| February 2017 | 18,290.00 | 18,283.60 | 6.6 |
| March 2017 | 18,308.60 | 18,310.30 | 6.6 |
| April 2017 | 18,325.40 | 18,339.00 | 6.4 |
| May 2017 | 18,358.00 | 18,367.70 | 6.5 |
| June 2017 | 18,413.10 | 18,396.00 | 6.5 |
| July 2017 | 18,436.20 | 18,428.40 | 6.3 |
| August 2017 | 18,458.80 | 18,461.10 | 6.2 |
| September 2017 | 18,471.40 | 18,492.20 | 6.2 |
| October 2017 | 18,499.10 | 18,524.90 | 6.2 |
| November 2017 | 18,580.30 | 18,553.50 | 5.9 |
| December 2017 | 18,645.10 | 18,573.80 | 5.8 |
| January 2018 | 18,557.10 | 18,586.60 | 5.9 |
| February 2018 | 18,572.50 | 18,594.40 | 5.8 |
| March 2018 | 18,604.80 | 18,598.70 | 5.8 |
| April 2018 | 18,603.70 | 18,602.60 | 5.8 |
| May 2018 | 18,596.20 | 18,603.50 | 5.8 |
| June 2018 | 18,628.00 | 18,607.50 | 6.0 |
| Source: Statistics Canada, table 1410028701 (formerly CANSIM table 282-0087). | |||
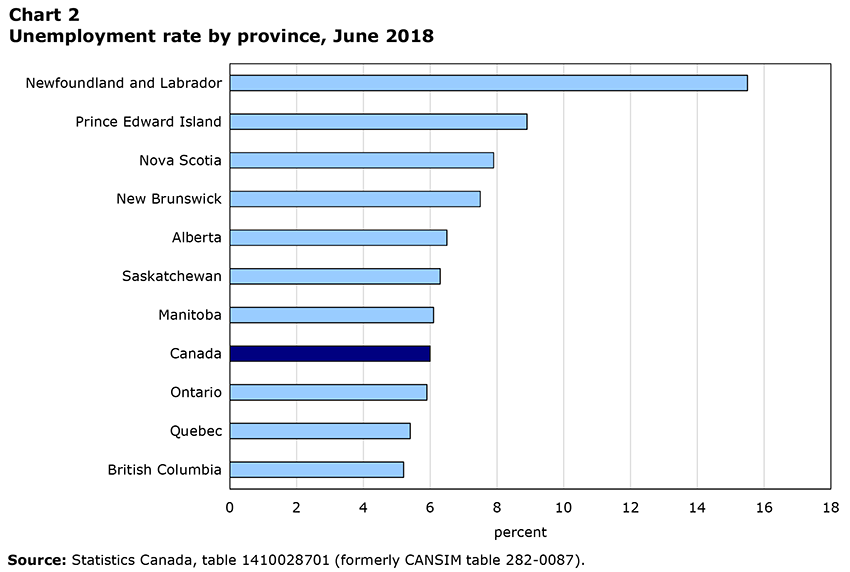
Data table for Chart 2
| Unemployment rate | |||
|---|---|---|---|
| percent | |||
| Newfoundland and Labrador | 15.5 | ||
| Prince Edward Island | 8.9 | ||
| Nova Scotia | 7.9 | ||
| New Brunswick | 7.5 | ||
| Alberta | 6.5 | ||
| Saskatchewan | 6.3 | ||
| Manitoba | 6.1 | ||
| Canada | 6.0 | ||
| Ontario | 5.9 | ||
| Quebec | 5.4 | ||
| British Columbia | 5.2 | ||
| Source: Statistics Canada, table 1410028701 (formerly CANSIM table 282-0087). | |||

Data table for Chart 3
| Indexes | |||||||||||||||
|---|---|---|---|---|---|---|---|---|---|---|---|---|---|---|---|
| By sex and age group | By full- and part-time employment | By class of worker | |||||||||||||
| Both sexes - 15 to 24 years | Females - 25 to 54 years | Females - 55 years and over | Males - 25 to 54 years | Males - 55 years and over | Full-time employment | Part-time employment | Public sector employees | Private sector employees | Self-employed | ||||||
| January 2015=100 | |||||||||||||||
| January 2015 | 100.00 | 100.00 | 100.00 | 100.00 | 100.00 | 100.00 | 100.00 | 100.00 | 100.00 | 100.00 | |||||
| February 2015 | 100.07 | 100.15 | 100.08 | 99.95 | 100.45 | 100.33 | 99.09 | 100.95 | 99.86 | 99.98 | |||||
| March 2015 | 100.12 | 100.07 | 101.34 | 99.68 | 101.13 | 100.22 | 99.96 | 101.64 | 99.84 | 99.67 | |||||
| April 2015 | 99.54 | 100.21 | 100.85 | 99.58 | 101.86 | 100.48 | 98.67 | 101.00 | 100.06 | 99.30 | |||||
| May 2015 | 99.84 | 100.30 | 101.13 | 99.85 | 102.35 | 100.54 | 99.68 | 100.37 | 100.47 | 99.97 | |||||
| June 2015 | 99.16 | 100.35 | 100.56 | 99.96 | 103.54 | 100.97 | 98.09 | 101.56 | 100.37 | 99.12 | |||||
| July 2015 | 99.12 | 100.42 | 100.94 | 100.21 | 103.69 | 101.10 | 98.31 | 102.04 | 100.18 | 100.30 | |||||
| August 2015 | 99.19 | 100.31 | 102.12 | 100.21 | 103.70 | 101.37 | 97.60 | 102.14 | 100.42 | 99.69 | |||||
| September 2015 | 98.93 | 100.29 | 101.90 | 100.23 | 104.04 | 100.93 | 99.34 | 101.33 | 100.49 | 100.30 | |||||
| October 2015 | 98.77 | 99.82 | 104.21 | 100.30 | 104.55 | 100.98 | 99.75 | 102.13 | 100.60 | 99.56 | |||||
| November 2015 | 98.14 | 100.10 | 104.18 | 99.97 | 104.57 | 101.27 | 97.90 | 101.64 | 100.31 | 100.66 | |||||
| December 2015 | 97.75 | 100.25 | 104.93 | 99.74 | 105.21 | 101.11 | 98.84 | 101.25 | 100.21 | 101.87 | |||||
| January 2016 | 98.05 | 100.44 | 104.77 | 99.63 | 104.55 | 101.16 | 98.49 | 101.65 | 100.21 | 101.21 | |||||
| February 2016 | 97.63 | 100.34 | 105.24 | 99.67 | 105.19 | 100.71 | 100.60 | 101.29 | 100.37 | 101.25 | |||||
| March 2016 | 97.70 | 100.62 | 106.03 | 99.71 | 105.13 | 100.98 | 100.39 | 101.30 | 100.78 | 100.66 | |||||
| April 2016 | 97.90 | 100.82 | 105.71 | 99.88 | 104.73 | 101.09 | 100.32 | 101.38 | 101.07 | 99.86 | |||||
| May 2016 | 96.06 | 100.98 | 107.01 | 99.64 | 105.91 | 101.25 | 99.43 | 102.04 | 100.79 | 99.87 | |||||
| June 2016 | 97.28 | 100.77 | 107.18 | 99.77 | 105.38 | 101.14 | 100.43 | 101.49 | 100.90 | 100.80 | |||||
| July 2016 | 96.19 | 100.89 | 107.69 | 99.70 | 105.70 | 100.81 | 101.54 | 100.77 | 101.10 | 100.54 | |||||
| August 2016 | 97.55 | 100.80 | 108.14 | 99.65 | 105.96 | 101.21 | 100.91 | 102.19 | 101.28 | 99.28 | |||||
| September 2016 | 97.82 | 100.77 | 109.97 | 99.95 | 106.67 | 101.35 | 102.26 | 102.05 | 101.55 | 100.77 | |||||
| October 2016 | 98.25 | 100.88 | 110.60 | 100.13 | 106.55 | 101.15 | 104.14 | 102.51 | 101.70 | 100.82 | |||||
| November 2016 | 97.74 | 101.10 | 109.20 | 100.31 | 107.23 | 101.09 | 104.45 | 102.76 | 101.85 | 99.96 | |||||
| December 2016 | 98.25 | 101.50 | 108.78 | 100.31 | 107.42 | 101.63 | 103.13 | 103.32 | 102.16 | 99.10 | |||||
| January 2017 | 98.02 | 101.86 | 108.59 | 100.75 | 108.04 | 101.81 | 103.86 | 103.54 | 102.42 | 99.58 | |||||
| February 2017 | 97.95 | 102.12 | 108.67 | 100.71 | 108.53 | 102.45 | 101.80 | 103.46 | 102.57 | 99.80 | |||||
| March 2017 | 97.87 | 102.19 | 108.37 | 101.14 | 108.24 | 102.56 | 101.88 | 103.16 | 102.70 | 100.34 | |||||
| April 2017 | 98.26 | 102.09 | 109.11 | 100.96 | 108.91 | 102.46 | 102.79 | 104.12 | 102.35 | 101.18 | |||||
| May 2017 | 98.73 | 102.07 | 109.68 | 101.25 | 108.65 | 102.86 | 102.06 | 104.22 | 102.66 | 100.93 | |||||
| June 2017 | 99.11 | 102.32 | 111.29 | 101.24 | 108.97 | 102.96 | 103.24 | 104.56 | 102.87 | 101.61 | |||||
| July 2017 | 99.47 | 102.16 | 112.15 | 101.31 | 109.25 | 103.27 | 102.58 | 104.60 | 103.00 | 101.84 | |||||
| August 2017 | 98.30 | 102.33 | 113.32 | 101.31 | 110.48 | 102.75 | 105.43 | 104.39 | 102.95 | 103.16 | |||||
| September 2017 | 98.33 | 102.52 | 113.85 | 101.00 | 111.08 | 103.34 | 103.32 | 105.09 | 102.89 | 102.95 | |||||
| October 2017 | 98.63 | 102.67 | 113.67 | 101.20 | 111.17 | 103.93 | 101.65 | 104.89 | 103.19 | 102.98 | |||||
| November 2017 | 99.91 | 102.44 | 115.80 | 101.57 | 111.46 | 104.18 | 102.98 | 105.32 | 103.75 | 103.01 | |||||
| December 2017 | 99.75 | 102.75 | 116.71 | 101.92 | 112.27 | 104.34 | 104.19 | 105.80 | 103.97 | 103.83 | |||||
| January 2018 | 98.89 | 101.95 | 116.18 | 101.95 | 111.49 | 104.68 | 100.20 | 104.64 | 103.35 | 104.69 | |||||
| February 2018 | 98.53 | 102.29 | 115.70 | 102.31 | 111.01 | 104.40 | 101.79 | 106.06 | 103.43 | 103.12 | |||||
| March 2018 | 99.24 | 102.74 | 114.19 | 101.95 | 112.82 | 104.88 | 100.74 | 106.61 | 103.37 | 103.84 | |||||
| April 2018 | 98.34 | 103.10 | 115.28 | 102.09 | 111.56 | 105.08 | 99.87 | 106.23 | 103.61 | 103.28 | |||||
| May 2018 | 98.42 | 102.77 | 116.08 | 101.78 | 112.37 | 104.86 | 100.56 | 106.59 | 103.57 | 102.71 | |||||
| June 2018 | 98.72 | 102.89 | 115.90 | 101.89 | 113.06 | 104.92 | 101.22 | 106.92 | 103.55 | 103.51 | |||||
| Sources: Statistics Canada, tables 1410028701 and 1410028801 (formerly CANSIM tables 282-0087 and 282-0089). | |||||||||||||||

Data table for Chart 4
| Unemployment rate | Employment rate | Participation rate | |||||||||||||
|---|---|---|---|---|---|---|---|---|---|---|---|---|---|---|---|
| Both sexes - 15 to 24 years | Females - 25 to 54 years | Females - 55 years and over | Males - 25 to 54 years | Males - 55 years and over | Both sexes - 15 to 24 years | Females - 25 to 54 years | Females - 55 years and over | Males - 25 to 54 years | Males - 55 years and over | Both sexes - 15 to 24 years | Females - 25 to 54 years | Females - 55 years and over | Males - 25 to 54 years | Males - 55 years and over | |
| percent | |||||||||||||||
| January 2015 | 12.8 | 5.3 | 5.0 | 5.7 | 6.1 | 56.0 | 77.5 | 29.8 | 85.4 | 40.2 | 64.2 | 81.8 | 31.4 | 90.6 | 42.8 |
| February 2015 | 13.3 | 5.2 | 5.3 | 6.0 | 6.2 | 56.1 | 77.6 | 29.8 | 85.4 | 40.2 | 64.7 | 81.9 | 31.4 | 90.9 | 42.9 |
| March 2015 | 12.9 | 5.5 | 5.1 | 6.1 | 5.8 | 56.1 | 77.5 | 30.1 | 85.2 | 40.4 | 64.4 | 82.0 | 31.7 | 90.7 | 42.9 |
| April 2015 | 13.7 | 5.3 | 5.4 | 6.0 | 5.9 | 55.8 | 77.6 | 29.9 | 85.1 | 40.6 | 64.7 | 81.9 | 31.5 | 90.5 | 43.2 |
| May 2015 | 13.1 | 5.3 | 5.0 | 6.1 | 6.5 | 56.1 | 77.7 | 29.9 | 85.3 | 40.7 | 64.5 | 82.0 | 31.4 | 90.8 | 43.5 |
| June 2015 | 13.0 | 5.3 | 5.4 | 6.2 | 6.2 | 55.7 | 77.7 | 29.6 | 85.3 | 41.0 | 64.0 | 82.1 | 31.3 | 91.0 | 43.7 |
| July 2015 | 13.3 | 5.2 | 5.1 | 6.0 | 6.6 | 55.7 | 77.7 | 29.7 | 85.5 | 41.0 | 64.2 | 82.0 | 31.3 | 91.0 | 43.9 |
| August 2015 | 13.1 | 5.5 | 5.3 | 6.2 | 6.8 | 55.8 | 77.6 | 29.9 | 85.5 | 40.9 | 64.2 | 82.1 | 31.6 | 91.1 | 43.9 |
| September 2015 | 13.5 | 5.6 | 5.4 | 6.3 | 6.5 | 55.7 | 77.6 | 29.8 | 85.5 | 40.9 | 64.4 | 82.1 | 31.5 | 91.2 | 43.7 |
| October 2015 | 13.3 | 5.7 | 5.1 | 6.3 | 5.6 | 55.7 | 77.2 | 30.4 | 85.5 | 41.0 | 64.2 | 81.8 | 32.0 | 91.3 | 43.4 |
| November 2015 | 12.7 | 5.8 | 5.5 | 6.5 | 6.6 | 55.4 | 77.4 | 30.3 | 85.2 | 40.9 | 63.4 | 82.2 | 32.1 | 91.1 | 43.8 |
| December 2015 | 13.1 | 5.6 | 5.4 | 6.8 | 6.2 | 55.2 | 77.5 | 30.5 | 85.0 | 41.1 | 63.5 | 82.1 | 32.2 | 91.2 | 43.8 |
| January 2016 | 13.0 | 5.6 | 5.2 | 6.8 | 6.7 | 55.4 | 77.6 | 30.3 | 84.9 | 40.7 | 63.7 | 82.3 | 32.0 | 91.1 | 43.6 |
| February 2016 | 13.3 | 5.6 | 5.3 | 6.9 | 6.8 | 55.3 | 77.5 | 30.4 | 85.0 | 40.8 | 63.7 | 82.1 | 32.1 | 91.2 | 43.8 |
| March 2016 | 13.2 | 5.4 | 5.1 | 6.6 | 6.5 | 55.3 | 77.7 | 30.6 | 85.0 | 40.7 | 63.7 | 82.1 | 32.2 | 91.0 | 43.5 |
| April 2016 | 13.2 | 5.6 | 5.5 | 6.5 | 6.9 | 55.5 | 77.9 | 30.4 | 85.1 | 40.5 | 63.9 | 82.4 | 32.2 | 91.0 | 43.5 |
| May 2016 | 13.3 | 5.4 | 5.3 | 6.5 | 6.0 | 54.5 | 77.9 | 30.7 | 84.8 | 40.8 | 62.9 | 82.4 | 32.4 | 90.7 | 43.4 |
| June 2016 | 13.0 | 5.3 | 5.0 | 6.2 | 6.6 | 55.2 | 77.7 | 30.7 | 84.9 | 40.5 | 63.5 | 82.1 | 32.3 | 90.5 | 43.4 |
| July 2016 | 13.5 | 5.2 | 5.4 | 6.3 | 6.6 | 54.6 | 77.8 | 30.8 | 84.8 | 40.5 | 63.2 | 82.1 | 32.5 | 90.5 | 43.4 |
| August 2016 | 13.0 | 5.2 | 5.6 | 6.6 | 6.6 | 55.5 | 77.7 | 30.8 | 84.7 | 40.5 | 63.8 | 82.0 | 32.6 | 90.7 | 43.4 |
| September 2016 | 13.4 | 5.3 | 5.3 | 6.4 | 6.8 | 55.7 | 77.7 | 31.2 | 85.0 | 40.7 | 64.3 | 82.0 | 33.0 | 90.8 | 43.6 |
| October 2016 | 12.8 | 5.3 | 5.0 | 6.3 | 7.1 | 56.0 | 77.7 | 31.4 | 85.2 | 40.5 | 64.2 | 82.1 | 33.0 | 90.9 | 43.6 |
| November 2016 | 13.0 | 5.3 | 5.0 | 6.3 | 6.4 | 55.7 | 77.9 | 30.9 | 85.3 | 40.7 | 64.0 | 82.3 | 32.5 | 91.1 | 43.5 |
| December 2016 | 12.8 | 5.5 | 5.3 | 6.2 | 6.8 | 56.1 | 78.2 | 30.7 | 85.3 | 40.7 | 64.3 | 82.8 | 32.4 | 91.0 | 43.7 |
| January 2017 | 13.1 | 5.3 | 5.3 | 5.9 | 6.3 | 56.0 | 78.5 | 30.6 | 85.7 | 40.8 | 64.4 | 82.9 | 32.3 | 91.1 | 43.5 |
| February 2017 | 12.4 | 5.3 | 5.2 | 5.8 | 6.3 | 56.0 | 78.7 | 30.5 | 85.7 | 40.9 | 63.9 | 83.1 | 32.2 | 91.0 | 43.6 |
| March 2017 | 12.5 | 5.2 | 5.7 | 5.9 | 6.3 | 56.0 | 78.7 | 30.4 | 86.0 | 40.7 | 64.0 | 83.0 | 32.2 | 91.4 | 43.4 |
| April 2017 | 11.6 | 5.1 | 5.2 | 6.0 | 5.9 | 56.2 | 78.6 | 30.5 | 85.8 | 40.8 | 63.6 | 82.9 | 32.2 | 91.3 | 43.4 |
| May 2017 | 11.9 | 5.3 | 5.3 | 5.8 | 6.6 | 56.5 | 78.6 | 30.6 | 86.0 | 40.6 | 64.1 | 82.9 | 32.3 | 91.3 | 43.5 |
| June 2017 | 11.9 | 5.2 | 5.6 | 5.8 | 5.9 | 56.7 | 78.7 | 31.0 | 86.0 | 40.6 | 64.4 | 83.0 | 32.8 | 91.2 | 43.2 |
| July 2017 | 10.9 | 5.4 | 5.3 | 5.7 | 5.5 | 57.0 | 78.6 | 31.1 | 86.0 | 40.6 | 63.9 | 83.1 | 32.9 | 91.2 | 43.0 |
| August 2017 | 11.3 | 5.2 | 4.9 | 5.5 | 5.6 | 56.3 | 78.7 | 31.4 | 86.0 | 41.0 | 63.5 | 83.0 | 33.0 | 90.9 | 43.4 |
| September 2017 | 10.6 | 5.2 | 4.9 | 5.8 | 5.8 | 56.3 | 78.8 | 31.4 | 85.7 | 41.1 | 63.0 | 83.1 | 33.1 | 91.0 | 43.6 |
| October 2017 | 11.1 | 5.1 | 5.0 | 5.5 | 6.1 | 56.5 | 78.9 | 31.3 | 85.8 | 41.0 | 63.6 | 83.2 | 33.0 | 90.9 | 43.7 |
| November 2017 | 11.0 | 4.9 | 4.6 | 5.1 | 6.2 | 57.3 | 78.7 | 31.9 | 86.1 | 41.0 | 64.3 | 82.7 | 33.4 | 90.7 | 43.7 |
| December 2017 | 10.5 | 4.8 | 4.5 | 4.9 | 6.1 | 57.2 | 78.9 | 32.0 | 86.4 | 41.3 | 63.9 | 82.9 | 33.6 | 90.9 | 43.9 |
| January 2018 | 10.9 | 4.9 | 4.6 | 5.0 | 5.9 | 56.7 | 78.3 | 31.8 | 86.4 | 40.9 | 63.6 | 82.3 | 33.3 | 90.9 | 43.4 |
| February 2018 | 11.1 | 4.9 | 4.3 | 4.9 | 5.7 | 56.5 | 78.5 | 31.6 | 86.7 | 40.6 | 63.5 | 82.6 | 33.0 | 91.1 | 43.1 |
| March 2018 | 10.9 | 4.7 | 4.8 | 4.9 | 5.6 | 56.9 | 78.8 | 31.1 | 86.3 | 41.2 | 63.8 | 82.7 | 32.7 | 90.8 | 43.6 |
| April 2018 | 11.1 | 4.7 | 4.4 | 5.0 | 6.1 | 56.4 | 79.0 | 31.4 | 86.3 | 40.6 | 63.4 | 82.9 | 32.8 | 90.9 | 43.2 |
| May 2018 | 11.1 | 4.9 | 4.4 | 5.0 | 5.6 | 56.4 | 78.7 | 31.5 | 86.0 | 40.8 | 63.4 | 82.7 | 33.0 | 90.6 | 43.2 |
| June 2018 | 11.7 | 5.2 | 4.5 | 5.0 | 5.7 | 56.5 | 78.8 | 31.4 | 86.0 | 41.0 | 64.0 | 83.0 | 32.9 | 90.6 | 43.5 |
| Source: Statistics Canada, table 1410028701 (formerly CANSIM table 282-0087). | |||||||||||||||
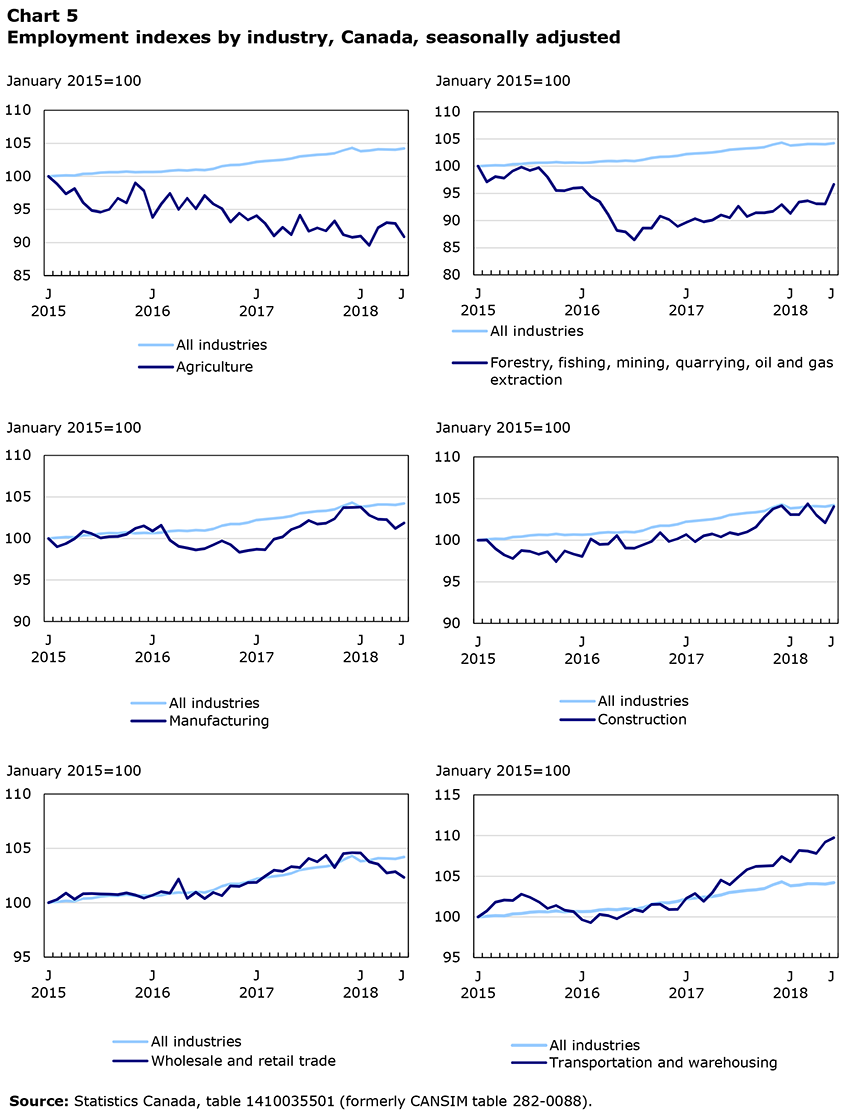
Data table for Chart 5
| Employment by industry | |||||||
|---|---|---|---|---|---|---|---|
| All industries | Agriculture | Forestry, fishing, mining, quarrying, oil and gas extraction | Manufacturing | Construction | Wholesale and retail trade | Transportation and warehousing | |
| January 2015=100 | |||||||
| January 2015 | 100.00 | 100.00 | 100.00 | 100.00 | 100.00 | 100.00 | 100.00 |
| February 2015 | 100.10 | 98.85 | 97.10 | 98.99 | 100.01 | 100.29 | 100.73 |
| March 2015 | 100.17 | 97.37 | 98.10 | 99.38 | 98.99 | 100.88 | 101.83 |
| April 2015 | 100.13 | 98.16 | 97.79 | 99.95 | 98.22 | 100.31 | 102.07 |
| May 2015 | 100.37 | 96.02 | 99.12 | 100.89 | 97.80 | 100.82 | 102.01 |
| June 2015 | 100.42 | 94.83 | 99.83 | 100.57 | 98.76 | 100.84 | 102.80 |
| July 2015 | 100.57 | 94.60 | 99.20 | 100.06 | 98.65 | 100.81 | 102.40 |
| August 2015 | 100.65 | 95.00 | 99.72 | 100.21 | 98.30 | 100.78 | 101.84 |
| September 2015 | 100.63 | 96.68 | 98.01 | 100.25 | 98.61 | 100.74 | 101.04 |
| October 2015 | 100.74 | 95.99 | 95.53 | 100.50 | 97.42 | 100.91 | 101.39 |
| November 2015 | 100.63 | 99.01 | 95.48 | 101.21 | 98.69 | 100.70 | 100.84 |
| December 2015 | 100.68 | 97.83 | 95.97 | 101.52 | 98.33 | 100.41 | 100.64 |
| January 2016 | 100.65 | 93.81 | 96.08 | 100.89 | 98.04 | 100.69 | 99.66 |
| February 2016 | 100.69 | 95.79 | 94.40 | 101.58 | 100.14 | 101.02 | 99.30 |
| March 2016 | 100.87 | 97.43 | 93.49 | 99.78 | 99.48 | 100.89 | 100.31 |
| April 2016 | 100.94 | 95.00 | 91.09 | 99.06 | 99.53 | 102.18 | 100.17 |
| May 2016 | 100.90 | 96.68 | 88.19 | 98.84 | 100.55 | 100.39 | 99.77 |
| June 2016 | 101.00 | 95.10 | 87.92 | 98.62 | 99.07 | 100.96 | 100.34 |
| July 2016 | 100.95 | 97.10 | 86.46 | 98.78 | 99.04 | 100.37 | 100.91 |
| August 2016 | 101.15 | 95.82 | 88.61 | 99.24 | 99.44 | 100.95 | 100.66 |
| September 2016 | 101.53 | 95.13 | 88.61 | 99.71 | 99.83 | 100.66 | 101.54 |
| October 2016 | 101.73 | 93.09 | 90.81 | 99.27 | 100.91 | 101.54 | 101.55 |
| November 2016 | 101.74 | 94.44 | 90.21 | 98.35 | 99.84 | 101.51 | 100.92 |
| December 2016 | 101.92 | 93.42 | 88.94 | 98.55 | 100.18 | 101.85 | 100.94 |
| January 2017 | 102.20 | 94.04 | 89.66 | 98.70 | 100.68 | 101.86 | 102.27 |
| February 2017 | 102.32 | 92.89 | 90.37 | 98.64 | 99.81 | 102.45 | 102.88 |
| March 2017 | 102.43 | 91.02 | 89.77 | 99.91 | 100.53 | 102.99 | 101.91 |
| April 2017 | 102.52 | 92.30 | 90.07 | 100.19 | 100.74 | 102.90 | 102.99 |
| May 2017 | 102.70 | 91.18 | 91.01 | 101.08 | 100.40 | 103.32 | 104.53 |
| June 2017 | 103.01 | 94.11 | 90.51 | 101.45 | 100.91 | 103.25 | 103.96 |
| July 2017 | 103.14 | 91.71 | 92.63 | 102.17 | 100.66 | 104.07 | 104.91 |
| August 2017 | 103.27 | 92.20 | 90.76 | 101.74 | 100.98 | 103.76 | 105.81 |
| September 2017 | 103.34 | 91.77 | 91.45 | 101.83 | 101.57 | 104.37 | 106.20 |
| October 2017 | 103.49 | 93.25 | 91.45 | 102.37 | 102.77 | 103.25 | 106.25 |
| November 2017 | 103.95 | 91.15 | 91.72 | 103.72 | 103.75 | 104.53 | 106.30 |
| December 2017 | 104.31 | 90.79 | 92.94 | 103.73 | 104.13 | 104.60 | 107.43 |
| January 2018 | 103.82 | 90.98 | 91.31 | 103.78 | 103.06 | 104.57 | 106.77 |
| February 2018 | 103.90 | 89.57 | 93.41 | 102.81 | 103.06 | 103.76 | 108.17 |
| March 2018 | 104.08 | 92.23 | 93.63 | 102.32 | 104.38 | 103.55 | 108.10 |
| April 2018 | 104.08 | 92.99 | 93.10 | 102.27 | 103.02 | 102.73 | 107.81 |
| May 2018 | 104.04 | 92.89 | 93.08 | 101.20 | 102.08 | 102.85 | 109.18 |
| June 2018 | 104.21 | 90.89 | 96.63 | 101.86 | 104.04 | 102.33 | 109.73 |
| Source: Statistics Canada, table 1410035501 (formerly CANSIM table 282-0088). | |||||||
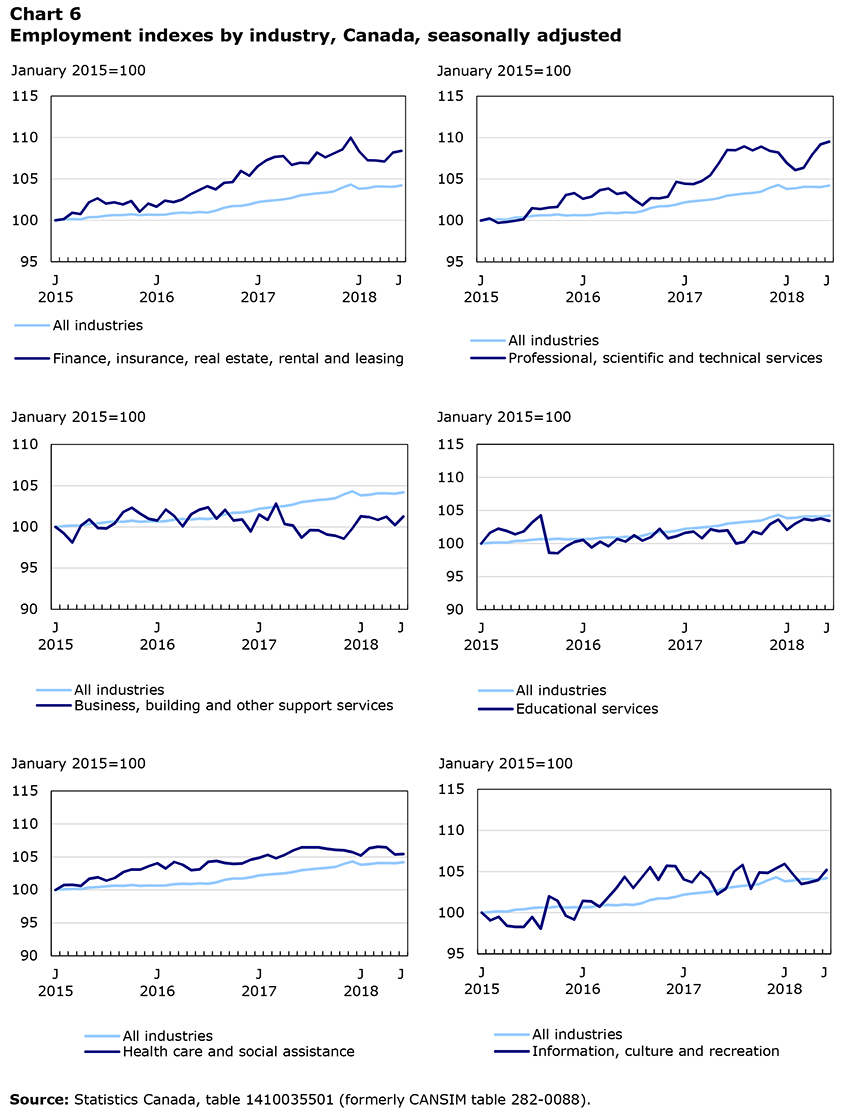
Data table for Chart 6
| Employment by industry | |||||||
|---|---|---|---|---|---|---|---|
| All industries | Finance, insurance, real estate, rental and leasing | Professional, scientific and technical services | Business, building and other support services | Educational services | Health care and social assistance | Information, culture and recreation | |
| January 2015=100 | |||||||
| January 2015 | 100.00 | 100.00 | 100.00 | 100.00 | 100.00 | 100.00 | 100.00 |
| February 2015 | 100.10 | 100.15 | 100.27 | 99.21 | 101.60 | 100.76 | 99.06 |
| March 2015 | 100.17 | 100.92 | 99.72 | 98.11 | 102.25 | 100.79 | 99.50 |
| April 2015 | 100.13 | 100.77 | 99.84 | 100.13 | 101.89 | 100.62 | 98.41 |
| May 2015 | 100.37 | 102.17 | 99.99 | 100.91 | 101.39 | 101.68 | 98.29 |
| June 2015 | 100.42 | 102.66 | 100.17 | 99.85 | 101.82 | 101.93 | 98.28 |
| July 2015 | 100.57 | 102.01 | 101.50 | 99.80 | 103.21 | 101.41 | 99.47 |
| August 2015 | 100.65 | 102.18 | 101.40 | 100.45 | 104.26 | 101.83 | 98.05 |
| September 2015 | 100.63 | 101.92 | 101.58 | 101.81 | 98.60 | 102.72 | 102.00 |
| October 2015 | 100.74 | 102.34 | 101.66 | 102.32 | 98.53 | 103.09 | 101.47 |
| November 2015 | 100.63 | 101.05 | 103.09 | 101.60 | 99.56 | 103.09 | 99.63 |
| December 2015 | 100.68 | 102.02 | 103.33 | 100.98 | 100.25 | 103.59 | 99.17 |
| January 2016 | 100.65 | 101.66 | 102.62 | 100.77 | 100.52 | 104.04 | 101.43 |
| February 2016 | 100.69 | 102.37 | 102.89 | 102.10 | 99.38 | 103.26 | 101.39 |
| March 2016 | 100.87 | 102.21 | 103.67 | 101.32 | 100.29 | 104.23 | 100.71 |
| April 2016 | 100.94 | 102.49 | 103.88 | 100.07 | 99.60 | 103.82 | 101.85 |
| May 2016 | 100.90 | 103.14 | 103.22 | 101.53 | 100.65 | 102.99 | 102.98 |
| June 2016 | 101.00 | 103.65 | 103.39 | 102.09 | 100.28 | 103.12 | 104.35 |
| July 2016 | 100.95 | 104.13 | 102.55 | 102.36 | 101.24 | 104.25 | 103.02 |
| August 2016 | 101.15 | 103.73 | 101.86 | 101.00 | 100.43 | 104.40 | 104.25 |
| September 2016 | 101.53 | 104.52 | 102.72 | 102.06 | 100.99 | 104.09 | 105.52 |
| October 2016 | 101.73 | 104.63 | 102.68 | 100.77 | 102.20 | 103.96 | 104.01 |
| November 2016 | 101.74 | 105.97 | 102.88 | 100.90 | 100.79 | 104.00 | 105.70 |
| December 2016 | 101.92 | 105.39 | 104.69 | 99.45 | 101.11 | 104.60 | 105.67 |
| January 2017 | 102.20 | 106.55 | 104.45 | 101.49 | 101.62 | 104.88 | 104.06 |
| February 2017 | 102.32 | 107.26 | 104.41 | 100.86 | 101.79 | 105.32 | 103.69 |
| March 2017 | 102.43 | 107.65 | 104.78 | 102.83 | 100.78 | 104.79 | 104.98 |
| April 2017 | 102.52 | 107.76 | 105.47 | 100.36 | 102.16 | 105.32 | 104.14 |
| May 2017 | 102.70 | 106.69 | 106.93 | 100.16 | 101.87 | 106.00 | 102.24 |
| June 2017 | 103.01 | 106.94 | 108.51 | 98.71 | 101.98 | 106.46 | 102.90 |
| July 2017 | 103.14 | 106.89 | 108.50 | 99.60 | 100.00 | 106.45 | 105.03 |
| August 2017 | 103.27 | 108.20 | 108.95 | 99.58 | 100.25 | 106.46 | 105.81 |
| September 2017 | 103.34 | 107.61 | 108.46 | 99.06 | 101.79 | 106.23 | 102.91 |
| October 2017 | 103.49 | 108.09 | 108.92 | 98.92 | 101.43 | 106.06 | 104.90 |
| November 2017 | 103.95 | 108.55 | 108.41 | 98.56 | 102.92 | 106.02 | 104.83 |
| December 2017 | 104.31 | 109.98 | 108.21 | 99.83 | 103.61 | 105.73 | 105.41 |
| January 2018 | 103.82 | 108.32 | 106.97 | 101.28 | 102.05 | 105.23 | 105.93 |
| February 2018 | 103.90 | 107.26 | 106.09 | 101.18 | 103.02 | 106.32 | 104.66 |
| March 2018 | 104.08 | 107.23 | 106.37 | 100.84 | 103.69 | 106.55 | 103.51 |
| April 2018 | 104.08 | 107.10 | 107.95 | 101.24 | 103.53 | 106.47 | 103.71 |
| May 2018 | 104.04 | 108.20 | 109.21 | 100.22 | 103.75 | 105.39 | 103.97 |
| June 2018 | 104.21 | 108.38 | 109.52 | 101.27 | 103.42 | 105.44 | 105.19 |
| Source: Statistics Canada, table 1410035501 (formerly CANSIM table 282-0088). | |||||||

Data table for Chart 7
| Employment by industry | ||||
|---|---|---|---|---|
| All industries | Accommodation and food services | Other services (except public administration) | Public administration | |
| January 2015=100 | ||||
| January 2015 | 100.00 | 100.00 | 100.00 | 100.00 |
| February 2015 | 100.10 | 100.48 | 99.59 | 100.38 |
| March 2015 | 100.17 | 100.15 | 99.76 | 99.91 |
| April 2015 | 100.13 | 100.02 | 100.98 | 99.73 |
| May 2015 | 100.37 | 99.95 | 99.67 | 98.62 |
| June 2015 | 100.42 | 99.00 | 98.20 | 99.37 |
| July 2015 | 100.57 | 98.64 | 99.48 | 100.59 |
| August 2015 | 100.65 | 98.01 | 99.59 | 101.58 |
| September 2015 | 100.63 | 97.91 | 102.23 | 101.36 |
| October 2015 | 100.74 | 98.68 | 100.20 | 104.82 |
| November 2015 | 100.63 | 98.04 | 99.31 | 101.29 |
| December 2015 | 100.68 | 97.30 | 99.19 | 101.87 |
| January 2016 | 100.65 | 97.30 | 100.56 | 101.18 |
| February 2016 | 100.69 | 96.34 | 99.06 | 100.38 |
| March 2016 | 100.87 | 98.02 | 100.34 | 100.44 |
| April 2016 | 100.94 | 99.89 | 99.23 | 101.23 |
| May 2016 | 100.90 | 98.94 | 101.61 | 103.55 |
| June 2016 | 101.00 | 100.18 | 101.39 | 103.10 |
| July 2016 | 100.95 | 100.11 | 101.11 | 100.70 |
| August 2016 | 101.15 | 100.10 | 102.23 | 102.84 |
| September 2016 | 101.53 | 100.60 | 101.61 | 104.44 |
| October 2016 | 101.73 | 99.96 | 103.25 | 105.33 |
| November 2016 | 101.74 | 100.12 | 104.61 | 106.15 |
| December 2016 | 101.92 | 99.62 | 104.69 | 106.31 |
| January 2017 | 102.20 | 99.63 | 103.92 | 107.15 |
| February 2017 | 102.32 | 99.30 | 103.83 | 107.99 |
| March 2017 | 102.43 | 98.90 | 102.70 | 107.51 |
| April 2017 | 102.52 | 97.96 | 102.44 | 107.17 |
| May 2017 | 102.70 | 98.42 | 102.07 | 106.22 |
| June 2017 | 103.01 | 98.86 | 102.33 | 106.47 |
| July 2017 | 103.14 | 99.02 | 101.36 | 105.63 |
| August 2017 | 103.27 | 99.61 | 100.16 | 106.21 |
| September 2017 | 103.34 | 99.37 | 101.11 | 106.43 |
| October 2017 | 103.49 | 99.04 | 102.96 | 106.34 |
| November 2017 | 103.95 | 99.86 | 102.58 | 106.20 |
| December 2017 | 104.31 | 100.38 | 104.04 | 105.91 |
| January 2018 | 103.82 | 99.45 | 104.19 | 105.42 |
| February 2018 | 103.90 | 100.02 | 106.37 | 106.42 |
| March 2018 | 104.08 | 100.20 | 105.99 | 107.74 |
| April 2018 | 104.08 | 101.58 | 105.82 | 108.09 |
| May 2018 | 104.04 | 103.02 | 104.22 | 107.98 |
| June 2018 | 104.21 | 101.72 | 103.66 | 107.32 |
| Source: Statistics Canada, table 1410035501 (formerly CANSIM table 282-0088). | ||||
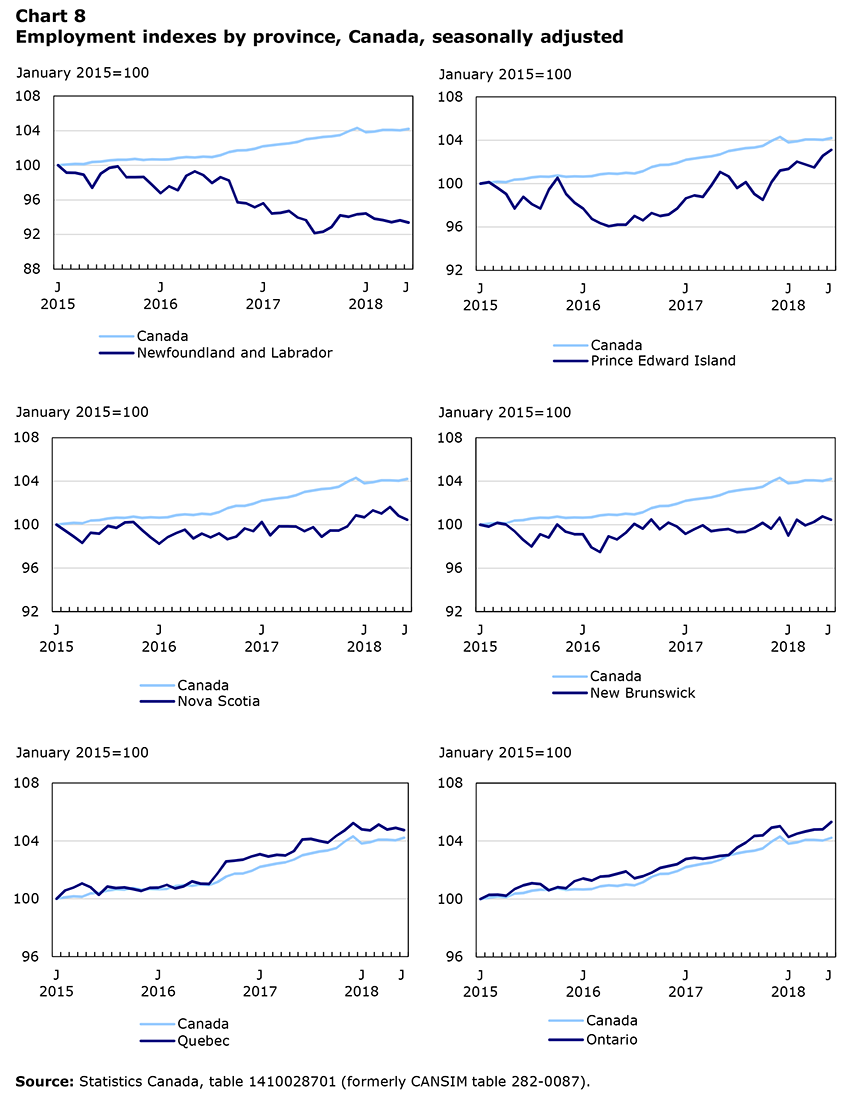
Data table for Chart 8
| Employment by province | |||||||
|---|---|---|---|---|---|---|---|
| Canada | Newfoundland and Labrador | Prince Edward Island | Nova Scotia | New Brunswick | Quebec | Ontario | |
| January 2015=100 | |||||||
| January 2015 | 100.00 | 100.00 | 100.00 | 100.00 | 100.00 | 100.00 | 100.00 |
| February 2015 | 100.10 | 99.16 | 100.14 | 99.47 | 99.83 | 100.57 | 100.28 |
| March 2015 | 100.17 | 99.12 | 99.59 | 98.91 | 100.17 | 100.76 | 100.30 |
| April 2015 | 100.13 | 98.91 | 99.05 | 98.31 | 100.03 | 101.06 | 100.22 |
| May 2015 | 100.37 | 97.40 | 97.70 | 99.25 | 99.41 | 100.79 | 100.68 |
| June 2015 | 100.42 | 99.04 | 98.78 | 99.18 | 98.62 | 100.27 | 100.95 |
| July 2015 | 100.57 | 99.71 | 98.11 | 99.89 | 98.00 | 100.84 | 101.09 |
| August 2015 | 100.65 | 99.87 | 97.70 | 99.71 | 99.12 | 100.74 | 101.03 |
| September 2015 | 100.63 | 98.62 | 99.46 | 100.20 | 98.81 | 100.78 | 100.59 |
| October 2015 | 100.74 | 98.62 | 100.54 | 100.24 | 100.03 | 100.66 | 100.82 |
| November 2015 | 100.63 | 98.66 | 99.05 | 99.49 | 99.35 | 100.54 | 100.75 |
| December 2015 | 100.68 | 97.74 | 98.24 | 98.82 | 99.12 | 100.76 | 101.23 |
| January 2016 | 100.65 | 96.77 | 97.70 | 98.25 | 99.12 | 100.76 | 101.42 |
| February 2016 | 100.69 | 97.57 | 96.75 | 98.85 | 97.91 | 100.95 | 101.27 |
| March 2016 | 100.87 | 97.11 | 96.35 | 99.22 | 97.49 | 100.71 | 101.54 |
| April 2016 | 100.94 | 98.78 | 96.08 | 99.53 | 98.93 | 100.85 | 101.59 |
| May 2016 | 100.90 | 99.29 | 96.21 | 98.73 | 98.64 | 101.19 | 101.74 |
| June 2016 | 101.00 | 98.87 | 96.21 | 99.18 | 99.24 | 101.04 | 101.90 |
| July 2016 | 100.95 | 97.95 | 97.02 | 98.82 | 100.08 | 101.03 | 101.43 |
| August 2016 | 101.15 | 98.62 | 96.62 | 99.20 | 99.63 | 101.77 | 101.57 |
| September 2016 | 101.53 | 98.24 | 97.29 | 98.67 | 100.48 | 102.57 | 101.81 |
| October 2016 | 101.73 | 95.73 | 97.02 | 98.89 | 99.58 | 102.64 | 102.15 |
| November 2016 | 101.74 | 95.60 | 97.16 | 99.64 | 100.20 | 102.71 | 102.27 |
| December 2016 | 101.92 | 95.14 | 97.70 | 99.40 | 99.83 | 102.92 | 102.40 |
| January 2017 | 102.20 | 95.60 | 98.65 | 100.24 | 99.15 | 103.07 | 102.76 |
| February 2017 | 102.32 | 94.43 | 98.92 | 99.02 | 99.58 | 102.92 | 102.85 |
| March 2017 | 102.43 | 94.51 | 98.78 | 99.84 | 99.94 | 103.04 | 102.78 |
| April 2017 | 102.52 | 94.72 | 99.86 | 99.84 | 99.41 | 103.00 | 102.86 |
| May 2017 | 102.70 | 93.96 | 101.08 | 99.82 | 99.52 | 103.30 | 102.98 |
| June 2017 | 103.01 | 93.67 | 100.68 | 99.40 | 99.60 | 104.09 | 103.04 |
| July 2017 | 103.14 | 92.16 | 99.59 | 99.76 | 99.32 | 104.13 | 103.54 |
| August 2017 | 103.27 | 92.33 | 100.14 | 98.89 | 99.35 | 103.99 | 103.89 |
| September 2017 | 103.34 | 92.88 | 99.05 | 99.47 | 99.69 | 103.88 | 104.35 |
| October 2017 | 103.49 | 94.22 | 98.51 | 99.47 | 100.17 | 104.34 | 104.39 |
| November 2017 | 103.95 | 94.05 | 100.14 | 99.84 | 99.63 | 104.73 | 104.93 |
| December 2017 | 104.31 | 94.34 | 101.22 | 100.84 | 100.65 | 105.23 | 105.02 |
| January 2018 | 103.82 | 94.43 | 101.35 | 100.69 | 99.01 | 104.80 | 104.28 |
| February 2018 | 103.90 | 93.84 | 102.03 | 101.31 | 100.45 | 104.73 | 104.51 |
| March 2018 | 104.08 | 93.67 | 101.76 | 101.02 | 99.94 | 105.13 | 104.66 |
| April 2018 | 104.08 | 93.42 | 101.49 | 101.62 | 100.25 | 104.79 | 104.79 |
| May 2018 | 104.04 | 93.63 | 102.57 | 100.82 | 100.76 | 104.90 | 104.81 |
| June 2018 | 104.21 | 93.38 | 103.11 | 100.44 | 100.45 | 104.74 | 105.32 |
| Source: Statistics Canada, table 1410028701 (formerly CANSIM table 282-0087). | |||||||
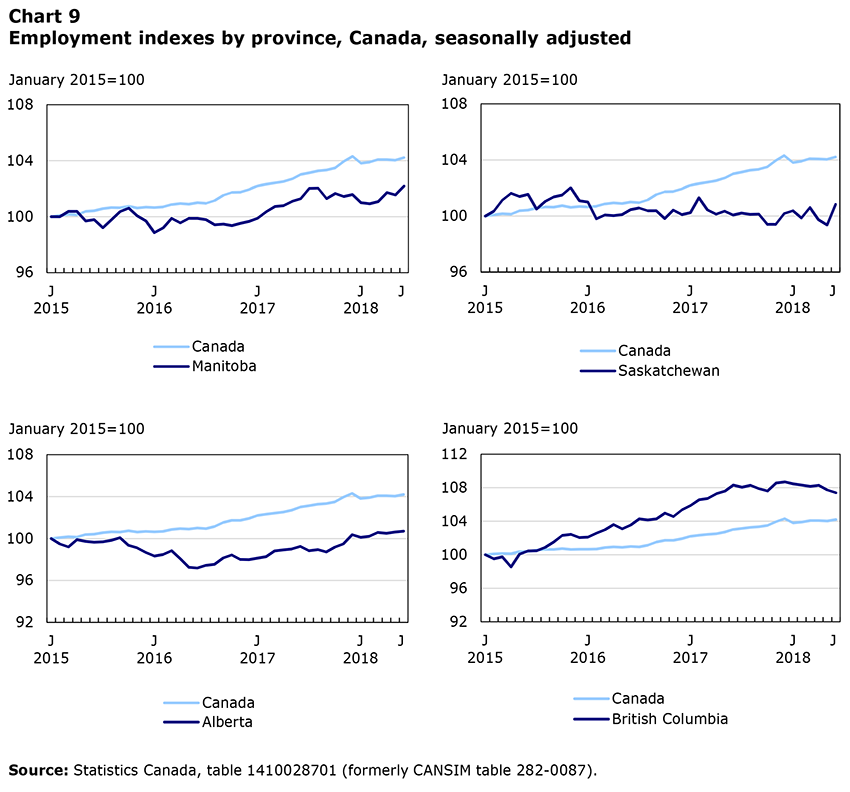
Data table for Chart 9
| Employment by province | |||||
|---|---|---|---|---|---|
| Canada | Manitoba | Saskatchewan | Alberta | British Columbia | |
| January 2015=100 | |||||
| January 2015 | 100.00 | 100.00 | 100.00 | 100.00 | 100.00 |
| February 2015 | 100.10 | 100.00 | 100.35 | 99.49 | 99.52 |
| March 2015 | 100.17 | 100.38 | 101.13 | 99.20 | 99.76 |
| April 2015 | 100.13 | 100.38 | 101.62 | 99.90 | 98.56 |
| May 2015 | 100.37 | 99.70 | 101.39 | 99.72 | 100.07 |
| June 2015 | 100.42 | 99.78 | 101.55 | 99.65 | 100.47 |
| July 2015 | 100.57 | 99.21 | 100.49 | 99.69 | 100.49 |
| August 2015 | 100.65 | 99.76 | 101.04 | 99.83 | 100.89 |
| September 2015 | 100.63 | 100.36 | 101.36 | 100.06 | 101.53 |
| October 2015 | 100.74 | 100.60 | 101.50 | 99.35 | 102.32 |
| November 2015 | 100.63 | 100.06 | 102.01 | 99.11 | 102.43 |
| December 2015 | 100.68 | 99.70 | 101.09 | 98.68 | 102.05 |
| January 2016 | 100.65 | 98.85 | 101.00 | 98.33 | 102.11 |
| February 2016 | 100.69 | 99.20 | 99.81 | 98.47 | 102.60 |
| March 2016 | 100.87 | 99.87 | 100.07 | 98.84 | 103.00 |
| April 2016 | 100.94 | 99.56 | 100.04 | 98.09 | 103.60 |
| May 2016 | 100.90 | 99.87 | 100.11 | 97.25 | 103.08 |
| June 2016 | 101.00 | 99.87 | 100.46 | 97.18 | 103.56 |
| July 2016 | 100.95 | 99.78 | 100.58 | 97.45 | 104.29 |
| August 2016 | 101.15 | 99.42 | 100.37 | 97.55 | 104.16 |
| September 2016 | 101.53 | 99.47 | 100.37 | 98.15 | 104.28 |
| October 2016 | 101.73 | 99.36 | 99.82 | 98.44 | 104.96 |
| November 2016 | 101.74 | 99.53 | 100.42 | 98.01 | 104.56 |
| December 2016 | 101.92 | 99.67 | 100.11 | 97.99 | 105.38 |
| January 2017 | 102.20 | 99.89 | 100.25 | 98.13 | 105.88 |
| February 2017 | 102.32 | 100.35 | 101.30 | 98.27 | 106.57 |
| March 2017 | 102.43 | 100.72 | 100.44 | 98.82 | 106.73 |
| April 2017 | 102.52 | 100.79 | 100.14 | 98.91 | 107.28 |
| May 2017 | 102.70 | 101.08 | 100.35 | 99.01 | 107.59 |
| June 2017 | 103.01 | 101.27 | 100.07 | 99.25 | 108.31 |
| July 2017 | 103.14 | 102.01 | 100.21 | 98.84 | 108.07 |
| August 2017 | 103.27 | 102.03 | 100.12 | 98.95 | 108.29 |
| September 2017 | 103.34 | 101.29 | 100.14 | 98.72 | 107.89 |
| October 2017 | 103.49 | 101.65 | 99.40 | 99.18 | 107.61 |
| November 2017 | 103.95 | 101.45 | 99.40 | 99.49 | 108.56 |
| December 2017 | 104.31 | 101.57 | 100.18 | 100.37 | 108.70 |
| January 2018 | 103.82 | 101.01 | 100.37 | 100.11 | 108.48 |
| February 2018 | 103.90 | 100.93 | 99.86 | 100.21 | 108.33 |
| March 2018 | 104.08 | 101.07 | 100.60 | 100.57 | 108.16 |
| April 2018 | 104.08 | 101.71 | 99.74 | 100.49 | 108.28 |
| May 2018 | 104.04 | 101.54 | 99.37 | 100.62 | 107.74 |
| June 2018 | 104.21 | 102.18 | 100.83 | 100.71 | 107.39 |
| Source: Statistics Canada, table 1410028701 (formerly CANSIM table 282-0087). | |||||
Data quality
Definitions and explanations
The labour force is composed of civilian, non-institutionalized persons 15 years of age and over who, during the reference week, were employed or unemployed.
Employed persons are those who, during the reference week:
- did any work at all at a job or business; that is, paid work in the context of an employer-employee relationship, or self-employment. It also includes persons who did unpaid family work, which is defined as unpaid work contributing directly to the operation of a farm, business or professional practice owned and operated by a related member of the same household; or
- had a job but were not at work due to illness or disability, personal or family responsibilities, vacation or labour dispute. This category excludes persons not at work because they were on layoff or between casual jobs, and those who did not then have a job (even if they had a job to start at a future date).
Full-time employment consists of persons who usually work 30 hours or more per week at their main or only job. Part-time employment consists of persons who usually work less than 30 hours per week at their main or only job. This information is available for those currently employed or who last worked within the previous year.
Unemployed persons are those who, during the reference week:
- were without work, but had looked for work in the past four weeks ending with the reference period and were available for work; or
- were on temporary layoff due to business conditions, with an expectation of recall, and were available for work; or
- were without work, but had a job to start within four weeks from the reference period and were available for work.
Civilian, non-institutionalized persons 15 years of age and over who, during the reference week, were neither employed nor unemployed are classified as not in the labour force. This includes persons who, during the reference period, were either unable to work or unavailable for work. It also includes persons who were without work and who had neither looked for work in the past four weeks, nor had a job to start within four weeks of the reference period.
The unemployment rate represents the number of unemployed persons expressed as a percentage of the labour force (employed and unemployed). The unemployment rate for a particular group (for example, one defined by age, sex, or marital status) is the number of unemployed persons in that group expressed as a percentage of the labour force for that same group.
The participation rate represents the total labour force expressed as a percentage of the population aged 15 years and over. The participation rate for a particular group (for example, women aged 25 years and over) is the labour force of that group expressed as a percentage of the population for that group.
The employment rate represents the number of employed persons expressed as a percentage of the population aged 15 years and over. The employment rate for a particular group (for example, one defined by age, sex, marital status, or province) is the number employed in that group expressed as a percentage of the population for that group.
All geographic regions are based on the 2011 Census boundaries.
Seasonal adjustment
Fluctuations in economic time series are caused by seasonal, cyclical and irregular movements. A seasonally adjusted series is one from which seasonal movements have been eliminated. Seasonal movements are defined as those which are caused by regular annual events such as climate change, holidays, vacation periods, cycles related to crops, and production and retail sales associated with Christmas and Easter. It should be noted that the seasonally adjusted series contain irregular as well as longer-term cyclical fluctuations.
The seasonally adjusted series are revised each year to take into account current data and to generate new forecast factors for the next twelve months. The data are therefore subject to slight revisions in future issues of this publication.
For more information on seasonal adjustment, see Seasonally adjusted data – Frequently asked questions.
Documentation
For more detailed information about the Labour Force Survey, see the following documents:
- Overview of the Labour Force Survey (LFS) 3701
- Guide to the Labour Force Survey (71-543-G)
- Methodology of the Canadian Labour Force Survey (71-526-X)
- LFS geographical maps
Publication information
Special requests ($)
Custom tabulations can be arranged on an ad hoc or regular basis. This service enables you to specify tables and time series to meet your own requirements. The cost varies according to the request. For more information, contact us toll-free at 1-866-873-8788 or e-mail us at statcan.labour-travail.statcan@canada.ca.
| Release date | Reference period |
|---|---|
| February 9, 2018 | January 14 to 20, 2018 |
| March 9, 2018 | February 11 to 17, 2018 |
| April 6, 2018 | March 11 to 17, 2018 |
| May 11, 2018 | April 15 to 21, 2018 |
| June 8, 2018 | May 13 to 19, 2018 |
| July 6, 2018 | June 10 to 16, 2018 |
| August 10, 2018 | July 15 to 21, 2018 |
| September 7, 2018 | August 12 to 18, 2018 |
| October 5, 2018 | September 9 to 15, 2018 |
| November 2, 2018 | October 7 to 13, 2018 |
| December 7, 2018 | November 4 to 10, 2018 |
| January 4, 2019 | December 2 to 8, 2018 |
Related products
Publications
Tables
(formerly CANSIM table 279-0029)
(formerly CANSIM table 279-0030)
(formerly CANSIM table 279-0032)
(formerly CANSIM table 279-0033)
(formerly CANSIM table 279-0034)
(formerly CANSIM table 279-0035)
(formerly CANSIM table 279-0036)
(formerly CANSIM table 279-0037)
(formerly CANSIM table 279-0038)
(formerly CANSIM table 279-0039)
(formerly CANSIM table 279-0040)
(formerly CANSIM table 282-0001)
(formerly CANSIM table 282-0001)
(formerly CANSIM table 282-0002)
(formerly CANSIM table 282-0003)
(formerly CANSIM table 282-0004)
(formerly CANSIM table 282-0005)
(formerly CANSIM table 282-0006)
(formerly CANSIM table 282-0006)
(formerly CANSIM table 282-0006)
(formerly CANSIM table 282-0007)
(formerly CANSIM table 282-0008)
(formerly CANSIM table 282-0011)
(formerly CANSIM table 282-0012)
(formerly CANSIM table 282-0013)
(formerly CANSIM table 282-0014)
(formerly CANSIM table 282-0015)
(formerly CANSIM table 282-0016)
(formerly CANSIM table 282-0017)
(formerly CANSIM table 282-0018)
(formerly CANSIM table 282-0019)
(formerly CANSIM table 282-0020)
(formerly CANSIM table 282-0021)
(formerly CANSIM table 282-0022)
(formerly CANSIM table 282-0027)
(formerly CANSIM table 282-0028)
(formerly CANSIM table 282-0031)
(formerly CANSIM table 282-0032)
(formerly CANSIM table 282-0035)
(formerly CANSIM table 282-0035)
(formerly CANSIM table 282-0036)
(formerly CANSIM table 282-0036)
(formerly CANSIM table 282-0037)
(formerly CANSIM table 282-0038)
(formerly CANSIM table 282-0041)
(formerly CANSIM table 282-0042)
(formerly CANSIM table 282-0047)
(formerly CANSIM table 282-0048)
(formerly CANSIM table 282-0049)
(formerly CANSIM table 282-0050)
(formerly CANSIM table 282-0051)
(formerly CANSIM table 282-0071)
(formerly CANSIM table 282-0072)
(formerly CANSIM table 282-0073)
(formerly CANSIM table 282-0074)
(formerly CANSIM table 282-0075)
(formerly CANSIM table 282-0076)
(formerly CANSIM table 282-0077)
(formerly CANSIM table 282-0078)
(formerly CANSIM table 282-0079)
(formerly CANSIM table 282-0080)
(formerly CANSIM table 282-0083)
(formerly CANSIM table 282-0084)
(formerly CANSIM table 282-0085)
(formerly CANSIM table 282-0086)
(formerly CANSIM table 282-0087)
(formerly CANSIM table 282-0087)
(formerly CANSIM table 282-0087)
(formerly CANSIM table 282-0088)
(formerly CANSIM table 282-0088)
(formerly CANSIM table 282-0089)
(formerly CANSIM table 282-0089)
(formerly CANSIM table 282-0092)
(formerly CANSIM table 282-0092)
(formerly CANSIM table 282-0094)
(formerly CANSIM table 282-0094)
(formerly CANSIM table 282-0095)
(formerly CANSIM table 282-0100)
(formerly CANSIM table 282-0100)
(formerly CANSIM table 282-0101)
(formerly CANSIM table 282-0102)
(formerly CANSIM table 282-0103)
(formerly CANSIM table 282-0104)
(formerly CANSIM table 282-0105)
(formerly CANSIM table 282-0106)
(formerly CANSIM table 282-0107)
(formerly CANSIM table 282-0108)
(formerly CANSIM table 282-0122)
(formerly CANSIM table 282-0122)
(formerly CANSIM table 282-0123)
(formerly CANSIM table 282-0124)
(formerly CANSIM table 282-0125)
(formerly CANSIM table 282-0128)
(formerly CANSIM table 282-0129)
(formerly CANSIM table 282-0130)
(formerly CANSIM table 282-0131)
(formerly CANSIM table 282-0134)
(formerly CANSIM table 282-0135)
(formerly CANSIM table 282-0135)
(formerly CANSIM table 282-0136)
(formerly CANSIM table 282-0136)
(formerly CANSIM table 282-0137)
(formerly CANSIM table 282-0138)
(formerly CANSIM table 282-0139)
(formerly CANSIM table 282-0140)
(formerly CANSIM table 282-0141)
(formerly CANSIM table 282-0142)
(formerly CANSIM table 282-0143)
(formerly CANSIM table 282-0144)
(formerly CANSIM table 282-0145)
(formerly CANSIM table 282-0146)
(formerly CANSIM table 282-0147)
(formerly CANSIM table 282-0148)
(formerly CANSIM table 282-0149)
(formerly CANSIM table 282-0150)
(formerly CANSIM table 282-0151)
(formerly CANSIM table 282-0152)
(formerly CANSIM table 282-0153)
(formerly CANSIM table 282-0154)
(formerly CANSIM table 282-0155)
(formerly CANSIM table 282-0155)
(formerly CANSIM table 282-0156)
(formerly CANSIM table 282-0157)
(formerly CANSIM table 282-0158)
(formerly CANSIM table 282-0159)
(formerly CANSIM table 282-0160)
(formerly CANSIM table 282-0161)
(formerly CANSIM table 282-0162)
(formerly CANSIM table 282-0163)
(formerly CANSIM table 282-0164)
(formerly CANSIM table 282-0165)
(formerly CANSIM table 282-0166)
(formerly CANSIM table 282-0167)
(formerly CANSIM table 282-0167)
(formerly CANSIM table 282-0168)
(formerly CANSIM table 282-0200)
(formerly CANSIM table 282-0201)
(formerly CANSIM table 282-0204)
(formerly CANSIM table 282-0205)
(formerly CANSIM table 282-0208)
(formerly CANSIM table 282-0209)
(formerly CANSIM table 282-0210)
(formerly CANSIM table 282-0211)
(formerly CANSIM table 282-0212)
(formerly CANSIM table 282-0213)
(formerly CANSIM table 282-0214)
(formerly CANSIM table 282-0215)
(formerly CANSIM table 282-0216)
(formerly CANSIM table 282-0217)
(formerly CANSIM table 282-0218)
(formerly CANSIM table 282-0219)
(formerly CANSIM table 282-0220)
(formerly CANSIM table 282-0221)
(formerly CANSIM table 282-0223)
(formerly CANSIM table 282-0224)
(formerly CANSIM table 282-0225)
(formerly CANSIM table 282-0226)
(formerly CANSIM table 282-0227)
(formerly CANSIM table 282-0228)
(formerly CANSIM table 282-0229)
(formerly CANSIM table 282-0230)
(formerly CANSIM table 282-0233)
Survey
Summary tables
Note
Effective June 4, 2018, all but two summary tables were discontinued:
Canada: Economic and financial data
Links to the table replacements are provided below.
- Average hourly wages of employees by selected characteristics and occupation, unadjusted data, by province (monthly) was replaced by table 14-10-0320-02.
- Days lost per worker by industry and sex was replaced by table 14-10-0191-01
- People employed, by educational attainment was replaced by table 14-10-0020-01.
- Reasons for part-time work by sex and age group was replaced by table 14-10-0029-01.
- Self-employment, historical summary was replaced by table 14-10-0027-01.
- Employment by age, sex, type of work, class of worker and province (monthly) was replaced by table 14-10-0288-02.
- Actual hours worked per week by industry, seasonally adjusted (monthly) was replaced by table 14-10-0289-02.
- Labour force characteristics, unadjusted, by territory (3 month moving average) was replaced by table 14-10-0292-01.
- Employment by industry and sex was replaced by table 14-10-0023-01.
- Full-time and part-time employment by sex and age group was replaced by table 14-10-0018-01.
- Labour force characteristics by age and sex was replaced by table 14-10-0018-01.
- Labour force characteristics by immigrant status of population aged 25 to 54, and by educational attainment was replaced by table 14-10-0087-01.
- Labour force characteristics by immigrant status, by detailed age group was replaced by table 14-10-0085-01.
- Labour force characteristics by immigrant status of population aged 25 to 54, by country of birth was replaced by table 14-10-0089-01.
- Days lost per worker due to illness or disability, by sex, by province was replaced by table 14-10-0190-01.
- Employment by industry was replaced by table 14-10-0023-01.
- Labour force characteristics, seasonally adjusted, by province (monthly) was replaced by table 14-10-0287-03.
- Labour force characteristics, unadjusted, by province (monthly) was replaced by table 14-10-0017-02.
- Labour force, employment and unemployment, levels and rates, by province was replaced by table 14-10-0018-01.
- Economic indicators, by province and territory (monthly and quarterly) was replaced by summary table Canada: Economic and financial data.
- Days lost per worker by reason, by provinces was replaced by table 14-10-0190-01.
- Labour force characteristics, seasonally adjusted, by census metropolitan area (3 month moving average) was replaced by table 14-10-0294-02.
- Labour force characteristics, unadjusted, by economic region (3 month moving average) was replaced by table 14-10-0293-02.
- Distribution of employed people, by industry, by province was replaced by table 14-10-0023-01.
- Employment by major industry group, seasonally adjusted, by province (monthly) was replaced by table 14-10-0355-02.
- Labour force characteristics was replaced by table 14-10-0037-01.
- Labour force characteristics, unadjusted, by census metropolitan area (3 month moving average) was replaced by table 14-10-0294-01.
- Labour force characteristics, population 15 years and older, by census metropolitan area was replaced by table 14-10-0096-01.
- Labour force characteristics, population 15 years and older, by economic region, by province was replaced by table 14-10-0090-01.
- Labour force characteristics by sex and age group was replaced by table 14-10-0018-01.
- Labour force characteristics by immigrant status of population aged 25 to 54, by province was replaced by table 14-10-0083-01.
- Date modified: