Population growth: Migratory increase overtakes natural increase
Archived Content
Information identified as archived is provided for reference, research or recordkeeping purposes. It is not subject to the Government of Canada Web Standards and has not been altered or updated since it was archived. Please "contact us" to request a format other than those available.

Population growth = (natural increase=births-deaths) + (migratory increase=immigration-emigration).
While the mathematics of population growth is simple, the dynamics behind the drivers of demographic changes are more complex. Over Canada's 150-year history, there have been many.
In recent times, the contribution of natural increase to population growth has waned as the Canadian population aged and fertility rates declined. Today, natural increase accounts for less than one-third of Canada's population growth and has ceased to be the major player in the equation.
Meanwhile, migratory increase plays an increasing role in Canada's population growth. Migratory increase currently accounts for about two-thirds of Canada's population growth.
Statistics Canada projects that immigration will not only continue to be a key driver of population growth in the coming years—without it, Canada's population growth could be close to zero in 20 years, as the population continues to age and fertility rates projected to remain below the replacement level of 2.1 children per woman.

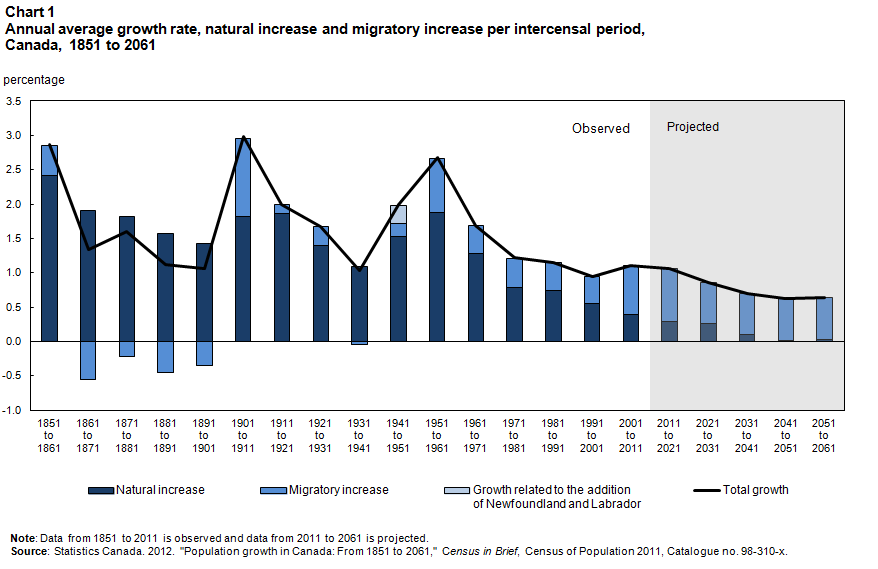
Description for Chart 1
| Period | Total growth | Natural increase | Migratory increase | Growth related to the addition of Newfoundland and Labrador |
|---|---|---|---|---|
| Source: Population growth in Canada: From 1851 to 2061, Census in Brief, 2011 Census of Population (98-310-X), Statistics Canada, 2012. | ||||
| 1851 to 1861 | 2.86 | 2.41 | 0.44 | |
| 1861 to 1871 | 1.34 | 1.90 | -0.55 | |
| 1871 to 1881 | 1.60 | 1.82 | -0.22 | |
| 1881 to 1891 | 1.12 | 1.57 | -0.45 | |
| 1891 to 1901 | 1.06 | 1.42 | -0.35 | |
| 1901 to 1911 | 2.98 | 1.82 | 1.14 | |
| 1911 to 1921 | 2.00 | 1.86 | 0.14 | |
| 1921 to 1931 | 1.68 | 1.39 | 0.29 | |
| 1931 to 1941 | 1.04 | 1.09 | -0.05 | |
| 1941 to 1951 | 1.99 | 1.53 | 0.18 | 0.27 |
| 1951 to 1961 | 2.67 | 1.87 | 0.79 | |
| 1961 to 1971 | 1.69 | 1.28 | 0.41 | |
| 1971 to 1981 | 1.22 | 0.79 | 0.42 | |
| 1981 to 1991 | 1.15 | 0.74 | 0.41 | |
| 1991 to 2001 | 0.95 | 0.55 | 0.40 | |
| 2001 to 2011 | 1.11 | 0.39 | 0.71 | |
| 2011 to 2021 | 1.07 | 0.42 | 0.64 | |
| 2021 to 2031 | 0.92 | 0.30 | 0.62 | |
| 2031 to 2041 | 0.79 | 0.14 | 0.64 | |
| 2041 to 2051 | 0.73 | 0.08 | 0.65 | |
| 2051 to 2061 | 0.72 | 0.07 | 0.66 | |
Strong population growth in three periods
Three periods in Canada's history were characterized by strong population growth: 1851 to 1861, 1901 to 1911, and 1941 to 1961.
First, prior to Confederation, there was strong growth during the 1851 to 1861 period of 2.86% per year, on average, when fertility levels were high and large numbers of immigrants were settling in the West.
Second, in the early 20th century, fertility was still relatively high, averaging almost five children per woman. In addition, between 1901 and 1911, more than 1.2 million immigrants to Canada—mostly from Europe—generated what was then a record migratory increase. Between 1901 and 1911, the population increased 2.98% a year on average, the highest growth on record.
Third, a period of strong population growth occurred following the Second World War (2.67% per year on average). A significant rise in fertility resulted in the post-war baby boom, which continued until the mid-1960s. Fertility rose from 2.6 children per woman in 1937 to 3.9 children in the late 1950s—a level not seen since the beginning of the century. Immigration was also particularly high during the 1950s. In 1957, for example, against the backdrop of the Hungarian Revolution and the Suez Canal crisis, Canada received more than 282,000 immigrants.
Natural increase—once the primary factor behind population growth
For much of Canada's history, natural increase was the primary factor behind population growth. In fact, population growth was entirely a result of natural increase during the last four decades of the 19th century (1861 to 1901) and during the 1930s (1931 to 1941). Throughout these periods, there were migratory losses—more people left Canada than entered the country.
From 1861 to 1901, Canada experienced several waves of immigration, mainly from Europe. Starting in 1880, many immigrants, including some from Asia, entered Canada to work on the construction of the Canadian Pacific Railway. However, more people, especially those living in Eastern Canada, left the country primarily to settle in the United States. Among the reasons for leaving were the Long Depression (1873 to 1896), the lack of farmland, and the economic lure of American factories. During this period, natural increase was the only contributor to population growth.
During the 1930s, migratory increase was slightly negative as immigration to Canada slowed, particularly because of economic and social circumstances arising from the Great Depression that began in 1929. The number of immigrants admitted to Canada declined considerably, from an average of 123,000 a year during the 1920s to fewer than 16,000 a year during the 1930s. During this decade, natural increase was also at its lowest level, and fertility fell to fewer than three children per woman, on average—a level not previously seen.
Migratory increase—the major engine of population growth since 1999
Population growth caused by natural increase began falling in the late 1960s as a result of two factors. The first was a rapid decrease in fertility in the late 1960s and 1970s, which has remained at a fairly constant level since then. By 1976, fertility had fallen to fewer than 1.8 children per woman.

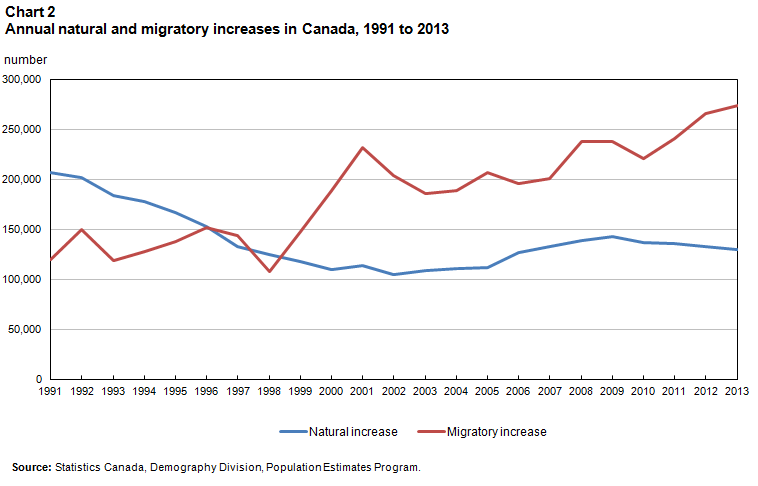
Description for Chart 2
| Natural increase | Migratory increase | |
|---|---|---|
| Table source: Statistics Canada, Demography Division, Population Estimates Program. | ||
| 1991 | 206,964 | 119,652 |
| 1992 | 202,108 | 150,017 |
| 1993 | 183,482 | 118,688 |
| 1994 | 178,037 | 128,093 |
| 1995 | 167,283 | 137,672 |
| 1996 | 153,320 | 151,359 |
| 1997 | 132,929 | 144,041 |
| 1998 | 124,327 | 107,284 |
| 1999 | 117,719 | 148,036 |
| 2000 | 109,820 | 188,749 |
| 2001 | 114,206 | 232,490 |
| 2002 | 105,199 | 203,690 |
| 2003 | 109,033 | 186,383 |
| 2004 | 110,488 | 189,336 |
| 2005 | 112,044 | 207,240 |
| 2006 | 126,538 | 195,469 |
| 2007 | 132,647 | 200,557 |
| 2008 | 139,269 | 238,255 |
| 2009 | 142,445 | 237,938 |
| 2010 | 137,138 | 221,107 |
| 2011 | 135,562 | 241,198 |
| 2012 | 132,382 | 265,920 |
| 2013 | 129,802 | 274,185 |
The second factor was a steady rise in the number of deaths, partly due to population aging. As a consequence, migratory increase has taken on an increasingly important role in recent population growth.
The late 1990s was a period of transition, with some years being characterized by higher natural increase, while in other years, migratory increase was greater.
Since 1999, however, population growth in Canada has consistently been driven mostly by the migratory increase (primarily immigration, since emigration levels are low). About two-thirds of current population growth is the result of migratory increase, while natural increase accounts for the remaining one-third.
Population growth in the future could rely even more on migratory increase
According to all scenarios used in Statistics Canada's most recent population projections, natural increase is expected to continue to decline in the future decades. This is largely the result of a projected increase in the number of deaths while the projected number of births would remain fairly constant.
Population aging will accelerate between 2011 and 2031. In 2026, the first of the baby boomers will reach the age of 80—an age typically associated with high mortality. As a result, the growth in the number of deaths will increase.
Based on the medium-growth scenario, migratory increase could account for more than 80% of Canada's population growth beginning in 2031. Without a sustained level of immigration, Canada's population growth could be close to zero within 20 years.
Definitions
Natural increase: Change in the size of a population owing to the difference between the number of births and the number of deaths during a given period.
Migratory increase: Change in the size of a population owing to the difference between the number of migrants who settle within a geographic area and the number of migrants who leave that same area during a given period.
For more information
Population Projections for Canada (2013 to 2063), Provinces and Territories (2013 to 2038), product no. 91-520-X in the Statistics Canada catalogue.
Contact information
To enquire about the concepts, methods or data quality of this release, contact Laurent Martel (613-951-2352), Demography Division.
- Date modified:
