
Economic and Social Reports
Recent developments in the Canadian economy: Spring 2024
DOI: https://doi.org/10.25318/36280001202400400004-eng
Text begins
This article provides an integrated summary of recent changes in output, consumer prices, employment, and household finances. It highlights changes in the economic data during the second half of 2023 and into the winter months of 2024. The article also examines how economic conditions have changed as borrowing costs have risen.
The report is based on data that are publicly available as of March 28, 2024. Monthly information on government, business, and financial market developments is available in Canadian Economic News. An integrated data module designed to support the analysis of current economic conditions, which includes monthly summaries for selected economic indicators, is available in the Canadian Economic Tracker. Presentations on selected topics, including recent trends related to inflation, growth, productivity and household debt, are available in A Presentation Series from Statistics Canada About the Economy, Environment and Society.
Overview
Economic activity rebounded in late 2023 as increases in exports and household spending offset lower business investment. Higher oil and gas output and crude exports supported growth in the fourth quarter, while lower production and exports of motor vehicles detracted from gains. Residential construction increased during the second half of the year after trending lower as borrowers continued to adjust to higher interest rates. Stronger retail volumes, buoyed by spending on autos, also contributed to economic growth late in the year. Employment growth slowed in late 2023 as the unmet demand for workers stabilized. Business labour productivity rose for the first time in seven quarters.
Headline consumer inflation stayed above the three percent mark during the second half of 2023 as prices for many household essentials, including food and shelter, remained elevated. Higher mortgage interest costs and rental prices put upward pressure on the headline rate. Housing affordability deteriorated while mortgage borrowing edged up slightly from low levels early in the year. The household debt service ratio was little changed during the last two quarters of 2023 as increases in disposable incomes kept pace with rising debt payments.
Authors
Guy Gellatly and Carter McCormack work with the Strategic Analysis, Publications and Training Division, Analytical Studies and Modelling Branch, Statistics Canada.
Exports and household spending bolster economic activity
Real gross domestic product (GDP) rose 0.2% in the fourth quarter of 2023 after declining 0.1% in the third (Chart 1). Increases in exports and household spending supported the headline gain, while lower business investment and a slower pace of inventory accumulation weighed on growth. For 2023 as a whole, real GDP increased 1.1% after advancing 3.8% in 2022.

Data table for Chart 1
| Q3 2023 | Q4 2023 | |
|---|---|---|
| percentage point contribution | ||
| Gross domestic product at market prices | -0.13 | 0.25 |
| Household final consumption expenditure | 0.06 | 0.13 |
| Business investment - residential structures | 0.16 | -0.03 |
| Business investment - non-residential structures | -0.22 | -0.17 |
| Business investment - machinery and equipment | -0.18 | -0.05 |
| General governments final consumption expenditure | 0.35 | -0.10 |
| Investment in inventories | -0.09 | -0.12 |
| Exports of goods | -0.11 | 0.32 |
| Imports of goods | 0.12 | 0.12 |
|
Notes: Data on gross domestic product are quarterly growth rates; all other data are percentage-point contributions to the quarterly growth rates in real GDP. Source: Statistics Canada, table 36-10-0104-01. |
||
Merchandise export volumes rose 1.2% in the fourth quarter, led by higher shipments of crude oil and crude bitumen. Shipments of forestry products and building and packaging materials also increased, while automotive exports fell for the second quarter in a row after rising sharply during the first half of the year. Service exports rose 1.9% in the fourth quarter, buoyed by higher travel volumes. For 2023 as a whole, total export volumes grew 5.7% after advancing 3.2% in 2022.
Merchandise imports contracted 0.5% in the fourth quarter, matching the decrease in the third. Lower shipments of motor vehicles and parts and energy products weighed on import volumes late in the year. Service imports also fell after advancing in each of the previous three quarters. Measured on an annual basis, total import volumes grew 1.0% in 2023 after expanding 7.6% in 2022.
Data table for Chart 2
| Household expenditure | General governments final consumption expenditure | Non-residential business investment | Exports of goods and services | Housing | |
|---|---|---|---|---|---|
| index (Q4 2019=100) | |||||
| 2019 | |||||
| Q4 | 100.0 | 100.0 | 100.0 | 100.0 | 100.0 |
| 2020 | |||||
| Q1 | 97.8 | 99.9 | 98.6 | 98.3 | 95.7 |
| Q2 | 83.8 | 96.3 | 79.7 | 82.2 | 83.0 |
| Q3 | 94.6 | 101.6 | 86.0 | 93.2 | 110.5 |
| Q4 | 95.0 | 103.0 | 88.6 | 94.3 | 114.3 |
| 2021 | |||||
| Q1 | 95.4 | 104.5 | 89.9 | 96.7 | 122.6 |
| Q2 | 95.2 | 105.3 | 96.2 | 93.1 | 120.7 |
| Q3 | 99.8 | 105.8 | 97.0 | 92.7 | 108.9 |
| Q4 | 100.4 | 106.8 | 100.5 | 95.3 | 110.2 |
| 2022 | |||||
| Q1 | 100.9 | 108.2 | 99.0 | 94.6 | 112.6 |
| Q2 | 103.1 | 108.4 | 100.7 | 97.7 | 102.7 |
| Q3 | 103.2 | 109.8 | 100.5 | 98.9 | 96.7 |
| Q4 | 103.4 | 109.4 | 98.8 | 98.8 | 94.5 |
| 2023 | |||||
| Q1 | 104.4 | 109.7 | 99.3 | 102.1 | 91.0 |
| Q2 | 104.3 | 109.8 | 102.8 | 103.2 | 90.2 |
| Q3 | 104.4 | 111.6 | 98.3 | 102.8 | 92.1 |
| Q4 | 104.6 | 111.1 | 95.9 | 104.2 | 91.7 |
| Source: Statistics Canada, table 36-10-0104-01. | |||||
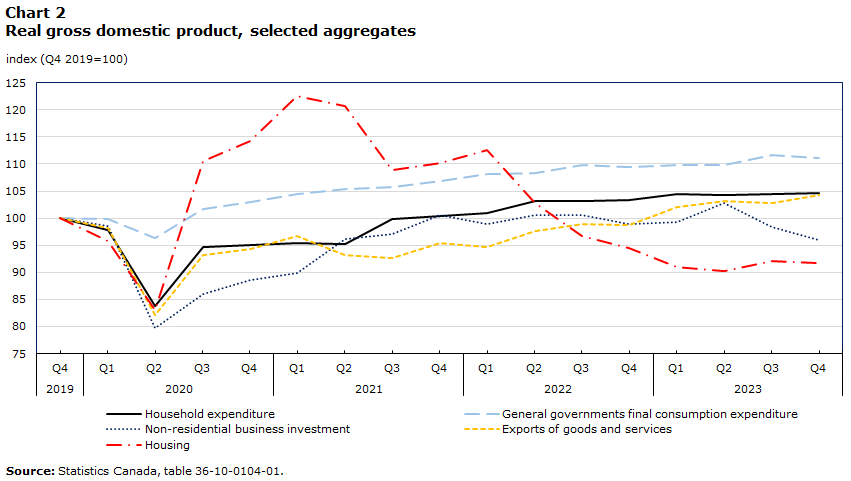
Household spending supported growth in the second half of 2023, edging higher late in the year (Chart 2). Expenditures rose 0.2% in the fourth quarter as outlays on consumer durables posted their largest increase since late 2022. Higher spending on trucks, vans and utility vehicles contributed markedly to the increase as supply chain disruptions continued to ease. Outlays on furnishings and household equipment also increased after declining for seven consecutive quarters. Spending on food declined for the first time since early in the year. For 2023 as a whole, household spending rose by 1.7% after advancing 5.1% in 2022.
Non-residential business investment weighed on growth in the second half. Combined business outlays on non-residential structures and machinery and equipment (M&E) were down 2.5% in the fourth quarter after declining 4.4% in the third. Investment in M&E fell 1.4% as spending on aircraft and other transportation equipment continued to scale back after ramping up earlier in the year. Outlays on industrial machinery and equipment were little changed (+0.1%) in the fourth after sizable declines in each of the previous two quarters, while spending on computer and communications equipment fell for the third quarter in a row. Spending on non-residential structures fell 3.0% in the fourth quarter after declining 3.8% in the third. Lower spending on engineering structures and non-residential buildings both contributed to declines in the second half. Business outlays on intellectual property products fell for the third quarter in a row as lower outlays on mineral exploration offset higher spending on research and development. For 2023 as a whole, non-residential business investment contracted 0.7% after increasing by 4.0% in 2022.
Investment in housing edged down in the fourth quarter after advancing in the third. This followed five consecutive declines from the second quarter of 2022 as borrowers adjusted to higher financing costs. New construction rose 2.2% in the fourth quarter, after advancing 6.6% in the third. Ownership transfer costs declined during the second half as resale markets weakened. Transfer costs fell 7.7% in the fourth quarter after declining 3.6% in the third. For 2023 as a whole, investment in housing fell 10.2% following a 12.1% decline in 2022.
Household income growth, measured in current dollars, eased late in the year. Household disposable income rose 1.3% in the fourth quarter after advancing 2.2% in the third. Increases in property income, which tend to benefit higher income households, bolstered income growth as wage gains moderated. The household saving rate, at 6.2%, remained over twice its benchmark before the COVID-19 pandemic.
Real GDP per capita continued to trend lower during the second half of 2023 as population growth, driven by temporary and permanent immigration, outpaced changes in economic output. Per capita growth has declined in five of the past six quarters and in late 2023 was 2.5% below its pre-pandemic benchmark. Household final consumption expenditure, measured on a per capita basis, has also decreased in five of the past six quarters. Real gross domestic income, a measure of the purchasing power of domestic production, edged up in the fourth quarter as higher production offset a decline in the terms of trade. Improvements in the terms of trade had supported income growth in the third quarter.
Business productivity edges higher after steady declines
Business labour productivity, a measure of the volume of goods and services produced per hour worked, rose 0.4% in late 2023, the first increase in seven quarters. Productivity increased in both goods- and service-producing sectors, with gains in 7 of 16 industry groups. Labour productivity in the fourth quarter remained 0.3% below its pre-pandemic baseline, while real total compensation per hour worked moderated as income growth slowed (Chart 3).Note Nominal unit labour costs, which measure the payments to labour required to produce a unit of output, edged down in late 2023 after rising steadily for twelve consecutive quarters. Unit labour costs in late 2023 were 23.3% above pre-pandemic levels.

Data table for Chart 3
| Labour productivity | Real total compensation per hour worked | |
|---|---|---|
| index (Q1 2018=100) | ||
| 2018 | ||
| Q1 | 100.0 | 100.0 |
| Q2 | 100.6 | 99.2 |
| Q3 | 100.1 | 98.8 |
| Q4 | 99.9 | 101.6 |
| 2019 | ||
| Q1 | 100.4 | 101.4 |
| Q2 | 100.4 | 100.6 |
| Q3 | 100.4 | 101.6 |
| Q4 | 100.9 | 102.2 |
| 2020 | ||
| Q1 | 106.0 | 109.0 |
| Q2 | 119.7 | 130.6 |
| Q3 | 107.7 | 111.6 |
| Q4 | 105.6 | 108.0 |
| 2021 | ||
| Q1 | 104.5 | 104.0 |
| Q2 | 103.2 | 102.8 |
| Q3 | 102.4 | 102.6 |
| Q4 | 101.7 | 100.1 |
| 2022 | ||
| Q1 | 102.7 | 101.5 |
| Q2 | 102.7 | 99.3 |
| Q3 | 102.6 | 100.7 |
| Q4 | 101.6 | 101.6 |
| 2023 | ||
| Q1 | 100.9 | 103.6 |
| Q2 | 100.7 | 105.0 |
| Q3 | 100.1 | 104.0 |
| Q4 | 100.6 | 103.4 |
| Source: Statistics Canada, table 36-10-0206-01. | ||
Measured on an annual basis, labour productivity fell 1.8% in 2023, the third consecutive annual decrease. Hours worked rose 2.5% while business sector GDP rose 0.6%. Lower productivity in 2023 largely reflected declines in the goods sector.
Productivity growth in Canada and the United States have diverged markedly in recent decades. Two recent studies examined the extent to which differences in competitive intensity may be contributing to weaker productivity performance in Canada. Gu (2024) found that lower firm entry rates have contributed substantially to declines in investment per worker, which fell by 20% from 2006 to 2021. Gu and Willox (2023) showed that higher levels of market power in information and cultural services industries in Canada, an industry group that includes telecommunications, have contributed significantly to the productivity gap between the two countries.
Output expands as oil and gas extraction ramps up
After edging down in the third quarter of 2023, economy-wide output rebounded in the fourth, supported by increases in oil and gas extraction following maintenance and turnarounds in the summer and early fall. Higher retail volumes also contributed to growth late in the year, while declines in educational services, which reflected public sector strike action in Quebec, weighed on gains. Measured on a year-over-year basis, economy-wide output rose 1.0% in December, rebounding to the one percent mark for the first time since mid-year. Output in service industries expanded 1.6% over this twelve-month period while production in the goods sector fell 0.6%.

Data table for Chart 4
| Oil and gas extraction | Residential building construction | Motor vehicles and parts manufacturing | Retail trade | |
|---|---|---|---|---|
| index (January 2021=100) | ||||
| 2021 | ||||
| January | 100.0 | 100.0 | 100.0 | 100.0 |
| February | 97.8 | 103.0 | 90.3 | 106.2 |
| March | 96.8 | 106.8 | 92.6 | 109.1 |
| April | 95.5 | 111.6 | 74.1 | 102.7 |
| May | 97.6 | 106.3 | 82.0 | 99.1 |
| June | 98.7 | 102.9 | 83.6 | 104.2 |
| July | 99.8 | 99.7 | 80.6 | 104.2 |
| August | 101.2 | 98.2 | 79.1 | 106.4 |
| September | 103.4 | 96.4 | 69.7 | 105.8 |
| October | 104.2 | 96.9 | 82.3 | 106.7 |
| November | 102.0 | 96.7 | 87.6 | 107.2 |
| December | 101.5 | 95.0 | 88.1 | 104.4 |
| 2022 | ||||
| January | 100.4 | 97.9 | 85.5 | 105.5 |
| February | 101.0 | 99.0 | 90.3 | 105.9 |
| March | 102.6 | 100.2 | 96.1 | 107.5 |
| April | 105.4 | 98.9 | 94.0 | 106.4 |
| May | 104.4 | 97.7 | 94.4 | 107.1 |
| June | 103.9 | 97.6 | 90.7 | 106.4 |
| July | 105.6 | 96.6 | 94.8 | 106.2 |
| August | 104.2 | 96.3 | 93.8 | 106.8 |
| September | 106.0 | 93.7 | 92.8 | 106.5 |
| October | 104.3 | 94.2 | 89.9 | 105.9 |
| November | 104.3 | 93.4 | 96.0 | 105.0 |
| December | 102.1 | 90.6 | 99.9 | 105.9 |
| 2023 | ||||
| January | 102.9 | 89.8 | 107.4 | 107.0 |
| February | 104.3 | 88.7 | 107.0 | 107.2 |
| March | 104.9 | 87.7 | 106.3 | 106.6 |
| April | 105.6 | 85.6 | 110.5 | 107.4 |
| May | 101.5 | 83.3 | 116.6 | 107.9 |
| June | 104.6 | 82.9 | 116.3 | 107.5 |
| July | 106.3 | 84.9 | 117.2 | 107.5 |
| August | 106.6 | 87.3 | 115.8 | 107.3 |
| September | 104.3 | 88.8 | 113.0 | 107.5 |
| October | 105.8 | 89.1 | 109.8 | 108.4 |
| November | 107.4 | 88.4 | 111.1 | 108.5 |
| December | 110.2 | 87.0 | 104.8 | 109.2 |
| 2024 | ||||
| January | 105.4 | 85.6 | 108.4 | 109.3 |
| Source: Statistics Canada, table 36-10-0434-01. | ||||
Oil and gas extraction expanded during the second half, buoyed late in the year by higher production in the oil sands. Oil sands output in December was up 6.2% from levels at mid-year and 11.3% from levels at the end of 2022 (Chart 4). Oil and gas production, excluding the oil sands, also rose in the second half, strengthening toward year-end. Mining and quarrying also increased in late 2023 on broad-based increases in mining activity.
Construction output edged lower during the second half of 2023. Engineering construction posted its seventh consecutive decline in December, while non-residential building construction rose for the third time in four months. After advancing from July to October, residential building construction declined late in the year, and in December was 22% below peak levels reported in the spring of 2021. Annualized housing starts averaged 244,000 in the fourth quarter, down from 256,000 in the third.
Activity at real estate agents and brokers edged down steadily during the second half of the year before rising 8.6% in December. At year end, activity at agents and brokers was about one-third below levels reported in early 2022 before interest rates began to rise. Legal services, which derive much of their activity from real estate transactions, rose in December for the first time since June.
Manufacturing volumes declined in the second half as lower auto production, which reflected retooling at multiple assembly plants, weighed on factory output late in the year. Total manufacturing volumes in December were 2.3% below their recent peak in May.
After edging lower at mid-year, retail volumes advanced steadily from September to December, buoyed by higher activity at motor vehicle and parts dealers. New motor vehicle sales, measured year-over-year, rose 16.8% in December, their fifth consecutive month in double-digit territory. Total retail activity was 1.6% higher in December than in June. Stronger retail volumes in the fourth quarter contributed substantially to higher output and productivity growth in service industries.
Accommodation and food services also picked up in the second half of 2023 after trending lower in the first. Activity in December was up 3.0% from levels in June after four consecutive gains to end the year. Higher travel volumes bolstered accommodation services as air transportation ramped up in the second half. Receipts at full-service and limited-service restaurants rose steadily from September to December.
Real GDP rose 0.6% in January 2024, the largest increase in twelve months. The resolution of public sector strike action in Quebec contributed substantially to the headline gain, while manufacturing volumes expanded as production resumed at some auto assembly plants after several months of retooling. Lower oil and gas output weighed on gains to start the year. Statistics Canada’s advance estimate of real GDP pointed to a 0.4% increase in February.
Headline inflation eases while affordability challenges remain
After accelerating during the summer months, headline consumer inflation slowed to 3.1% in October and November before rising to 3.4% at the end of 2023. As of December, the all-items rate had been above the three percent mark for thirty-two of the previous thirty-three months. Lower gasoline prices contributed to the slower pace of inflation during the fall months while higher mortgage interest costs and rental prices continued to put upward pressure on the headline rate. Food inflation eased during the second half as base-year effects weighed on the pace of price growth (Chart 5).
Consumer inflation edged below the three percent mark in early 2024, slowing to 2.9% in January and then to 2.8% in February. Lower prices for gasoline contributed to the deceleration in January while lower prices for cellular and internet services put downward pressure on the headline rate in February.

Data table for Chart 5
| All-items | Food | Shelter | |
|---|---|---|---|
| year-over-year percentage change | |||
| 2019 | |||
| January | 1.4 | 2.8 | 2.4 |
| February | 1.5 | 3.2 | 2.4 |
| March | 1.9 | 3.6 | 2.7 |
| April | 2.0 | 2.9 | 2.7 |
| May | 2.4 | 3.5 | 2.7 |
| June | 2.0 | 3.5 | 2.5 |
| July | 2.0 | 3.8 | 2.3 |
| August | 1.9 | 3.6 | 2.4 |
| September | 1.9 | 3.7 | 2.3 |
| October | 1.9 | 3.7 | 2.6 |
| November | 2.2 | 3.4 | 2.5 |
| December | 2.2 | 3.0 | 2.8 |
| 2020 | |||
| January | 2.4 | 3.2 | 2.4 |
| February | 2.2 | 2.4 | 2.3 |
| March | 0.9 | 2.3 | 1.9 |
| April | -0.2 | 3.4 | 1.3 |
| May | -0.4 | 3.1 | 1.0 |
| June | 0.7 | 2.7 | 1.7 |
| July | 0.1 | 2.2 | 1.5 |
| August | 0.1 | 1.8 | 1.5 |
| September | 0.5 | 1.6 | 1.7 |
| October | 0.7 | 2.3 | 1.8 |
| November | 1.0 | 1.9 | 1.9 |
| December | 0.7 | 1.1 | 1.6 |
| 2021 | |||
| January | 1.0 | 1.0 | 1.4 |
| February | 1.1 | 1.8 | 1.4 |
| March | 2.2 | 1.8 | 2.4 |
| April | 3.4 | 0.9 | 3.2 |
| May | 3.6 | 1.5 | 4.2 |
| June | 3.1 | 1.3 | 4.4 |
| July | 3.7 | 1.7 | 4.8 |
| August | 4.1 | 2.7 | 4.8 |
| September | 4.4 | 3.9 | 4.8 |
| October | 4.7 | 3.8 | 4.8 |
| November | 4.7 | 4.4 | 4.8 |
| December | 4.8 | 5.2 | 5.4 |
| 2022 | |||
| January | 5.1 | 5.7 | 6.2 |
| February | 5.7 | 6.7 | 6.6 |
| March | 6.7 | 7.7 | 6.8 |
| April | 6.8 | 8.8 | 7.4 |
| May | 7.7 | 8.8 | 7.4 |
| June | 8.1 | 8.8 | 7.1 |
| July | 7.6 | 9.2 | 7.0 |
| August | 7.0 | 9.8 | 6.6 |
| September | 6.9 | 10.3 | 6.8 |
| October | 6.9 | 10.1 | 6.9 |
| November | 6.8 | 10.3 | 7.2 |
| December | 6.3 | 10.1 | 7.0 |
| 2023 | |||
| January | 5.9 | 10.4 | 6.6 |
| February | 5.2 | 9.7 | 6.1 |
| March | 4.3 | 8.9 | 5.4 |
| April | 4.4 | 8.3 | 4.9 |
| May | 3.4 | 8.3 | 4.7 |
| June | 2.8 | 8.3 | 4.8 |
| July | 3.3 | 7.8 | 5.1 |
| August | 4.0 | 6.8 | 6.0 |
| September | 3.8 | 5.9 | 6.0 |
| October | 3.1 | 5.6 | 6.1 |
| November | 3.1 | 5.0 | 5.9 |
| December | 3.4 | 5.0 | 6.0 |
| 2024 | |||
| January | 2.9 | 3.9 | 6.2 |
| February | 2.8 | 3.3 | 6.5 |
| Source: Statistics Canada, table 18-10-0004-01. | |||
Food price inflation eased substantially in early 2024. February marked the first time since October 2021 that grocery prices, measured year-over-year, have risen at a slower pace than the headline rate. Grocery prices rose 2.4% in the twelve months to February, down from 3.4% in January. Meat prices were 2.6% higher than in February 2023, while prices for fresh vegetables rose 3.4%. Fresh fruit prices fell 2.6% year-over-year, while prices for pasta products were little changed (-0.1%). Yearly price increases at restaurants held steady at 5.1%, their fifth consecutive month under the six percent mark.
Shelter inflation continued to accelerate in early 2024. Shelter costs, measured year-over-year, rose 6.2% in January before accelerating to 6.5% in February. Mortgage interest costs were up 26.3% year-over-year in February as homeowners continue to adjust to the higher interest rate environment. Annual price growth for rented accommodation, which reflects both new and existing rental contracts, edged up to 7.9%. In contrast, yearly price changes for homeowners' replacement costs, which partly reflect new housing prices, remained in negative territory for the tenth consecutive month.
While inflationary pressures have eased, the prices for many goods and services remain elevated. Grocery prices have risen 22.3% since inflationary pressures began ramping up in early 2021, while shelter costs have increased 20.8%. While goods inflation has slowed markedly, averaging 1.6% over the past five months, prices for goods are 15.9% higher than in early 2021. Cumulative price increases for services stand at 14.0%, with annual price growth above the four percent mark in early 2024.
Producer prices trended slightly lower over the past year as lower energy prices tempered price growth. Industrial product prices, which measure the prices that manufacturers receive as goods leave the factory gate, were down 2.8% on a year-over-year basis in December 2023, their third consecutive decrease. Excluding energy and petroleum products, factory gate prices edged down 1.2% in the twelve months to December. Producer prices continued to decline on a year-over-year basis in early 2024.
Businesses have adjusted their pricing expectations as inflationary pressures continue to ease. The percentage of businesses that intend to raise selling prices for their products or services trended lower during 2023. In the second quarter, almost three in ten businesses (28.3%) planned to increase prices during the next three months; by the fourth quarter, less than one in four businesses (23.6%) anticipated doing so.
Employment growth slows as unemployment edges higher
Employment growth eased during the second half of 2023. Monthly employment gains averaged 25,000 from July to December, down from 44,000 during the first six months of the year.Note Gains among private sector employees slowed markedly during the second half while increases in full-time work also moderated (Chart 6). Employment fell in wholesale and retail trade after advancing during the first half, while employment in construction was little changed in both periods. Employment rose in professional, scientific, and technical services during the second half and continued to edge higher in health care and social assistance.Note

Data table for Chart 6
| Public sector employees | Private sector employees | Self-employed | |
|---|---|---|---|
| number of persons | |||
| 2022 | |||
| March | 8,700 | 37,000 | -21,300 |
| April | -5,200 | 69,600 | -11,300 |
| May | 60,100 | -53,400 | 36,900 |
| June | -2,400 | -11,200 | -17,900 |
| July | -12,300 | 41,600 | 5,700 |
| August | -7,400 | 9,100 | -13,100 |
| September | 24,800 | -1,400 | -24,100 |
| October | 4,900 | 66,900 | 9,100 |
| November | -4,600 | 2,800 | 30,000 |
| December | -25,800 | 91,700 | 4,500 |
| 2023 | |||
| January | 25,800 | 85,500 | -1,800 |
| February | -4,100 | 33,700 | -11,500 |
| March | 7,100 | 33,400 | 800 |
| April | 19,600 | 1,500 | 17,100 |
| May | -900 | 41,100 | -39,100 |
| June | 4,100 | 66,000 | -12,700 |
| July | 18,900 | -21,800 | -2,100 |
| August | 14,500 | -8,000 | 44,600 |
| September | 30,100 | 400 | 20,300 |
| October | 20,500 | 5,600 | -2,200 |
| November | 8,200 | 41,300 | -25,100 |
| December | 8,800 | 9,000 | -11,100 |
| 2024 | |||
| January | 47,600 | 7,400 | -17,700 |
| February | 18,800 | -16,400 | 38,300 |
| Source: Statistics Canada, table 14-10-0288-01. | |||
Unemployment continued to trend higher in the second half of 2023. The unemployment rate rose from 5.4% at mid-year to 5.8% in November and December. There were 1,244,000 unemployed persons at year-end, an increase of 203,000 or 19.5%, from December 2022.
Employment edged higher in early 2024. Cumulative gains in January and February totalled 78,000, reflecting increases among core-age workers. Gains were concentrated among public sector employees as the number of private sector employees was little changed. All of the net growth during the first two months of the year was in service industries. After edging down in January, the unemployment rate increased to 5.8% in February.
Population growth outpaces employment growth
The employment rate—the percentage of working-age people who are employed—trended lower over the past year as the working-age population expanded at a robust pace (Chart 7). The rate declined from 62.4% in early 2023 to 61.7% in December and continued to edge lower in early 2024. The employment rate fell for the fifth consecutive month to 61.5% in February, the longest period of consecutive declines since the six-month period ending in April 2009. In the twelve months to February, total employment has risen by 368,000 while the working-age population has expanded by over one million.

Data table for Chart 7
| Working age population | Labour force | Employment | |
|---|---|---|---|
| thousands of persons | |||
| January and February 2024 | 104.4 | 47.3 | 39.0 |
| 2023 | 78.8 | 51.7 | 34.8 |
| 2022 | 41.4 | 18.6 | 34.5 |
| Source: Statistics Canada, table 14-10-0287-01. | |||
Unmet demand for workers holds steady
After trending lower from January to September 2023, the number of job vacancies has stabilized in recent months, totalling 638,000 in December (Chart 8). At year end, vacancies were down 36% from the peak of just over one million in the spring of 2022. The unemployment-to-job vacancy ratio edged up to 2.0 in December after holding steady at 1.9 for three consecutive months. December’s ratio was twice that observed when the labour market was experiencing historic levels of tightness in mid-2022. The job vacancy rate was 3.6% in December, slightly above its pre-pandemic peak in early 2020.

Data table for Chart 8
| Unemployment-to-job vacancy ratio (LHS) | Job vacancies (RHS) | |
|---|---|---|
| ratio | number of job vacancies | |
| 2022 | ||
| January | 1.46 | 921,985 |
| February | 1.24 | 917,295 |
| March | 1.13 | 990,210 |
| April | 1.12 | 992,945 |
| May | 1.08 | 1,003,395 |
| June | 1.05 | 989,075 |
| July | 1.03 | 978,515 |
| August | 1.18 | 924,320 |
| September | 1.15 | 932,330 |
| October | 1.21 | 888,320 |
| November | 1.23 | 866,680 |
| December | 1.22 | 854,295 |
| 2023 | ||
| January | 1.23 | 858,820 |
| February | 1.29 | 835,050 |
| March | 1.34 | 803,465 |
| April | 1.36 | 798,815 |
| May | 1.44 | 776,765 |
| June | 1.57 | 744,510 |
| July | 1.64 | 717,860 |
| August | 1.73 | 689,735 |
| September | 1.87 | 642,870 |
| October | 1.86 | 666,525 |
| November | 1.87 | 666,915 |
| December | 1.96 | 637,985 |
| 2024 | ||
| January | 1.95 | 632,105 |
|
Notes: RHS refers to right hand scale and LHS refers to left hand scale. Sources: Statistics Canada, tables 14-10-0287-01 and 14-10-0432-01. |
||
Measured on a quarterly basis, vacancies continued to pull back in late 2023, led by declines in sales and service occupations. Vacancies in health-related occupations held steady, reflecting elevated demand for registered nurses, nurse aides and orderlies, and licensed practical nurses. Average offered hourly wages for vacant positions, measured year-over-year, rose 6.4% in the fourth quarter, up from 5.8% in the third. Vacancies for positions requiring a high school diploma or less have decreased by over 30% since late 2022 but continue to account for the majority of all unfilled positions.Note
Household wealth buoyed by stronger financial markets
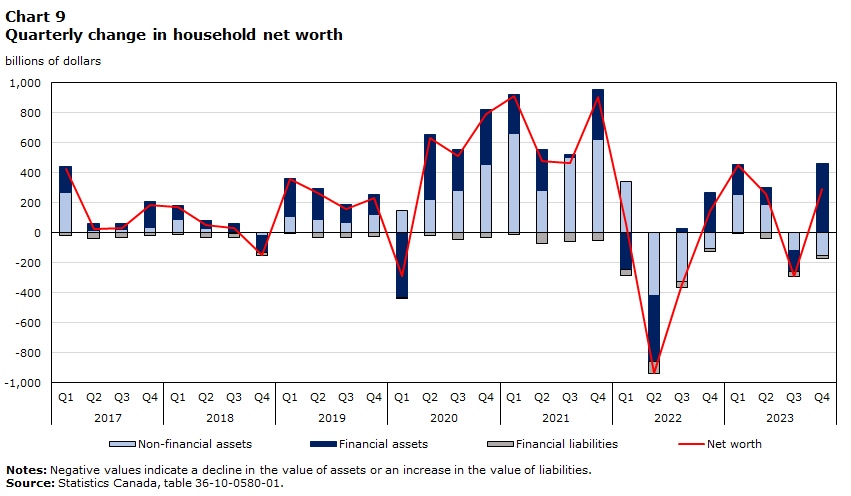
After declining in the third quarter of 2023, household net worth rose $289.8 billion in the fourth as increases in the value of equities and bonds offset continued declines in housing (Chart 9). Household net worth, at $16.4 trillion, was 32.8% above pre-pandemic levels at the end of 2023. Almost two thirds of the net increase in the value of household assets over this four-year period reflected gains in non-financial assets, reflecting increases in real estate.
Data table for Chart 9
| Net worth | Non-financial assets | Financial assets | Financial liabilities | |
|---|---|---|---|---|
| billions of dollars | ||||
| 2017 | ||||
| Q1 | 425.4 | 268.4 | 176.8 | -19.8 |
| Q2 | 26.7 | 14.3 | 50.2 | -37.8 |
| Q3 | 34.9 | 20.7 | 44.3 | -30.1 |
| Q4 | 187.6 | 38.5 | 169.4 | -20.3 |
| 2018 | ||||
| Q1 | 172.8 | 86.0 | 97.0 | -10.3 |
| Q2 | 51.0 | 25.9 | 53.2 | -28.1 |
| Q3 | 31.2 | -7.7 | 65.1 | -26.2 |
| Q4 | -148.3 | -18.3 | -110.8 | -19.2 |
| 2019 | ||||
| Q1 | 356.9 | 105.5 | 255.2 | -3.9 |
| Q2 | 262.8 | 89.1 | 207.6 | -33.8 |
| Q3 | 159.6 | 67.0 | 124.3 | -31.8 |
| Q4 | 229.8 | 123.9 | 128.6 | -22.6 |
| 2020 | ||||
| Q1 | -286.5 | 150.4 | -431.4 | -5.6 |
| Q2 | 635.1 | 219.2 | 433.7 | -17.7 |
| Q3 | 513.7 | 281.6 | 274.5 | -42.4 |
| Q4 | 791.9 | 458.0 | 365.0 | -31.2 |
| 2021 | ||||
| Q1 | 913.1 | 662.3 | 264.2 | -13.4 |
| Q2 | 482.5 | 283.9 | 269.1 | -70.5 |
| Q3 | 465.5 | 503.1 | 18.2 | -55.8 |
| Q4 | 906.2 | 624.6 | 330.2 | -48.7 |
| 2022 | ||||
| Q1 | 56.3 | 340.5 | -247.2 | -37.0 |
| Q2 | -935.8 | -421.3 | -440.6 | -73.8 |
| Q3 | -339.2 | -321.8 | 27.6 | -44.9 |
| Q4 | 142.6 | -104.9 | 266.8 | -19.3 |
| 2023 | ||||
| Q1 | 451.1 | 253.7 | 200.8 | -3.4 |
| Q2 | 261.1 | 189.7 | 111.0 | -39.7 |
| Q3 | -289.3 | -116.5 | -139.4 | -33.5 |
| Q4 | 289.8 | -152.6 | 464.2 | -21.9 |
|
Notes: Negative values indicate a decline in the value of assets or an increase in the value of liabilities. Source: Statistics Canada, table 36-10-0580-01. |
||||
Household mortgage and non-mortgage borrowing edged higher in the second half, increasing to $29.5 billion in the fourth quarter. Credit market borrowing in late 2023 was 46.4% below levels observed in early 2022 when interest rates began to rise. The ratio of household credit market debt to disposable income continued to edge lower in the second half, declining from 179.2% in the third quarter to 178.7% in the fourth. The household debt service ratio was 15.0% in late 2023, similar to levels in each of the preceding two quarters.Note Over the course of 2023, households accumulated $116.4 billion of currency and deposits, more than $50 billion more than the average annual accumulation observed in the decade before the pandemic.
References
Gu, W. 2024. Investment slowdown in Canada after the mid-2000s: The role of Competition and Intangibles. Economic and Social Reports. Catalogue no. 36-28-0001. Ottawa: Statistics Canada. DOI: https://doi.org/10.25318/11f0019m2024001-eng.
Gu, W. and M. Willox. 2023. The post-2001 productivity growth divergence between Canada and the United States: The role of the information and cultural services industry. Economic and Social Reports. Catalogue no. 36-28-0001. Ottawa: Statistics Canada. DOI: https://doi.org/10.25318/36280001202301200006-eng.
Leung, D. and R. Macdonald. 2022. Real wages and productivity during the COVID-19 pandemic. Economic and Social Reports. Catalogue no. 36-28-0001. Ottawa: Statistics Canada. DOI: https://doi.org/10.25318/36280001202201000002-eng.
Statistics Canada. 2024. Research to Insights: Disparities in Wealth and Debt Among Canadian Households. Catalogue 11-631-X. Ottawa: Statistics Canada. Released February 28, 2024. https://www150.statcan.gc.ca/n1/pub/11-631-x/11-631-x2024002-eng.htm.
Statistics Canada. 2023. Research to Insights: Perspectives on Growth, Inflation and Affordability. Catalogue 11-631-X. Ottawa: Statistics Canada. Released November 16, 2023. https://www150.statcan.gc.ca/n1/pub/11-631-x/11-631-x2023007-eng.htm.
- Date modified: