Research to Insights: Disparities in Wealth and Debt Among Canadian Households
Skip to text
Text begins
About Research to Insights
The Research to Insights series of presentations features a broad range of findings on selected research topics. Each presentation draws from and integrates evidence from various studies that use innovative and high-quality data and methods to better understand relevant and complex policy issues.
Based on applied research of valuable data, the series is intended to provide decision makers, and Canadians more broadly, a comprehensive and horizontal view of the current economic, social and health issues we face in a changing world.
Context
- Canada’s reliance on consumer spending as a key source of economic growth has contributed to greater debt burdens, with the highest household debt in the G7.
- Likewise, housing has been a double-edged sword—critical for wealth creation for middle-class households, but also leading to imbalances between assets and debt.
- Lessons learned from the 2007/2008 global financial crisis underscored the importance of evaluating indebtedness for households across income distributions, as aggregate data can obscure major vulnerabilities.
- Recent disaggregated data from Statistics Canada’s macroeconomic accounts demonstrate the extent to which household saving and wealth creation following the COVID-19 pandemic have been concentrated among the richest households.
- The current higher interest rate environment has implications for younger households with larger mortgages to pay off, as risks to socioeconomic mobility emerge with barriers to homeownership.
Household spending has been key to economic growth in Canada since the global financial crisis, contributing to elevated debt burdens
- Outside the pandemic, household spending has been the main contributor to economic growth since 2015, more recently supported by residential investment in 2021.
- Business investment (non-residential structures, and machinery and equipment) has not made an important contribution to growth in the last decade.
- Major implications in the current interest rate environment include reduced incentives for business investment and increased household spending on debt servicing.

Data table for Chart 1
| 2015 | 2016 | 2017 | 2018 | 2019 | 2020 | 2021 | 2022 | |
|---|---|---|---|---|---|---|---|---|
| percent | ||||||||
| Less: imports of goods and services | -0.25 | -0.073 | -1.553 | -1.005 | -0.195 | 3.208 | -2.328 | -2.327 |
| Exports of goods and services | 1.088 | 0.476 | 0.46 | 1.194 | 0.889 | -2.813 | 0.352 | 0.872 |
| Investment in inventories | -0.465 | -0.041 | 0.912 | -0.135 | -0.146 | -1.709 | 0.969 | 2.152 |
| General governments gross fixed capital formation | 0.063 | -0.007 | 0.246 | 0.103 | -0.117 | 0.206 | 0.038 | 0.075 |
| Non-profit institutions serving households' gross fixed capital formation | -0.015 | -0.039 | 0.003 | 0 | -0.011 | 0.002 | 0.008 | -0.004 |
| Intellectual property products | -0.234 | -0.032 | 0.156 | 0.228 | 0.075 | -0.047 | 0.084 | 0.011 |
| Non-residential structures, machinery and equipment | -1.363 | -1.32 | 0.175 | 0.317 | 0.304 | -1.078 | 0.357 | 0.647 |
| Residential structures | 0.265 | 0.295 | 0.181 | -0.089 | -0.05 | 0.369 | 1.31 | -1.097 |
| Final consumption expenditure | 1.586 | 1.635 | 2.564 | 2.122 | 1.137 | -3.192 | 4.229 | 2.998 |
| Source: Statistics Canada, table 36-10-0128-01. | ||||||||
Canada’s economic reliance on consumer spending and housing means higher levels of wealth and debt compared with G7 counterparts

Data table for Chart 2
| 2021 | |
|---|---|
| percentage of net disposable income | |
| United States | 708.36 |
| Canada | 677.87 |
| Japan | 649.81 |
| Italy | 645.97 |
| France | 612.23 |
| Germany | 553.53 |
| United Kingdom | 501.75 |
| Source: Organisation for Economic Co-operation and Development. | |

Data table for Chart 3
| 2021 | |
|---|---|
| percentage of net disposable income | |
| Canada | 185.19 |
| United Kingdom | 150.61 |
| France | 127.55 |
| Japan | 122.06 |
| United States | 101.84 |
| Germany | 101.33 |
| Italy | 89.88 |
| Source: Organisation for Economic Co-operation and Development. | |
Housing as a double-edged sword: Based on the latest data across G7 countries, Canada has the highest level of household debt to disposable income, reaching over 180%, compared with about 100% in the United States and Germany. At the same time, housing contributes to greater debt and wealth, as Canada closely tracks the United States in wealth per disposable income.
Household disposable income has grown at a healthy pace since the pandemic, while saving remains elevated
- Household saving during the first two years of the pandemic was equivalent to cumulative saving from 2010 to 2019.
- Canadians saved more at the height of the pandemic, as COVID-19 emergency supports offset income losses from public health shutdowns, while shifting consumer behaviours also contributed to greater saving.
- More recently, the pace of savings continued to accelerate, mainly for the richest households, while lower-income households are spending more than they earn to withstand current affordability pressures.

Data table for Chart 4
| Household disposable income | Household saving rate | |
|---|---|---|
| index (Q1 2018 = 100) | percent | |
| 2018 | ||
| Q1 | 100.00 | 1.4 |
| Q2 | 100.06 | 0.1 |
| Q3 | 100.60 | -0.1 |
| Q4 | 102.37 | 1.1 |
| 2019 | ||
| Q1 | 102.92 | 1 |
| Q2 | 104.86 | 2.1 |
| Q3 | 105.89 | 2.5 |
| Q4 | 107.60 | 2.8 |
| 2020 | ||
| Q1 | 108.89 | 5.3 |
| Q2 | 119.45 | 26.5 |
| Q3 | 114.65 | 13.6 |
| Q4 | 113.59 | 11.4 |
| 2021 | ||
| Q1 | 118.14 | 14.3 |
| Q2 | 117.67 | 13.2 |
| Q3 | 118.78 | 8.8 |
| Q4 | 117.68 | 5.6 |
| 2022 | ||
| Q1 | 122.27 | 7.5 |
| Q2 | 123.41 | 4.1 |
| Q3 | 124.65 | 4.2 |
| Q4 | 127.91 | 5.6 |
| 2023 | ||
| Q1 | 128.59 | 4.4 |
| Q2 | 129.60 | 4.7 |
| Q3 | 130.90 | 5.1 |
| Source: Statistics Canada, table 36-10-0112-01. | ||
Slower household borrowing and stronger incomes have levelled off the household debt service ratio
- The household debt service ratio edged above 15% in the third quarter of 2023 on higher borrowing and slower income growth.
- At the same time, debt servicing is increasingly focused on interest payments, as opposed to paying down principals.
- The number of residential mortgages lasting more than 30 years has grown substantially since the end of 2021, as more borrowers face renewal pressure and reset their original amortization schedule.

Data table for Chart 5
| Household debt service | Mortgage debt service | Non-mortgage loan debt service | |
|---|---|---|---|
| percent | |||
| 2019 | |||
| Q2 | 15.0 | 7.1 | 7.9 |
| Q3 | 15.0 | 7.2 | 7.9 |
| Q4 | 14.9 | 7.1 | 7.8 |
| 2020 | |||
| Q1 | 14.6 | 7.0 | 7.6 |
| Q2 | 12.6 | 6.1 | 6.4 |
| Q3 | 13.5 | 6.7 | 6.8 |
| Q4 | 13.9 | 6.9 | 6.9 |
| 2021 | |||
| Q1 | 13.5 | 6.8 | 6.7 |
| Q2 | 13.7 | 7.0 | 6.7 |
| Q3 | 13.6 | 7.0 | 6.6 |
| Q4 | 13.8 | 7.1 | 6.7 |
| 2022 | |||
| Q1 | 13.6 | 7.0 | 6.6 |
| Q2 | 13.9 | 7.2 | 6.7 |
| Q3 | 14.3 | 7.5 | 6.8 |
| Q4 | 14.5 | 7.7 | 6.8 |
| 2023 | |||
| Q1 | 14.9 | 8.0 | 6.8 |
| Q2 | 15.1 | 8.2 | 6.9 |
| Q3 | 15.2 | 8.3 | 6.9 |
| Source: Statistics Canada, table 11-10-0065-01. | |||

Data table for Chart 6
| Total principal payment | Total interest paid | |
|---|---|---|
| millions of dollars | ||
| 2005 | ||
| Q3 | 45,000 | 59,112 |
| Q4 | 48,408 | 59,048 |
| 2016 | ||
| Q1 | 47,068 | 63,740 |
| Q2 | 47,872 | 67,196 |
| Q3 | 48,500 | 70,404 |
| Q4 | 49,236 | 72,720 |
| 2007 | ||
| Q1 | 50,948 | 74,536 |
| Q2 | 51,504 | 77,560 |
| Q3 | 53,276 | 79,796 |
| Q4 | 54,040 | 82,652 |
| 2008 | ||
| Q1 | 54,260 | 83,084 |
| Q2 | 54,996 | 82,820 |
| Q3 | 56,072 | 82,676 |
| Q4 | 57,740 | 79,092 |
| 2009 | ||
| Q1 | 58,684 | 75,316 |
| Q2 | 61,204 | 72,208 |
| Q3 | 61,672 | 71,920 |
| Q4 | 63,076 | 71,640 |
| 2010 | ||
| Q1 | 65,168 | 72,184 |
| Q2 | 65,660 | 73,588 |
| Q3 | 67,824 | 73,276 |
| Q4 | 68,576 | 74,460 |
| 2011 | ||
| Q1 | 68,272 | 76,288 |
| Q2 | 71,028 | 74,740 |
| Q3 | 71,508 | 75,100 |
| Q4 | 72,888 | 75,272 |
| 2012 | ||
| Q1 | 73,404 | 74,804 |
| Q2 | 74,236 | 75,632 |
| Q3 | 75,416 | 75,752 |
| Q4 | 77,048 | 74,904 |
| 2013 | ||
| Q1 | 77,300 | 75,880 |
| Q2 | 78,412 | 76,156 |
| Q3 | 78,964 | 77,104 |
| Q4 | 80,260 | 77,100 |
| 2014 | ||
| Q1 | 81,440 | 76,988 |
| Q2 | 82,868 | 76,972 |
| Q3 | 84,948 | 77,516 |
| Q4 | 87,104 | 78,252 |
| 2015 | ||
| Q1 | 89,072 | 78,208 |
| Q2 | 90,756 | 76,780 |
| Q3 | 90,396 | 77,248 |
| Q4 | 90,508 | 77,076 |
| 2016 | ||
| Q1 | 90,712 | 77,260 |
| Q2 | 91,992 | 78,916 |
| Q3 | 93,840 | 78,228 |
| Q4 | 94,768 | 79,048 |
| 2017 | ||
| Q1 | 96,600 | 79,960 |
| Q2 | 98,812 | 81,108 |
| Q3 | 100,288 | 82,732 |
| Q4 | 101,016 | 85,600 |
| 2018 | ||
| Q1 | 101,928 | 88,508 |
| Q2 | 102,296 | 91,416 |
| Q3 | 102,084 | 94,464 |
| Q4 | 102,024 | 97,676 |
| 2019 | ||
| Q1 | 102,260 | 101,012 |
| Q2 | 104,616 | 101,892 |
| Q3 | 104,900 | 103,980 |
| Q4 | 106,324 | 104,000 |
| 2020 | ||
| Q1 | 105,024 | 102,960 |
| Q2 | 97,300 | 97,284 |
| Q3 | 105,712 | 94,476 |
| Q4 | 111,632 | 92,916 |
| 2021 | ||
| Q1 | 114,500 | 91,872 |
| Q2 | 115,200 | 93,104 |
| Q3 | 117,876 | 90,680 |
| Q4 | 118,888 | 90,888 |
| 2022 | ||
| Q1 | 121,448 | 92,532 |
| Q2 | 120,384 | 102,040 |
| Q3 | 116,052 | 116,860 |
| Q4 | 111,316 | 133,248 |
| 2023 | ||
| Q1 | 105,768 | 148,828 |
| Q2 | 104,544 | 156,672 |
| Q3 | 104,608 | 162,408 |
| Source: Statistics Canada, table 11-10-0065-01. | ||
Rising debt service costs expected to affect future consumption
- Households have been borrowing less in light of higher interest rates, while mortgage interest payments continued to climb, up 4% in the third quarter of 2023.
- Although the popularity of variable rate mortgages continued to fall in the current interest rate environment, variable rate mortgages represent around 30% of total outstanding mortgage debt.
- Since early 2022, households renegotiating their mortgages have done so at higher rates.
- In 2024 and 2025, an estimated 2.2 million households will be facing an interest rate shock, representing 45% of all outstanding mortgages, while the total amount of mortgage loans to be renewed represents $675 billion (Canada Mortgage and Housing Corporation).
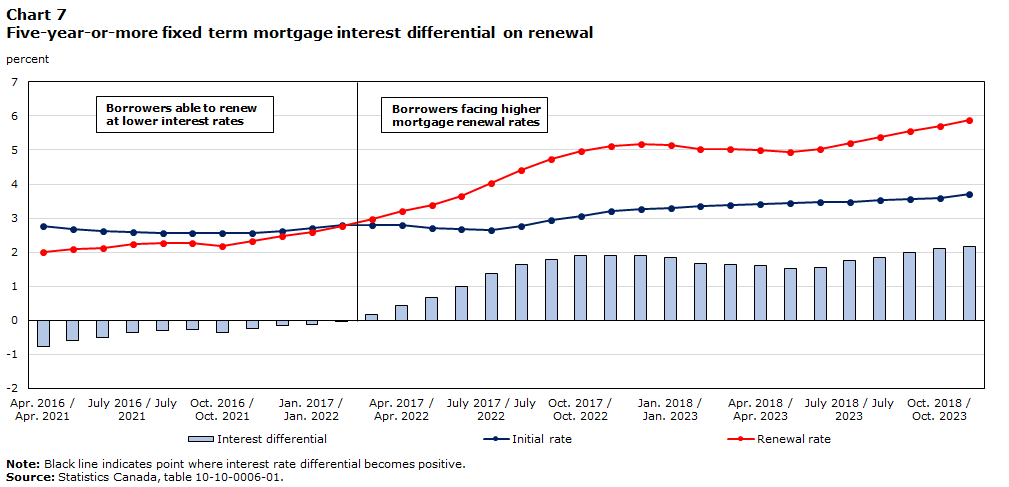
Data table for Chart 7
| Initial rate | Renewal rate | Interest differential | |
|---|---|---|---|
| percent | |||
| 2016/2021 | |||
| Apr. | 2.78 | 2.01 | -0.78 |
| May | 2.69 | 2.09 | -0.60 |
| June | 2.63 | 2.12 | -0.51 |
| July | 2.59 | 2.24 | -0.35 |
| Aug. | 2.57 | 2.28 | -0.29 |
| Sept. | 2.56 | 2.28 | -0.28 |
| Oct. | 2.56 | 2.19 | -0.37 |
| Nov. | 2.56 | 2.32 | -0.25 |
| Dec. | 2.62 | 2.47 | -0.15 |
| 2017/2022 | |||
| Jan. | 2.72 | 2.58 | -0.13 |
| Feb. | 2.80 | 2.78 | -0.01 |
| Mar. | 2.81 | 2.98 | 0.17 |
| Apr. | 2.79 | 3.22 | 0.43 |
| May | 2.72 | 3.38 | 0.66 |
| June | 2.67 | 3.66 | 0.99 |
| July | 2.66 | 4.03 | 1.37 |
| Aug. | 2.78 | 4.42 | 1.64 |
| Sept. | 2.94 | 4.74 | 1.80 |
| Oct. | 3.07 | 4.97 | 1.90 |
| Nov. | 3.21 | 5.12 | 1.91 |
| Dec. | 3.26 | 5.18 | 1.91 |
| 2018/2023 | |||
| Jan. | 3.31 | 5.15 | 1.84 |
| Feb. | 3.36 | 5.02 | 1.66 |
| Mar. | 3.38 | 5.02 | 1.63 |
| Apr. | 3.40 | 5.01 | 1.61 |
| May | 3.43 | 4.95 | 1.52 |
| June | 3.46 | 5.02 | 1.55 |
| July | 3.48 | 5.22 | 1.74 |
| Aug. | 3.53 | 5.37 | 1.84 |
| Sept. | 3.57 | 5.57 | 1.99 |
| Oct. | 3.59 | 5.70 | 2.10 |
| Nov. | 3.70 | 5.87 | 2.17 |
|
Note: Black line indicates point where interest rate differential becomes positive. Borrowers able to renew at lower interest rates and borrowers facing higher mortgage renewal rates. Source: Statistics Canada, table 10-10-0006-01. |
|||
Except for the highest income quintiles, net saving has deteriorated slightly since the pandemic, as renters and lower-income families are spending more than they make
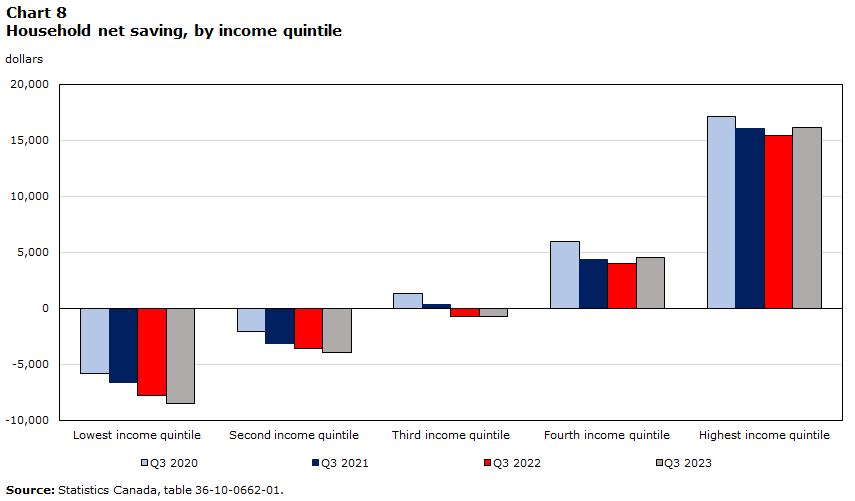
Data table for Chart 8
| Lowest income quintile | Second income quintile | Third income quintile | Fourth income quintile | Highest income quintile | |
|---|---|---|---|---|---|
| dollars | |||||
| Q3 | |||||
| 2020 | -5,815 | -2,106 | 1,326 | 5,946 | 17,105 |
| 2021 | -6,590 | -3,154 | 336 | 4,308 | 16,052 |
| 2022 | -7,767 | -3,578 | -764 | 4,030 | 15,426 |
| 2023 | -8,527 | -3,901 | -725 | 4,558 | 16,130 |
| Source: Statistics Canada, table 36-10-0662-01. | |||||
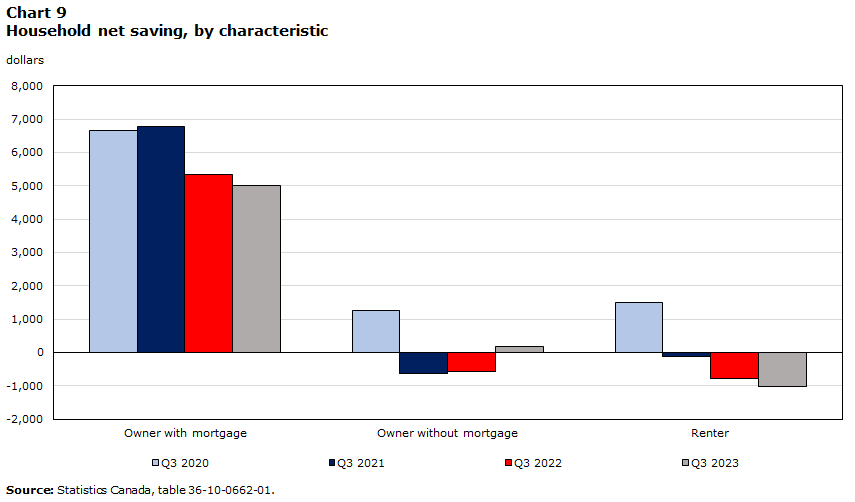
Data table for Chart 9
| Owner with mortgage | Owner without mortgage | Renter | |
|---|---|---|---|
| dollars | |||
| Q3 | |||
| 2020 | 6,658 | 1,254 | 1,498 |
| 2021 | 6,790 | -619 | -121 |
| 2022 | 5,347 | -568 | -789 |
| 2023 | 5009 | 189 | -1023 |
| Source: Statistics Canada, table: 36-10-0662-01. | |||
Compared with the onset of the pandemic, net saving has declined for all income quintiles, except for the fourth highest and highest. Dissaving for owners without a mortgage likely reflects age dynamics, as older Canadians are more likely to have paid off their home and are drawing from accumulated pension assets to support themselves during retirement—part of the life cycle of wealth and debt.
Net worth has increased across demographic groups—but not to the same extent
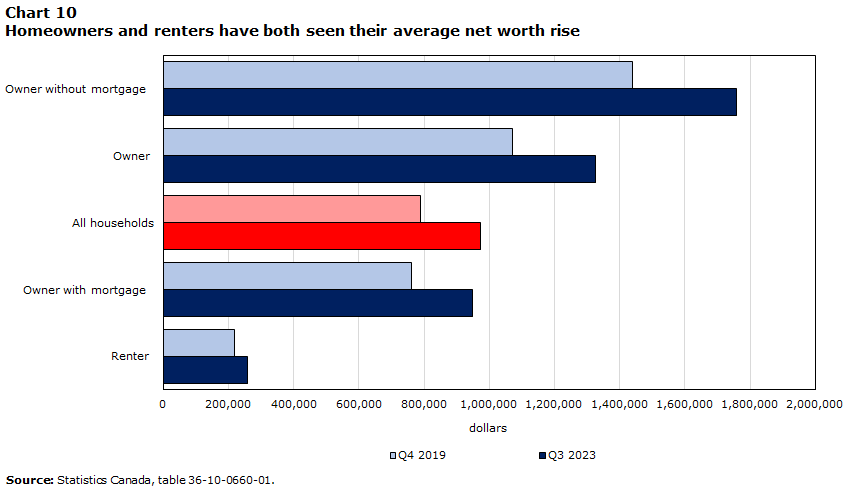
Data table for Chart 10
| Renter | Owner with mortgage | All households | Owner | Owner without mortgage | |
|---|---|---|---|---|---|
| dollars | |||||
| Q4 2019 | 218,130 | 762,126 | 789,482 | 1,070,443 | 1,439,296 |
| Q3 2023 | 259,369 | 949,711 | 972,113 | 1,326,051 | 1,757,561 |
| Source: Statistics Canada, table 36-10-0660-01. | |||||
Data table for Chart 11
| All households | Less than 35 years | 35 to 44 years | 45 to 54 years | 55 to 64 years | 65 years and over | |
|---|---|---|---|---|---|---|
| dollars | ||||||
| Q4 2019 | 789,482 | 236,039 | 510,253 | 1,041,539 | 1,215,085 | 903,742 |
| Q3 2023 | 972,113 | 325,446 | 635,555 | 1,288,409 | 1,511,862 | 1,087,484 |
| Source: Statistics Canada, table 36-10-0660-01. | ||||||
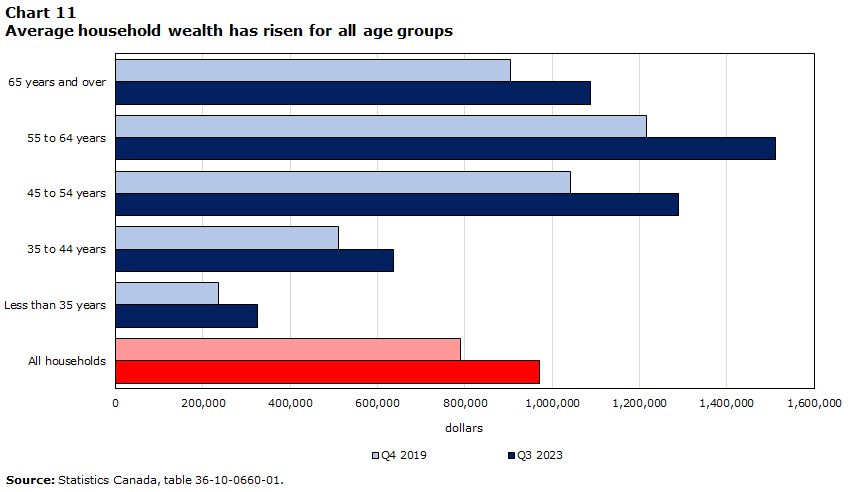
Imbalanced wealth creation: Though net worth has increased across all types of households, gains were more muted for renters (up from $218,000 to $260,000 on average) compared with homeowners (up from $1.4 million to $1.8 million for owners without a mortgage). Likewise, gains were more substantial for older Canadian families, those with housing and financial assets, while younger Canadian families saw smaller increases in wealth.
Prospective young homeowners turning away from the housing market, while homeowners pay off debt or look for affordable housing
Data table for Chart 12
| Less than 35 years | 35 to 44 years | 45 to 54 years | 55 to 64 years | 65 years and over | |
|---|---|---|---|---|---|
| percent | |||||
| Q3 | |||||
| 2020 | 6.6 | 7.6 | 6.2 | 5.7 | 4.7 |
| 2021 | 6.2 | 7.3 | 6.2 | 5.0 | 4.1 |
| 2022 | 7.3 | 8.5 | 7.6 | 6.1 | 4.9 |
| 2023 | 9.7 | 11.5 | 9.5 | 8.1 | 6.0 |
| Sources: Statistics Canada, tables 36-10-0662-01 and 11-10-0065-01. | |||||
Data table for Chart 13
| Less than 35 years | 35 to 44 years | 45 to 54 years | 55 to 64 years | 65 years and over | |
|---|---|---|---|---|---|
| index (Q4 2019=100) | |||||
| 2019 | |||||
| Q4 | 100.00 | 100.00 | 100.00 | 100.00 | 100.00 |
| 2020 | |||||
| Q1 | 98.88 | 100.67 | 102.88 | 99.08 | 99.21 |
| Q2 | 100.83 | 102.82 | 105.74 | 102.08 | 103.01 |
| Q3 | 104.83 | 105.71 | 108.75 | 104.75 | 105.99 |
| Q4 | 106.25 | 106.19 | 109.02 | 104.95 | 107.26 |
| 2021 | |||||
| Q1 | 109.97 | 108.61 | 111.46 | 107.21 | 109.26 |
| Q2 | 115.75 | 113.65 | 116.60 | 112.26 | 113.85 |
| Q3 | 121.72 | 117.69 | 119.49 | 114.50 | 115.19 |
| Q4 | 118.85 | 116.15 | 117.93 | 112.82 | 113.61 |
| 2022 | |||||
| Q1 | 120.65 | 118.16 | 120.00 | 114.99 | 115.67 |
| Q2 | 123.18 | 121.40 | 123.21 | 118.23 | 118.15 |
| Q3 | 124.75 | 123.06 | 124.60 | 119.62 | 118.37 |
| Q4 | 123.43 | 123.53 | 125.38 | 120.65 | 119.51 |
| 2023 | |||||
| Q1 | 121.54 | 123.70 | 126.18 | 122.07 | 120.82 |
| Q2 | 120.03 | 124.44 | 127.87 | 124.80 | 123.38 |
| Q3 | 118.56 | 124.81 | 129.00 | 126.42 | 124.13 |
| Source: Statistics Canada table 36-10-0660-01. | |||||
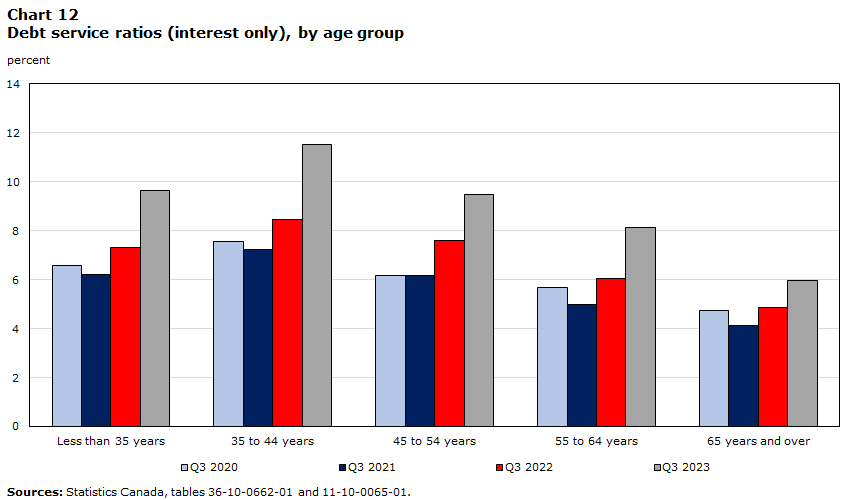
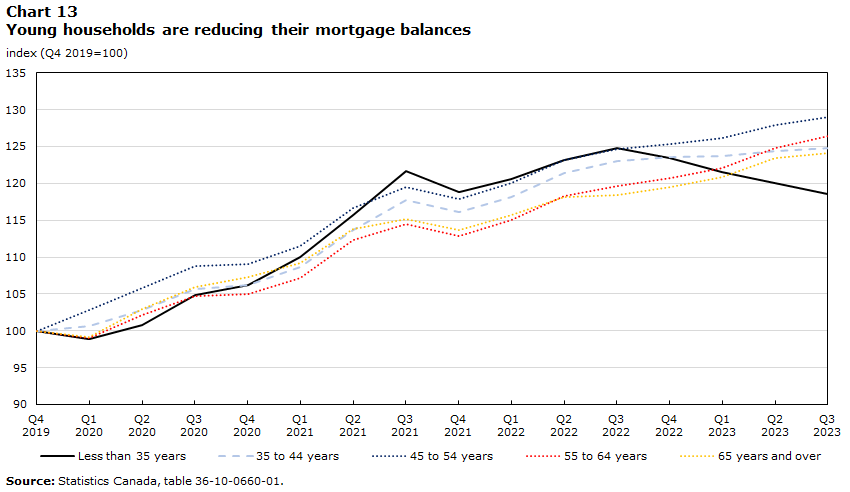
Younger households hit harder by rising debt servicing costs: Over the last year, debt ratios have increased for all age groups, but most sharply for younger households (households headed by people aged 35-44), up 3.1 percentage points, which are more likely to have larger mortgages. Younger households may also be starting to turn away from the housing market, leading to less mortgage debt overall. Access to homeownership has long facilitated economic and social mobility—particularly for immigrants—and, as such, barriers to homeownership mean risks to socioeconomic mobility.
Real estate continues to be central to wealth accumulation across the life cycle
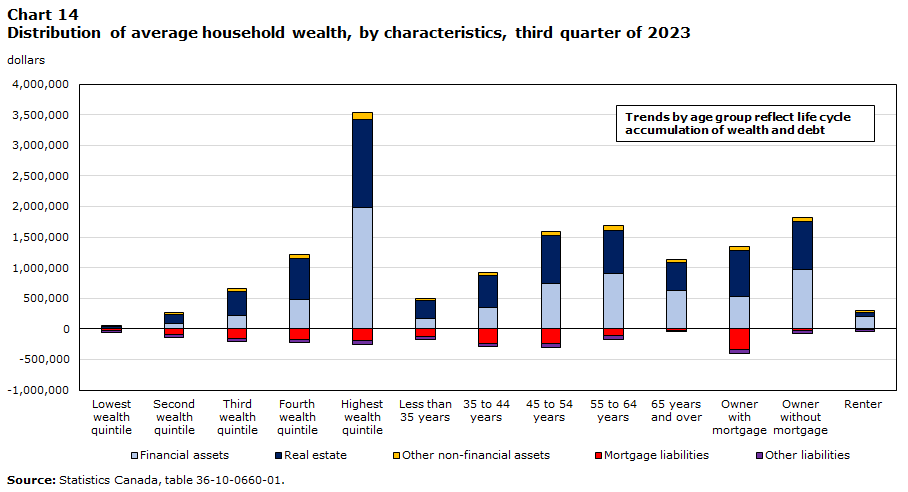
- For an average household, real estate represents about fifty five percent of their wealth and mortgages represent most of their debt—trends even more pronounced for middle-class or working-age families.
- Financial assets are also important to wealth creation for the richest families and homeowners.
- Of total wealth, 61% is held by those 55 and older, suggesting major risks for intergenerational mobility in the coming decades.
Data table for Chart 14
| Financial assets | Real estate | Other non-financial assets | Mortgage liabilities | Other liabilities | Net worth (wealth) | |
|---|---|---|---|---|---|---|
| dollars | ||||||
| Lowest wealth quintile | 11,543 | 30,149 | 15,938 | -25,328 | -33,187 | -885 |
| Second wealth quintile | 81,448 | 155,043 | 36,179 | -100,320 | -35,988 | 136,362 |
| Third wealth quintile | 222,019 | 390,602 | 51,813 | -162,461 | -45,729 | 456,244 |
| Fourth wealth quintile | 486,096 | 665,062 | 67,644 | -171,143 | -54,513 | 993,146 |
| Highest wealth quintile | 1,985,955 | 1,431,681 | 112,236 | -187,919 | -66,254 | 3,275,700 |
| Less than 35 years | 167,702 | 290,413 | 39,900 | -129,667 | -42,901 | 325,446 |
| 35 to 44 years | 344,949 | 519,258 | 61,690 | -233,024 | -57,319 | 635,555 |
| 45 to 54 years | 736,178 | 785,635 | 76,265 | -235,234 | -74,435 | 1,288,409 |
| 55 to 64 years | 904,923 | 704,607 | 71,762 | -106,604 | -62,825 | 1,511,862 |
| 65 years and over | 626,037 | 463,209 | 45,334 | -26,520 | -20,576 | 1,087,484 |
| Owner with mortgage | 521,134 | 755,538 | 73,975 | -333,963 | -66,974 | 949,711 |
| Owner without mortgage | 973,578 | 783,604 | 68,610 | -21,459 | -46,773 | 1,757,561 |
| Renter | 206,022 | 63,076 | 27,131 | -10,729 | -26,131 | 259,369 |
|
Note: Trends by age group reflect life cycle accumulation of wealth and debt. Source: Statistics Canada, table 36-10-0660-01. |
||||||
Takeaways
- Canada’s economic focus on consumer spending and housing has led to imbalances in the financial position of many Canadian households. Increases in saving and gains in net worth following the pandemic are concentrated at the top—greatest for homeowners and the richest households.
- In a higher interest rate environment, evidence suggests that younger households may be starting to turn away from the housing market or extending their mortgages past 30 years. Given that housing has been critical to wealth creation and financial security across the life cycle, barriers to homeownership may have broader implications for social cohesion and upward mobility.
- Looking forward, as almost half of mortgages are renewed in 2024 and 2025, there is a great deal of uncertainty for households that have already cut back their spending, in addition to the potential impact on consumer spending and, as such, economic growth.
For more information, please contact
analyticalstudies-etudesanalytiques@statcan.gc.ca
- Date modified: