
Research to Insights: Perspectives on growth, inflation and affordability

Archived Content
Information identified as archived is provided for reference, research or recordkeeping purposes. It is not subject to the Government of Canada Web Standards and has not been altered or updated since it was archived. Please "contact us" to request a format other than those available.
Skip to text
Text begins
About Research to Insights
The Research to Insights series of presentations features a broad range of findings on selected research topics. Each presentation draws from and integrates evidence from various studies that use innovative and high-quality data and methods to better understand relevant and complex policy issues.
Based on applied research of valuable data, the series is intended to provide decision makers, and Canadians more broadly, a comprehensive and horizontal view of the current economic, social and health issues we face in a changing world.
Context
- Economic activity has slowed as households and businesses adjust to higher borrowing costs.
- Population growth has outpaced recent employment gains as the unmet demand for labour eases.
- Per capita output and business productivity are trending lower and are currently below levels observed before the COVID-19 pandemic.
- Pressures on affordability show little signs of easing.
- Financial pressures are continuing to build on younger households and those with lower and middle incomes.
Economic activity slows as consumers rein in spending
- Household spending slowed in the second quarter of 2023, with lower outlays on many consumer durables. Retail volumes were down 1.3%, despite higher labour incomes.
- The economy-wide stock-to-sales ratio reached its highest level since the initial COVID-19 lockdowns.
- Economy-wide output has been flat, on trend, from February to August. Wildfires in the spring impacted resource extraction, while auto manufacturing continued to rebound from supply disruptions. Declines in homebuilding continued to weigh on growth.

Data table for Chart 1
| Gross domestic product (LHS) | Policy rate (RHS) | ||
|---|---|---|---|
| month-over-month percentage growth | percent | ||
| 2021 | June | 0.81 | 0.25 |
| July | 0.53 | 0.25 | |
| August | 0.59 | 0.25 | |
| September | 0.33 | 0.25 | |
| October | 0.79 | 0.25 | |
| November | 0.47 | 0.25 | |
| December | 0.12 | 0.25 | |
| 2022 | January | -0.22 | 0.25 |
| February | 0.68 | 0.25 | |
| March | 0.67 | 0.50 | |
| April | 0.07 | 1.00 | |
| May | 0.28 | 1.00 | |
| June | 0.24 | 1.50 | |
| July | 0.12 | 2.50 | |
| August | 0.24 | 2.50 | |
| September | 0.12 | 3.25 | |
| October | 0.02 | 3.75 | |
| November | 0.12 | 3.75 | |
| December | -0.09 | 4.25 | |
| 2023 | January | 0.61 | 4.50 |
| February | 0.06 | 4.50 | |
| March | 0.02 | 4.50 | |
| April | -0.09 | 4.50 | |
| May | 0.22 | 4.50 | |
| June | -0.16 | 4.75 | |
| July | -0.01 | 5.00 | |
| August | 0.04 | 5.00 | |
|
Notes: LHS refers to left hand scale and RHS refers to right hand scale. Sources: Statistics Canada, table 36-10-0434-01 and Bank of Canada. |
|||
A weaker outlook: In the third quarter, about two-thirds of businesses were optimistic about their outlook over the next year, down from about three in four businesses in the second quarter.
Employment growth moderates as job vacancies ease
- The pace of employment growth has slowed recently, with monthly gains averaging 30,000 from February to September 2023.
- The unmet demand for workers continued to ease—down 32% from peak levels—while the number of unemployed people rose 131,000 from April to September.
- In the second quarter, more than one-third of businesses anticipated challenges in recruiting skilled employees in the coming months. Four in 10 businesses expected workforce-related obstacles to limit their growth, while 1 in 3 anticipated hiring less-qualified candidates.

Data table for Chart 2
| Job vacancies (RHS) | Unemployment-to-job vacancy ratio (LHS) | ||
|---|---|---|---|
| number of job vacancies | percent | ||
| 2022 | January | 938,195 | 1.4 |
| February | 921,430 | 1.2 | |
| March | 990,015 | 1.1 | |
| April | 993,625 | 1.1 | |
| May | 1,003,240 | 1.1 | |
| June | 984,175 | 1.0 | |
| July | 974,990 | 1.0 | |
| August | 923,225 | 1.2 | |
| September | 911,885 | 1.2 | |
| October | 885,755 | 1.2 | |
| November | 872,605 | 1.2 | |
| December | 846,525 | 1.2 | |
| 2023 | January | 864,125 | 1.2 |
| February | 835,120 | 1.3 | |
| March | 800,750 | 1.3 | |
| April | 800,165 | 1.3 | |
| May | 775,640 | 1.4 | |
| June | 741,570 | 1.5 | |
| July | 697,945 | 1.7 | |
| August | 682,390 | 1.7 | |
|
Notes: LHS refers to left hand scale and RHS refers to right hand scale. Sources: Statistics Canada, tables 14-10-0287-01 and 14-10-0432-01. |
|||
Labour shortages more apparent among lower-skilled occupations: Early in the pandemic, the demand for lower-skilled workers outpaced the potential supply of available candidates. Toward the middle of 2023, this imbalance was no longer apparent, as vacancies for lower-skilled occupations have pulled back.
For more information: Unemployment and job vacancies by education, 2016 to 2022.
Population growth outpaces employment growth
- Both the working-age population and labour force are expanding at a substantially faster pace in 2023, within the context of strong population growth.
- With population growth outpacing recent employment gains, the employment rate (the percentage of working-age people who are employed) has edged lower and is currently similar to its pre-pandemic baseline.
- Recent population increases will not alleviate the overall impacts of population aging on the labour market, with about one in four workers expecting to retire in the coming decade.

Data table for Chart 3
| 2022 | First nine months of 2023 | |
|---|---|---|
| thousands of persons | ||
| Employment | 34.1 | 43.1 |
| Labour force | 18.1 | 59.3 |
| Working age population | 41.4 | 78.8 |
| Source: Statistics Canada, table 14-10-0287-01. | ||
Challenges related to skill utilization: Immigrants and non-permanent residents account for less than one-third of the working-age population, but for more than half of those with postgraduate degrees. Almost two-thirds of immigrants with a foreign bachelor’s degree in nursing (or higher) do not work in their field. Immigrants with a foreign degree are twice as likely as Canadian-born degree holders to be overqualified.
Declines in gross domestic product per capita portend lower living standards
- Economic growth, measured on a per capita basis, stagnated during the pandemic, as increases in real output did not keep pace with population growth. Real gross domestic product (GDP) per capita fell in the second quarter of 2023, the third decline in the past four quarters.
- Increases in GDP per capita can be driven by three factors:
- higher labour productivity (output per hour worked)
- higher work intensity (hours worked per job)
- a higher employment-to-population ratio.
- In the four decades leading up to the pandemic, nearly all of the increase in GDP per capita reflected increases in labour productivity. Structural trends related to population aging and work intensity suggest that productivity will remain the key driver of living standards in the post-pandemic era.

Data table for Chart 4
| GDP per capita | Trend in GDP per capita | ||
|---|---|---|---|
| Index Q1 1981 = 100 | |||
| 1981 | Q1 | 100.00 | 100.00 |
| Q2 | 100.85 | 100.42 | |
| Q3 | 99.59 | 100.84 | |
| Q4 | 98.74 | 101.26 | |
| 1982 | Q1 | 97.35 | 101.68 |
| Q2 | 95.98 | 102.10 | |
| Q3 | 94.85 | 102.52 | |
| Q4 | 93.69 | 102.94 | |
| 1983 | Q1 | 95.07 | 103.36 |
| Q2 | 96.72 | 103.78 | |
| Q3 | 97.55 | 104.20 | |
| Q4 | 98.51 | 104.62 | |
| 1984 | Q1 | 100.02 | 105.05 |
| Q2 | 101.75 | 105.47 | |
| Q3 | 101.91 | 105.89 | |
| Q4 | 103.24 | 106.31 | |
| 1985 | Q1 | 104.63 | 106.73 |
| Q2 | 104.74 | 107.15 | |
| Q3 | 105.79 | 107.57 | |
| Q4 | 107.12 | 107.99 | |
| 1986 | Q1 | 106.89 | 108.41 |
| Q2 | 107.26 | 108.83 | |
| Q3 | 107.06 | 109.25 | |
| Q4 | 105.94 | 109.67 | |
| 1987 | Q1 | 108.10 | 110.09 |
| Q2 | 109.12 | 110.51 | |
| Q3 | 110.36 | 110.93 | |
| Q4 | 111.38 | 111.35 | |
| 1988 | Q1 | 112.75 | 111.77 |
| Q2 | 113.42 | 112.19 | |
| Q3 | 112.96 | 112.61 | |
| Q4 | 113.15 | 113.03 | |
| 1989 | Q1 | 114.02 | 113.45 |
| Q2 | 113.97 | 113.87 | |
| Q3 | 113.83 | 114.29 | |
| Q4 | 113.07 | 114.71 | |
| 1990 | Q1 | 113.88 | 115.14 |
| Q2 | 112.98 | 115.56 | |
| Q3 | 111.68 | 115.98 | |
| Q4 | 110.22 | 116.40 | |
| 1991 | Q1 | 108.46 | 116.82 |
| Q2 | 108.68 | 117.24 | |
| Q3 | 108.41 | 117.66 | |
| Q4 | 108.26 | 118.08 | |
| 1992 | Q1 | 108.13 | 118.50 |
| Q2 | 107.92 | 118.92 | |
| Q3 | 108.12 | 119.34 | |
| Q4 | 108.34 | 119.76 | |
| 1993 | Q1 | 108.80 | 120.18 |
| Q2 | 109.54 | 120.60 | |
| Q3 | 110.26 | 121.02 | |
| Q4 | 110.34 | 121.44 | |
| 1994 | Q1 | 111.78 | 121.86 |
| Q2 | 113.13 | 122.28 | |
| Q3 | 114.21 | 122.70 | |
| Q4 | 114.66 | 123.12 | |
| 1995 | Q1 | 115.55 | 123.54 |
| Q2 | 115.32 | 123.96 | |
| Q3 | 115.11 | 124.38 | |
| Q4 | 115.21 | 124.80 | |
| 1996 | Q1 | 115.10 | 125.23 |
| Q2 | 115.63 | 125.65 | |
| Q3 | 116.25 | 126.07 | |
| Q4 | 116.80 | 126.49 | |
| 1997 | Q1 | 118.17 | 126.91 |
| Q2 | 119.24 | 127.33 | |
| Q3 | 120.30 | 127.75 | |
| Q4 | 121.10 | 128.17 | |
| 1998 | Q1 | 122.67 | 128.59 |
| Q2 | 122.53 | 129.01 | |
| Q3 | 123.34 | 129.43 | |
| Q4 | 124.70 | 129.85 | |
| 1999 | Q1 | 126.84 | 130.27 |
| Q2 | 127.67 | 130.69 | |
| Q3 | 129.30 | 131.11 | |
| Q4 | 130.73 | 131.53 | |
| 2000 | Q1 | 132.67 | 131.95 |
| Q2 | 133.95 | 132.37 | |
| Q3 | 134.91 | 132.79 | |
| Q4 | 134.71 | 133.21 | |
| 2001 | Q1 | 135.24 | 133.63 |
| Q2 | 135.23 | 134.05 | |
| Q3 | 134.66 | 134.47 | |
| Q4 | 135.01 | 134.89 | |
| 2002 | Q1 | 136.84 | 135.32 |
| Q2 | 137.27 | 135.74 | |
| Q3 | 137.99 | 136.16 | |
| Q4 | 138.34 | 136.58 | |
| 2003 | Q1 | 138.98 | 137.00 |
| Q2 | 138.47 | 137.42 | |
| Q3 | 138.57 | 137.84 | |
| Q4 | 139.12 | 138.26 | |
| 2004 | Q1 | 139.94 | 138.68 |
| Q2 | 141.30 | 139.10 | |
| Q3 | 142.55 | 139.52 | |
| Q4 | 143.13 | 139.94 | |
| 2005 | Q1 | 143.46 | 140.36 |
| Q2 | 144.20 | 140.78 | |
| Q3 | 145.49 | 141.20 | |
| Q4 | 146.43 | 141.62 | |
| 2006 | Q1 | 147.43 | 142.04 |
| Q2 | 147.16 | 142.46 | |
| Q3 | 147.12 | 142.88 | |
| Q4 | 147.21 | 143.30 | |
| 2007 | Q1 | 147.98 | 143.72 |
| Q2 | 149.10 | 144.14 | |
| Q3 | 149.26 | 144.56 | |
| Q4 | 148.92 | 144.99 | |
| 2008 | Q1 | 148.81 | 145.41 |
| Q2 | 149.01 | 145.83 | |
| Q3 | 149.69 | 146.25 | |
| Q4 | 147.40 | 146.67 | |
| 2009 | Q1 | 143.83 | 147.09 |
| Q2 | 141.90 | 147.51 | |
| Q3 | 142.04 | 147.93 | |
| Q4 | 143.15 | 148.35 | |
| 2010 | Q1 | 144.66 | 148.77 |
| Q2 | 145.07 | 149.19 | |
| Q3 | 145.60 | 149.61 | |
| Q4 | 146.68 | 150.03 | |
| 2011 | Q1 | 147.64 | 150.45 |
| Q2 | 147.65 | 150.87 | |
| Q3 | 149.21 | 151.29 | |
| Q4 | 149.87 | 151.71 | |
| 2012 | Q1 | 149.71 | 152.13 |
| Q2 | 149.87 | 152.55 | |
| Q3 | 149.55 | 152.97 | |
| Q4 | 149.33 | 153.39 | |
| 2013 | Q1 | 150.47 | 153.81 |
| Q2 | 151.02 | 154.23 | |
| Q3 | 151.71 | 154.65 | |
| Q4 | 152.74 | 155.08 | |
| 2014 | Q1 | 152.83 | 155.50 |
| Q2 | 153.90 | 155.92 | |
| Q3 | 154.88 | 156.34 | |
| Q4 | 155.41 | 156.76 | |
| 2015 | Q1 | 154.49 | 157.18 |
| Q2 | 153.91 | 157.60 | |
| Q3 | 154.06 | 158.02 | |
| Q4 | 153.66 | 158.44 | |
| 2016 | Q1 | 154.29 | 158.86 |
| Q2 | 153.11 | 159.28 | |
| Q3 | 154.10 | 159.70 | |
| Q4 | 154.32 | 160.12 | |
| 2017 | Q1 | 155.76 | 160.54 |
| Q2 | 156.99 | 160.96 | |
| Q3 | 157.02 | 161.38 | |
| Q4 | 157.08 | 161.80 | |
| 2018 | Q1 | 158.12 | 162.22 |
| Q2 | 158.93 | 162.64 | |
| Q3 | 159.31 | 163.06 | |
| Q4 | 159.05 | 163.48 | |
| 2019 | Q1 | 158.85 | 163.90 |
| Q2 | 160.00 | 164.32 | |
| Q3 | 159.83 | 164.74 | |
| Q4 | 159.47 | 165.17 | |
| 2020 | Q1 | 155.67 | 165.59 |
| Q2 | 138.38 | 166.01 | |
| Q3 | 150.77 | 166.43 | |
| Q4 | 153.98 | 166.85 | |
| 2021 | Q1 | 155.85 | 167.27 |
| Q2 | 154.60 | 167.69 | |
| Q3 | 156.40 | 168.11 | |
| Q4 | 158.18 | 168.53 | |
| 2022 | Q1 | 158.83 | 168.95 |
| Q2 | 159.72 | 169.37 | |
| Q3 | 159.44 | 169.79 | |
| Q4 | 157.91 | 170.21 | |
| 2023 | Q1 | 157.83 | 170.63 |
| Q2 | 156.60 | 171.05 | |
| Sources: Statistics Canada, tables 36-10-0207-01 and 17-10-0009-01. | |||
Getting back to trend is no small task: GDP per capita would have to expand by an average of 1.5% per year over the next decade to get back to its historical long-term growth rate. This is a similar pace to that observed in the 1990s, when the population was increasing at a slower pace.
Raising of living standards will depend on productivity growth
- After rising sharply in the early stages of the pandemic, labour productivity has declined in 11 of the past 12 quarters and is below pre-pandemic levels.
- A key driver of productivity growth is business investment in non-residential structures and machinery and equipment, which has pulled back since the oil price shock in the mid-2010s.
- While non-residential business investment rebounded to pre-COVID-19 levels by mid-2022, current outlays remained 14% below peak levels from 2014.
- Companies have been changing how information and communications technology (ICT) inputs are being integrated into their production systems. Over the last decade, spending on ICT services as intermediate inputs, possibly linked to cloud computing and other advances in data management, has risen at a faster pace than traditional outlays on ICT capital.

Data table for Chart 5
| Labour productivity | Real total compensation per hour worked | ||
|---|---|---|---|
| index (Q1 2018=100) | |||
| 2018 | Q1 | 100 | 100 |
| Q2 | 101 | 99 | |
| Q3 | 100 | 99 | |
| Q4 | 100 | 102 | |
| 2019 | Q1 | 101 | 102 |
| Q2 | 100 | 101 | |
| Q3 | 101 | 102 | |
| Q4 | 101 | 102 | |
| 2020 | Q1 | 106 | 109 |
| Q2 | 119 | 131 | |
| Q3 | 107 | 112 | |
| Q4 | 106 | 108 | |
| 2021 | Q1 | 105 | 104 |
| Q2 | 103 | 104 | |
| Q3 | 102 | 103 | |
| Q4 | 101 | 100 | |
| 2022 | Q1 | 101 | 100 |
| Q2 | 101 | 97 | |
| Q3 | 101 | 99 | |
| Q4 | 100 | 101 | |
| 2023 | Q1 | 99 | 102 |
| Q2 | 99 | 103 | |
| Source: Statistics Canada, table 36-10-0206-01. | |||
New sources of growth: The widespread adoption of digital services, accelerated by the pandemic, may provide an important source of productivity growth akin to the integration of information and communications technology in the 1990s.
As headline inflation eases, pressures on living costs remain
- Much of the slower pace of headline inflation during the first half of 2023 reflected steep year-over-year declines in gas prices. The pace of food inflation has begun to ease, but prices for many household staples remain elevated.
- Grocery prices have risen by 21% since inflationary pressures began to build in early 2021. The growth in average weekly earnings over this period was 7.8%.
- Shelter costs also remain high, bolstered by a 31% year-over-year increase in mortgage interest costs, the main upward contributor to inflation in recent months.
- Higher rental prices were the second-largest upward contributor to headline inflation from March to September.

Data table for Chart 6
| Percent | |
|---|---|
| Food purchased from stores | 20.7 |
| Shelter | 17.8 |
| All-items CPI | 14.7 |
| Average hourly wage | 10.6 |
| Average weekly earnings (to August) | 7.8 |
|
Note: CPI refers to Consumer Price Index. Sources: Statistics Canada, tables 18-10-0004-01, 14-10-0065-01, and 14-10-0223-01. |
|
While inflation eases, prices continue to rise: Prices continued to rise in 2023. The pace of price growth during the first nine months of the year (+3.5%) was moderately slower than price growth during the first nine months of 2021 (+4.0%), when inflationary pressures were building.
Escalating homeownership and rental costs create barriers to mobility
- The Bank of Canada’s housing affordability index was near or above 50% for five consecutive quarters. This means about half of average disposable income is going to mortgage-related costs and utility fees.
- Rising borrowing costs have pushed many potential homeowners out of the market, straining an already hot rental market. Average asking rents rose to a record $2,149 in September 2023 (Rentals.ca).
- In 2022, 56% of Canadians were very or somewhat concerned about whether they could afford housing or rent, while 24% delayed buying a home or moving to a new rental because of rising prices.

Data table for Chart 7
| Percent | Benchmark | |
|---|---|---|
| Canada | 39.2 | 212,200 |
| Greater Vancouver | 31.2 | 288,700 |
| Calgary | 34.5 | 142,400 |
| Winnipeg | 23.0 | 64,700 |
| Greater Toronto | 42.5 | 343,600 |
| Montréal | 40.1 | 150,300 |
| Halifax / Dartmouth | 69.5 | 219,900 |
| Source: Canadian Real Estate Association. | ||
Barriers to homeownership may have long-term economic impacts: The average per capita net worth of homeowners without a mortgage is $1.7 million, while renters have an average per capita wealth of $232,000. Homeownership has traditionally been a particularly important source of wealth creation for immigrants.
For more information: The Wealth of Immigrant Families in Canada.
The pace of homebuilding slowed during the first half of 2023
- Activity in the residential construction sector has pulled back sharply as borrowing costs have risen—real output in August 2023 was down 20% from levels in March 2022.
- Monthly housing starts averaged 235,000 (annualized) during the first half of 2023, down from 270,000 in the second half of the previous year. Annual price increases for residential building construction averaged 7.4% in the second quarter of 2023.
- Canada Mortgage and Housing Corporation has estimated that Canada will need an additional 3.45 million homes by 2030 to address affordability pressures in the housing market.
- To meet this target, the pace of homebuilding would have to double to over 500,000 units annually.
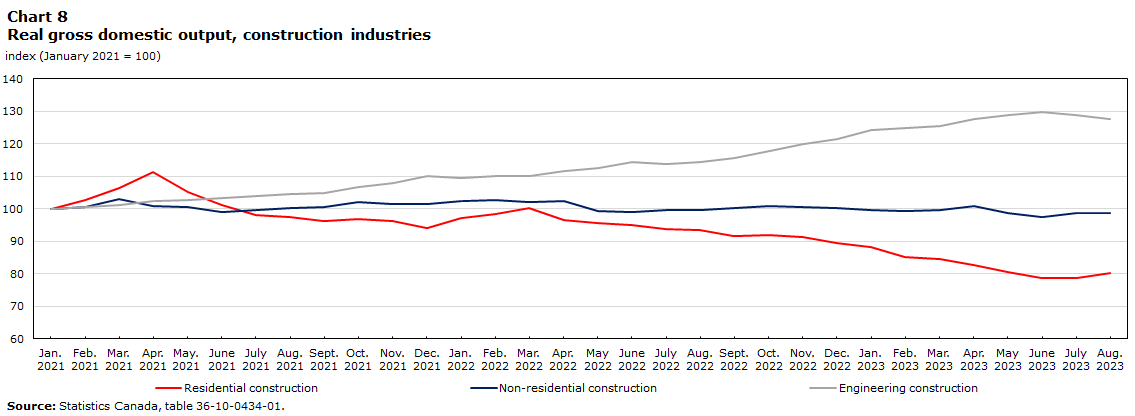
Data table for Chart 8
| Residential construction | Non-residential construction | Engineering construction | ||
|---|---|---|---|---|
| index (January 2021 = 100) | ||||
| 2021 | January | 100 | 100 | 100 |
| February | 103 | 101 | 101 | |
| March | 106 | 103 | 101 | |
| April | 111 | 101 | 102 | |
| May | 105 | 100 | 103 | |
| June | 101 | 99 | 103 | |
| July | 98 | 100 | 104 | |
| August | 97 | 100 | 104 | |
| September | 96 | 101 | 105 | |
| October | 97 | 102 | 107 | |
| November | 96 | 102 | 108 | |
| December | 94 | 102 | 110 | |
| 2022 | January | 97 | 102 | 109 |
| February | 98 | 103 | 110 | |
| March | 100 | 102 | 110 | |
| April | 97 | 103 | 112 | |
| May | 96 | 99 | 113 | |
| June | 95 | 99 | 114 | |
| July | 94 | 100 | 114 | |
| August | 94 | 100 | 114 | |
| September | 92 | 100 | 116 | |
| October | 92 | 101 | 118 | |
| November | 91 | 101 | 120 | |
| December | 89 | 100 | 121 | |
| 2023 | January | 88 | 100 | 124 |
| February | 85 | 99 | 125 | |
| March | 85 | 100 | 126 | |
| April | 83 | 101 | 128 | |
| May | 81 | 99 | 129 | |
| June | 79 | 98 | 130 | |
| July | 79 | 99 | 129 | |
| August | 80 | 99 | 128 | |
| Source: Statistics Canada, table 36-10-0434-01. | ||||
Construction employment pulls back: Total employment in construction has declined by 55,000 since January 2023, contributing to the slower pace of employment growth that Canada has experienced in recent months. The job vacancy rate in construction remains well above pre-pandemic levels.
Pressures on affordability from rising living costs disproportionately impact younger and financially vulnerable households
- Income and wealth inequality are rebalancing to pre-pandemic norms. Among low income households, net savings have declined over the past year as income gains have not kept pace with rising living expenses, while high income households have seen their net savings increase.
- Younger families bear more risk as interest rates rise and debt-to-income ratios remain high. Over the last year, younger households have seen the largest increases in their debt service ratios.
- Young households have also reduced their mortgage balances. This suggests that prospective young homeowners may be turning away from the housing market, while current homeowners may be paying off existing mortgage debt or moving into more affordable accommodations.

Data table for Chart 9
| Percent | |
|---|---|
| Younger than 35 years | 189.6 |
| 35 to 44 years | 257.6 |
| 45 to 54 years | 244.2 |
| 55 to 64 years | 173.9 |
| 65 years and older | 71.9 |
| Source: Statistics Canada, table 36-10-0664-01. | |
Looking forward: High interest rates and inflation are likely to continue straining households’ ability to make ends meet without going further into debt, especially among younger and lower-income families. In late 2022, more than one-third of those aged 35 to 44 said they would be unable to cover an unexpected expense of $500.
Takeaways
- Affordability challenges will persist even as consumer inflation eases. Soaring housing and rental prices, owing to strong demand and weak supply, pose substantial risks to social and economic mobility. Financial and economic risks are amplified for certain demographic groups, particularly young families.
- Recent employment gains are not keeping pace with increases in the working-age population, putting downward pressure on the employment rate. Over the first nine months of 2023, the working-age population expanded by nearly 80,000 per month, almost twice the average pace observed in 2022.
- The improvement of living standards over the longer term will require sustained increases in labour productivity, which has continued to trend lower in recent quarters. Strategies to bolster investment, innovation and skill utilization will be important drivers of improvements in GDP per capita.
For more information, please contact
analyticalstudies-etudesanalytiques@statcan.gc.ca
- Date modified: