
Economic Insights
Two-step Immigration Selection: Recent Trends in Immigrant Labour Market Outcomes

Archived Content
Information identified as archived is provided for reference, research or recordkeeping purposes. It is not subject to the Government of Canada Web Standards and has not been altered or updated since it was archived. Please "contact us" to request a format other than those available.
Eden Crossman, Immigration, Refugees and Citizenship Canada
Garnett Picot, Refugees and Citizenship Canada
Skip to text
Text begins
This article examines whether the increased selection of economic immigrants from among temporary foreign workers accounted for the recent improvement in immigrants’ employment rates and entry earnings. Immigrants who were former temporary foreign workers, particularly those with medium or high levels of pre-immigration Canadian earnings, had higher employment rates and earnings after immigration than other immigrants. The expansion of two-step immigration selection was the driving force for the recent improvement in new immigrants’ labour market outcomes.
It is the third of five articles on the two-step selection process.
Introduction
In recent years, temporary foreign workers have rapidly become the main source of new economic immigrants to Canada. Among adult economic class immigrants, the share with pre-landing Canadian earnings increased from 8% for the 2000 landing cohort to 46% for the 2018 landing cohort. Among economic principal applicants, the corresponding share increased from 12% to 59%, respectively (Hou, Crossman and Picot 2020). Thus, the majority of economic immigrant principal applicants are selected from former foreign residents who had worked in Canada.
The selection of economic immigrants from among temporary foreign workers in Canada is essentially a two-step process. In the first step, Canadian employers play a major role in recruiting and evaluating temporary foreign workers. In the second step, the government decides how many and which temporary foreign temporary workers are eligible for admission as economic immigrants based on a set of standard selection criteria. The main advantages of two-step selection include a closer match between immigrant skills and labour market demand, and improved economic outcomes of immigrants (see the overview by Crossman, Hou and Picot 2020).
In parallel to the expansion of two-step immigration selection, Canada has seen significant improvement in the labour market outcomes among recent immigrants since the 2000s. For instance, Yssaad and Fields (2018) found that the employment rate increased from 65% in 2006 to 70% in 2017 among core-aged recent immigrants (those who had been in Canada for 5 years or less). In comparison, the employment rate for core-aged Canadian-born individuals was up only 1 percentage point over the period, from 83% to 84%; and unchanged, at 82%, for long-term immigrants (those who had been in Canada for more than 10 years). Immigrants admitted to Canada in 2016 earned 27% more in the first-year after immigration than those who arrived in 2007 (Statistics Canada 2019).
This article examines whether the expansion of two-step immigration selection accounted for most of the recent improvement in immigrants’ initial employment rates and entry earnings. This is the third article in a series that provides a broad overview of the increasing importance of temporary foreign workers in the selection and labour market outcomes of immigrants. The first article provides an overview of the literature on the advantage and potential risks of two-step immigration selection. The second article documents the recent expansion of two-step immigration selection in Canada. This article examines (1) the association between the rising share of immigrants selected from temporary foreign workers and improved economic outcomes in the initial years after immigration; and (2) the long-term labour market outcomes of economic immigrants selected from temporary foreign workers.
Two-step immigration selection and the recent trend in immigrant labour market outcomes
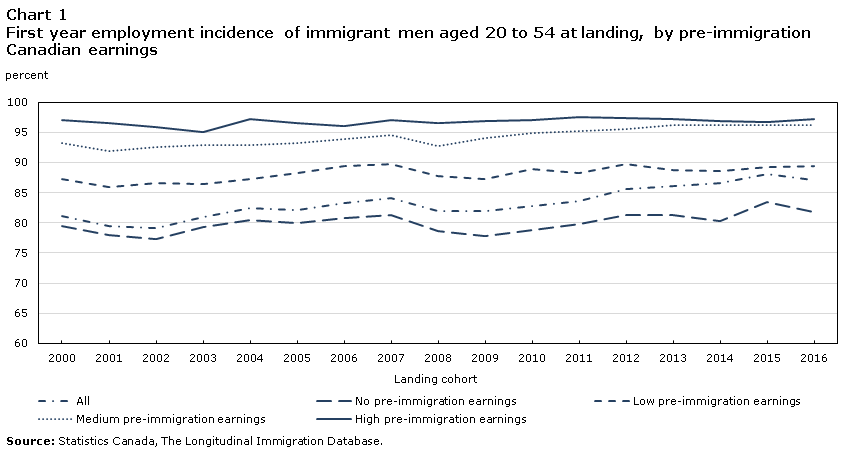
The recent trend in the employment incidence of new immigrants provides a first indication of a potential positive role of two-step migration. Charts 1 and 2 show the annual employment incidence in the first full-year after immigration among immigrant men and women aged 20 to 54 years at immigration, based on data derived from the Longitudinal Immigration Database (IMDB). The annual employment incidence is defined as the percentage of immigrant tax-filers who reported at least $500 employment income in a given tax year. Since this statistic considers whether an individual ever worked over an entire year, it is generally higher than the commonly used employment rate (e.g., from the Labour Force Survey) based on labour market activities in a reference week.
One striking finding presented in the two charts is the large difference in the employment incidence by the level of pre-immigration Canadian earnings which is measured as the maximum annual earnings that an individual earned in Canada within ten years prior to landing. For instance, for the 2016 entry cohort, the employment incidence was 82% for immigrant men without pre-immigration Canadian earnings, 89% for those with low pre-immigration Canadian earnings (>$0 - <=$20,000), 96% for those with medium pre-immigration earnings (>$20,000 - <=$50,000) and 97% for those with high pre-immigration earnings (>$50,000). The differences were even larger among immigrant women, with corresponding incidences at 55%, 80%, 93% and 97%, respectively. If immigrant men and women had medium or high annual earnings in Canada before immigration, essentially all of them continued to be employed in the first full year after immigration.
Data table for Chart 1
| All | No pre-immigration earnings | Low pre-immigration earnings | Medium pre-immigration earnings | High pre-immigration earnings | |
|---|---|---|---|---|---|
| percent | |||||
| 2000 | 81.054 | 79.533 | 87.226 | 93.246 | 97.078 |
| 2001 | 79.520 | 78.012 | 85.909 | 91.902 | 96.589 |
| 2002 | 79.096 | 77.296 | 86.585 | 92.605 | 95.925 |
| 2003 | 80.867 | 79.286 | 86.393 | 92.899 | 94.978 |
| 2004 | 82.463 | 80.403 | 87.295 | 92.900 | 97.169 |
| 2005 | 82.152 | 79.992 | 88.160 | 93.261 | 96.482 |
| 2006 | 83.332 | 80.771 | 89.468 | 93.839 | 96.066 |
| 2007 | 84.077 | 81.301 | 89.655 | 94.516 | 96.995 |
| 2008 | 81.884 | 78.601 | 87.687 | 92.677 | 96.572 |
| 2009 | 81.860 | 77.860 | 87.255 | 93.955 | 96.819 |
| 2010 | 82.722 | 78.738 | 88.849 | 94.937 | 97.055 |
| 2011 | 83.656 | 79.765 | 88.262 | 95.251 | 97.464 |
| 2012 | 85.539 | 81.249 | 89.659 | 95.601 | 97.280 |
| 2013 | 86.144 | 81.262 | 88.690 | 96.264 | 97.165 |
| 2014 | 86.651 | 80.362 | 88.571 | 96.199 | 96.931 |
| 2015 | 88.119 | 83.414 | 89.294 | 96.116 | 96.605 |
| 2016 | 87.094 | 81.694 | 89.446 | 96.260 | 97.154 |
| Source: Statistics Canada, The Longitudinal Immigration Database. | |||||

Data table for Chart 2
| All | No pre-immigration earnings | Low pre-immigration earnings | Medium pre-immigration earnings | High pre-immigration earnings | |
|---|---|---|---|---|---|
| percent | |||||
| 2000 | 61.202 | 58.576 | 82.077 | 93.286 | 94.969 |
| 2001 | 60.247 | 57.694 | 80.071 | 92.026 | 92.669 |
| 2002 | 59.893 | 57.290 | 78.492 | 91.743 | 93.981 |
| 2003 | 60.934 | 57.794 | 79.566 | 92.686 | 96.970 |
| 2004 | 62.442 | 58.458 | 81.899 | 93.320 | 95.379 |
| 2005 | 63.626 | 59.637 | 81.921 | 92.476 | 95.401 |
| 2006 | 65.066 | 60.405 | 81.488 | 93.045 | 96.522 |
| 2007 | 65.531 | 60.477 | 82.361 | 92.824 | 95.572 |
| 2008 | 63.221 | 56.160 | 83.092 | 92.429 | 96.559 |
| 2009 | 62.518 | 54.843 | 81.036 | 91.362 | 96.184 |
| 2010 | 63.406 | 55.670 | 81.408 | 92.896 | 96.061 |
| 2011 | 63.107 | 55.542 | 80.302 | 92.546 | 96.393 |
| 2012 | 64.307 | 56.386 | 77.158 | 92.343 | 96.142 |
| 2013 | 64.870 | 55.404 | 78.893 | 93.151 | 96.023 |
| 2014 | 68.419 | 55.695 | 79.293 | 93.668 | 96.227 |
| 2015 | 68.786 | 56.098 | 79.450 | 93.962 | 96.724 |
| 2016 | 66.600 | 55.368 | 79.677 | 93.351 | 96.523 |
| Source: Statistics Canada, The Longitudinal Immigration Database. | |||||
In terms of the trend, the two charts show the first full-year employment incidence increased 6 percentage points for all men (Chart 1) and 5 percentage points for all women (Chart 2) between the 2000 and 2016 entry cohorts. These large increases were consistent with the trend for immigrant employment observed in the Labour Force Survey (Yssaad and Fields 2018). However, within the groups by level of pre-immigration earnings, there was little increase in the entry employment incidence among immigrant women, and the increase was generally small among immigrant men, about 2 to 3 percentage points for those with low or medium pre-immigration earnings.
While there was no or only small increases in the entry employment incidence within groups by pre-immigration earnings, the distribution among these groups changed considerably. Over the study period, the share of prime-age immigrant men with no pre-immigration Canadian earnings decreased from 87% for the 2000 landing cohort to 61% for the 2016 cohort, the share with low earnings changed little from 6% to 7%, while the share with medium and high earnings increased from 5% and 2% to 18% and 15%, respectively. A similar trend was observed among women as well.Note 1 Of course, changes in other socio-demographic characteristics of new immigrants could also be associated with this increase in the employment incidence. To evaluate the relative importance of growing two-step selection and changes in immigrant socio-demographic characteristics in accounting for the overall increase in the employment incidence, a multivariate model is constructed for immigrant men and women separately.
The dependent variable of the multivariate model is the likelihood of being employed (i.e. with at least $500 annual employment earnings) in the first full year after immigration. The focal independent variable is the entry cohort which is treated as a series of dummy variables, one for each entry year from 2000 to 2016. The explanatory variables include the level of pre-immigration Canadian earnings, source region, education level, official language knowledge, age at landing, immigration category, province of residence, and urban size.Note 2 These variables explained about 80% of the increase in the entry employment incidence for immigrant men, and all of the increase for immigrant women. Of the explained portion of the increase, the rising share of immigrants with medium and high pre-immigration Canadian earnings account for about two-thirds among both men and women. Changes in source regions also play an important, albeit secondary, role in the increase in the employment incidence among men. Over the 2000 to 2016 period, the share of immigrants from Southeast Asia (mostly the Philippines) increased considerably while the share from Eastern Asia (mostly China) decreased substantially. New immigrant men and women from Southeast Asia tend to have an employment rate much higher than the average for all new immigrants while those from Eastern Asia tend to have below-average employment rates (Yssaad and Fields 2018).
Noticeably, changes in official language knowledge and educational levels at landing contributed little to the improvement in entry employment incidences. These factors are common policy levers for immigration selection. The effect of changing immigration categories is a little more complex. When attempting to explain the recent trends in labour market outcomes, it is difficult to separate the effect of changes in immigration categories, notably the shift towards the Provincial Nominee Programs (PNP) and the Canadian Experience Class (CEC) and away from the Federal Skilled Worker Program (FSWP), from the rise in the share of entering immigrants who were temporary foreign workers. As noted in the second article in this series (Hou, Crossman and Picot 2020), the rise in number of temporary foreign workers selected was driven in part by the shift towards the PNPs and CEC. Had that redistribution not occurred, the increase in the number of temporary foreign workers selected would have been much smaller and its effect minimized. In that sense, the change in composition by immigration category was partially responsible for the improved outcomes, even though in the statistical analysis that factor is seen to contribute little. This is because in the regression model the effect of changes in the composition of immigrant classes was captured by levels of pre-immigration Canadian earnings. This result also implies it is not absolutely necessary to redistribute immigration categories to improve immigrant labour market outcomes as long as the share of temporary foreign workers increases within immigrant categories.
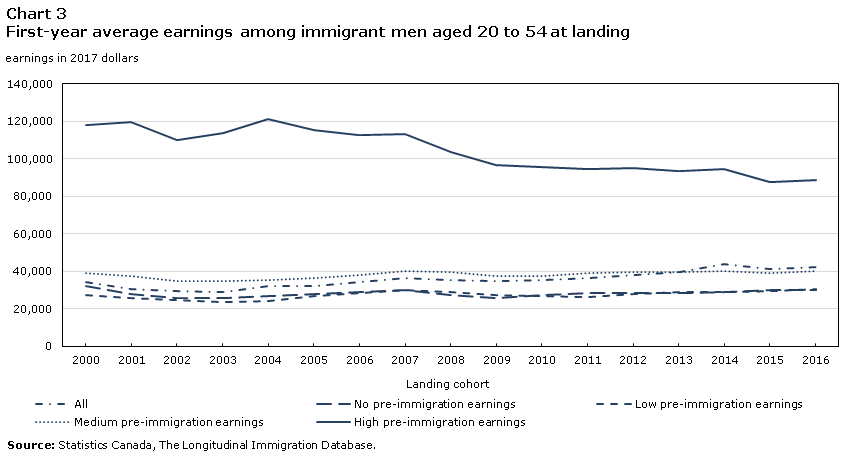
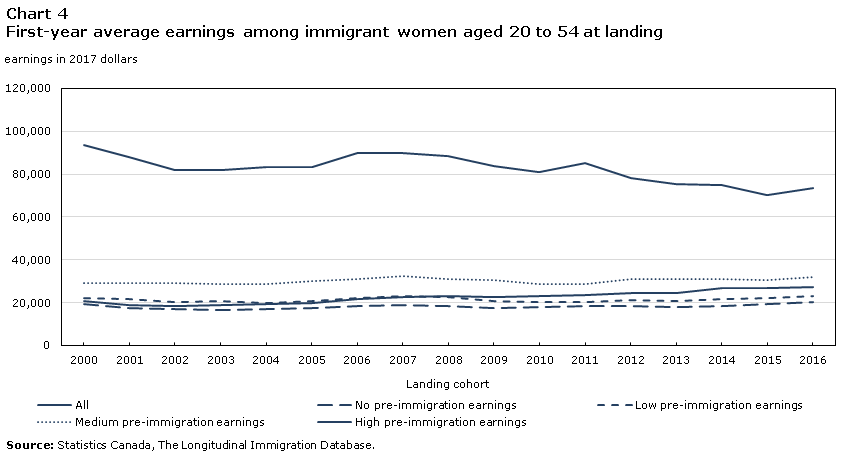
The expanding two-step selection had an even larger effect on the recent trend in entry earnings of immigrants than on their employment incidences. Charts 3 and 4 show average annual earnings in the first full year after immigration among immigrant men and women who were aged 20 to 54 years at landing and had at least $500 earnings in their first full year.
Similar to the patterns observed for employment incidence, there were large differences in average annual entry earnings of immigrants by level of pre-immigration Canadian earnings. Employed immigrant men without pre-immigration Canadian earnings and those with low pre-immigration Canadian earnings had similarly low entry earnings, about $30,000 for the 2016 entry cohort in 2017. Immigrant men with medium-level pre-immigration Canadian earnings had entry earnings about 22% to 45% higher than that of immigrant men who did not have earnings in Canada before immigration, depending on entry cohort. Immigrant men with high-level pre-immigration Canadian earnings had entry earnings about 1.9 to 3.5 times higher than that of immigrant men who did not have earnings in Canada before immigration. Similar patterns are observed among immigrant women.
In terms of the recent trend, average annual entry earnings of all immigrant men increased from $34,400 (in $2017 constant dollars) for the 2000 entry cohort (i.e. earnings in 2001) to $42,400 for the 2016 entry cohort, an increase of 23%. However, within the groups by level of pre-immigration Canadian earnings, there was a smaller increase (12%) in first full-year earnings between the 2000 and 2016 cohorts among immigrant men with low pre-immigration Canadian earnings. Entry earnings actually decreased by about 25% among immigrants with high-level pre-immigration Canadian earnings. Similar trends are observed among immigrant women (Chart 4). These results suggest the increase in entry earnings for all prime-age immigrants was driven mostly by increased shares of immigrants with medium- and high-level pre-immigration Canadian earnings.
Data table for Chart 3
| All | No pre-immigration earnings | Low pre-immigration earnings | Medium pre-immigration earnings | High pre-immigration earnings | |
|---|---|---|---|---|---|
| earnings in 2017 dollars | |||||
| 2000 | 34,428 | 32,106 | 27,320 | 39,258 | 118,140 |
| 2001 | 30,644 | 27,695 | 25,922 | 37,459 | 119,570 |
| 2002 | 29,213 | 25,922 | 24,802 | 34,834 | 109,817 |
| 2003 | 28,860 | 25,445 | 23,775 | 34,924 | 113,828 |
| 2004 | 31,831 | 26,812 | 24,134 | 35,098 | 121,511 |
| 2005 | 31,984 | 27,841 | 26,642 | 36,141 | 115,223 |
| 2006 | 34,486 | 29,111 | 28,508 | 37,750 | 112,735 |
| 2007 | 36,537 | 29,837 | 30,145 | 40,314 | 113,308 |
| 2008 | 35,497 | 27,554 | 28,874 | 39,540 | 103,757 |
| 2009 | 34,722 | 25,918 | 27,474 | 37,484 | 96,467 |
| 2010 | 35,344 | 27,313 | 26,955 | 37,385 | 95,539 |
| 2011 | 36,293 | 28,484 | 26,256 | 38,789 | 94,804 |
| 2012 | 38,061 | 28,281 | 27,889 | 39,703 | 94,935 |
| 2013 | 39,345 | 28,328 | 28,770 | 39,760 | 93,646 |
| 2014 | 43,746 | 28,631 | 29,095 | 40,101 | 94,487 |
| 2015 | 41,411 | 29,837 | 29,604 | 38,949 | 87,490 |
| 2016 | 42,392 | 30,112 | 30,726 | 40,145 | 88,454 |
| Source: Statistics Canada,The Longitudinal Immigration Database. | |||||
Data table for Chart 4
| All | No pre-immigration earnings | Low pre-immigration earnings | Medium pre-immigration earnings | High pre-immigration earnings | |
|---|---|---|---|---|---|
| earnings in 2017 dollars | |||||
| 2000 | 20,747 | 19,515 | 21,969 | 29,167 | 93,653 |
| 2001 | 19,058 | 17,631 | 21,600 | 28,961 | 87,975 |
| 2002 | 18,455 | 16,816 | 20,407 | 29,119 | 81,698 |
| 2003 | 18,627 | 16,549 | 20,558 | 28,747 | 81,781 |
| 2004 | 19,429 | 16,965 | 19,885 | 28,481 | 83,259 |
| 2005 | 19,968 | 17,493 | 20,895 | 30,114 | 83,324 |
| 2006 | 21,462 | 18,190 | 22,224 | 31,087 | 89,721 |
| 2007 | 22,754 | 19,053 | 23,065 | 32,359 | 89,934 |
| 2008 | 23,162 | 18,414 | 22,712 | 31,169 | 88,473 |
| 2009 | 22,783 | 17,469 | 20,933 | 30,334 | 83,911 |
| 2010 | 22,913 | 18,101 | 20,484 | 28,634 | 80,878 |
| 2011 | 23,441 | 18,562 | 20,035 | 28,843 | 85,242 |
| 2012 | 24,432 | 18,321 | 21,168 | 31,123 | 78,250 |
| 2013 | 24,491 | 17,987 | 20,934 | 31,047 | 75,175 |
| 2014 | 26,585 | 18,593 | 21,866 | 30,937 | 75,055 |
| 2015 | 26,709 | 19,531 | 22,198 | 30,684 | 70,268 |
| 2016 | 27,313 | 20,125 | 23,109 | 31,919 | 73,715 |
| Source: Statistics Canada, The Longitudinal Immigration Database. | |||||
To evaluate the relative roles of the expanding two-step selection and changes in immigrant socio-demographic factors, a multivariate regression model is constructed to account for the increase in entry earnings for all immigrants. The dependent variable is the first-year annual earnings (the results are similar when the logarithmic form is used). The focal independent variable is the entry cohort which is treated as a series of dummy variables to represent each entry cohort from 2000 to 2016. The explanatory variables include the level of pre-immigration Canadian earnings, source region, education level, official language knowledge, age at landing, immigration category, province, and urban size.
The model results indicate the included explanatory variables account for all of the increase in entry earnings among successive cohorts of immigrants over the 2000 to 2016 period. The increase in the share of immigrants with pre-immigration Canadian earnings accounts for 94% of the increase in entry earnings between the 2000 and 2016 entry cohorts. In comparison, changes in source region, education level, official language knowledge, and immigration category play a minor role. As noted earlier, to the extent that changing composition of immigration categories facilitated the expansion of the two-step selection process (see Hou, Crossman, Picot 2020), it had a positive indirect effect on the entry earnings trend. In the final analysis, the effect on early economic outcomes of the expanding two-step selection (whatever the causes) trumped all the other changes in the selection of immigrants.
Two-step immigration selection and the long-term labour market outcomes of immigrants
The substantial advantage in initial employment incidences and entry earnings among immigrants with medium or high pre-immigration Canadian earnings over other immigrants begs the question of how long this advantage will last. It may not be too surprising that individuals who already had a job in Canada at some point prior to landing would do better during the first year or two than those who enter the Canadian labour market with no such experience. Perhaps more important is the question of whether this advantage persists with an increased number of years after immigration. This section explores this question by first reviewing relevant previous studies and then providing updated statistics.
A previous study by Hou and Bonikowska (2018) found earnings differences between economic immigrants with previous skilled temporary work permits and immigrants without any prior Canadian experience narrowed rapidly in the initial years after arrival as the latter group experienced fast earnings growth, with or without adjusting for differences in human capital factors and source region. However, the gap did not disappear and remained large even after 10 years, indicative of a long-term benefit of two-step immigrant selection. Similarly, from an analysis of economic immigrant principal applicants who arrived between 1988 and 2008, Pandey and Townsend (2017) showed immigrant men who filed income tax in Canada before becoming a permanent resident had higher earnings than otherwise-similar immigrants who did not file prior to immigration for up to 20 years after first arrival.
The study by Hou and Bonikowska (2018) further found economic immigrants with prior Canadian non-skilled work experience had significantly lower earnings at the time of arrival and slower earnings growth than immigrants without prior Canadian experience. This result highlights a potential limitation of employer selection. Temporary foreign workers who were specifically recruited to work in low-paying, low-skilled jobs may not have the ability to move to higher-paying jobs after obtaining permanent residence.
Hou and Bonikowska (2018) used holding temporary work permits as the proxy indicator of pre-immigration work experience in Canada, while Pandey and Townsend (2017) used filing tax as the proxy indicator of previous work experience. Both approaches may underestimate the effect of pre-immigration work experience on earnings and employment, as a sizable proportion of temporary work permit holders did not work or file tax in Canada (Lu and Hou 2019). To see whether the findings of these studies remain applicable to more recent immigrants, updated statistics are provided below. Here, the level of pre-immigration maximum annual earnings is used to measure type of work experience. Since the studies by Hou and Bonikowska (2018) and Pandey and Townsend (2017) both focused on economic immigrants, the following analysis is restricted to economic immigrants as well. Similar analysis is repeated for all prime-age immigrants, and the conclusions remain the same.
Table 1 presents employment incidences and annual earnings of economic immigrants aged 20 to 54 years at landing (2000 to 2005 and 2006 to 2010 cohorts) by level of pre-immigration Canadian earnings in the first full year, 5th year, and 10th year (only for the 2000 to 2005 cohort) after immigration. Among the 2000 to 2005 cohort of prime-age economic immigrants, 90.1% had no pre-immigration Canadian earnings; 3.7%, 4.0% and 2.2% had low, medium and high levels of pre-immigration earnings. Among the 2006 to 2010 cohort, 75.3% had no pre-immigration Canadian earnings; 7.7%, 11.2% and 5.8% had low, medium and high levels of pre-immigration earnings.
The results on the left panel are the observed average, while the adjusted results on the right are based on multivariate model estimates controlling for differences in source region, education level, official language knowledge, age at landing, immigration category, province of residence, and urban size. Generally, the adjusted differences in employment incidences and earnings by level of pre-immigration Canadian earnings are somewhat smaller than the observed differences, but remain substantial even 10 years after immigration.Note 3
In terms of employment incidences, in the first full year after immigration, economic immigrants with medium or high pre-immigration Canadian earnings had a 19 to 20 percentage point (adjusted results) lead over those without pre-immigration earnings in Canada. This gap narrowed to 10 percentage points five years after immigration; and remained large, at 7 percentage points, 10 years after immigration. Economic immigrants with low pre-immigration Canadian earnings also had long-term advantages, although smaller, in employment incidence, over those without pre-immigration Canadian earnings, at 5 and 3 percentage points higher, 5 and 10 years after immigration, respectively.
| Observed | AdjustedTable 1 Note 1 | |||||
|---|---|---|---|---|---|---|
| Years since immigration | Years since immigration | |||||
| 1 | 5 | 10 | 1 | 5 | 10 | |
| percent | ||||||
| Employment incidence | ||||||
| 2000 to 2005 cohort | ||||||
| No pre-immigration Canadian earnings | 68.5 | 77.0 | 78.1 | 69.0 | 77.3 | 78.4 |
| Low pre-immigration Canadian earnings | 86.5 | 84.5 | 84.3 | 84.1 | 82.7 | 81.8 |
| Medium pre-immigration Canadian earnings | 93.9 | 90.3 | 89.2 | 88.5 | 86.9 | 85.9 |
| High pre-immigration Canadian earnings | 96.6 | 93.3 | 90.4 | 88.7 | 87.9 | 85.5 |
| 2006 to 2010 cohort | ||||||
| No pre-immigration Canadian earnings | 67.0 | 76.6 | Note ...: not applicable | 68.6 | 77.6 | Note ...: not applicable |
| Low pre-immigration Canadian earnings | 87.0 | 85.5 | Note ...: not applicable | 85.1 | 84.4 | Note ...: not applicable |
| Medium pre-immigration Canadian earnings | 94.2 | 91.8 | Note ...: not applicable | 88.5 | 87.9 | Note ...: not applicable |
| High pre-immigration Canadian earnings | 97.0 | 93.8 | Note ...: not applicable | 89.4 | 88.5 | Note ...: not applicable |
| 2017 dollars | ||||||
| Annual earnings | ||||||
| 2000 to 2005 cohort | ||||||
| No pre-immigration Canadian earnings | 25,200 | 43,000 | 55,800 | 25,500 | 43,100 | 55,800 |
| Low pre-immigration Canadian earnings | 25,600 | 44,900 | 59,600 | 26,800 | 46,300 | 60,800 |
| Medium pre-immigration Canadian earnings | 33,900 | 47,000 | 57,000 | 35,100 | 50,400 | 62,900 |
| High pre-immigration Canadian earnings | 118,200 | 125,000 | 130,900 | 107,400 | 112,400 | 118,100 |
| 2006 to 2010 cohort | ||||||
| No pre-immigration Canadian earnings | 25,600 | 40,700 | Note ...: not applicable | 26,300 | 41,200 | Note ...: not applicable |
| Low pre-immigration Canadian earnings | 26,200 | 42,600 | Note ...: not applicable | 28,300 | 45,100 | Note ...: not applicable |
| Medium pre-immigration Canadian earnings | 35,100 | 46,200 | Note ...: not applicable | 36,400 | 48,300 | Note ...: not applicable |
| High pre-immigration Canadian earnings | 103,000 | 112,900 | Note ...: not applicable | 92,200 | 100,200 | Note ...: not applicable |
... not applicable
Source: Statistics Canada, The Longitudinal Immigration Database. |
||||||
There was also a clear long-term advantage in earnings among economic immigrants with pre-immigration Canadian earnings relative to those without earnings in Canada before immigration. The advantage was not large for immigrants with low pre-immigration Canadian earnings, but tended to grow over time, from about 5% higher earnings in the first full year after immigration, to 7% in the 5th year, and 9% in the 10th year for the 2000 to 2005 cohort (adjusted results). Immigrants with medium-level pre-immigration Canadian earnings earned 38% more in the first full year after immigration than those without pre-landing earnings, 17% in the 5th year, and 13% in the 10th year (adjusted results for the 2000 to 2005 cohort). Immigrants with high-level pre-immigration Canadian earnings earned 4.2 times that of those without pre-immigration earnings in the first full year, 2.6 times in the 5th year, and 2.1 times in the 10th year after immigration (adjusted results for the 2000 to 2005 cohort). These large gaps may not narrow further after the first 10 years, as the faster growth in earnings from a low starting point among immigrants without pre-immigration Canadian earnings tends to level off after 10 years (Hou and Bonikowska 2018).
Additional analyses on employment of economic immigrants by landing year and level of pre-immigration Canadian earnings show that immigrants with higher pre-immigration Canadian earnings were less affected by the 2008-2009 recession (table not shown). Among economic immigrants without pre-immigration Canadian earnings, the first full-year employment incidence fell by 3 to 4 percentage points between the 2007 landing cohort (pre-recession) and the 2008-to-2009 cohorts. The decrease was smaller (1 to 2 percentage points) among immigrants with low pre-immigration Canadian earnings. For both groups, the recession effect disappeared by the third year after immigration. For immigrants with medium and high pre-immigration Canadian earnings, the employment incidence changed little across the 2007 to 2009 arrival cohorts. Among employed new economic immigrants, average annual earnings decreased similarly across levels of pre-immigration Canadian earnings between the 2007 landing cohort and the 2008 to 2009 cohorts.
Summary
The expansion of two-step immigration selection was the driving force behind recent improvements in immigrants’ initial labour market outcomes. The first-year employment incidence among all entering immigrant men aged 20 to 54 years rose from 81% to 87% over the 2000 to 2016 period, and from 61% to 67% among women. The majority of this increase was associated with the rising share of entering immigrants with medium and high pre-landing Canadian earnings. New immigrants with no pre-landing Canadian earnings had an entry employment incidence well below that of those with previous earnings in Canada as a temporary resident. Similarly, average first full-year earnings among economic immigrant men rose by 23% between the 2000 and 2016 landing cohorts, and by 32% among women. The increase in the share of new immigrants with pre-immigration Canadian earnings accounted for 94% of this increase. The expanding use of temporary foreign workers as a pool from which to select permanent residents—notably those with higher pre-landing Canadian earnings—was more important than any other single factor in accounting for the improvement in immigrant economic outcomes at entry. Furthermore, the 2008-2009 recession had a strong impact on the initial employment levels among economic immigrants without pre-immigration Canadian earnings, but no impact on those with medium or high pre-immigration Canadian earnings.
But does this effect of pre-landing Canadian earnings on initial labour market outcomes last as immigrants spend longer time in Canada? While differences in both employment incidences and earnings between immigrants with and without pre-landing Canadian earnings declined somewhat after five years in Canada, a gap remained. After five years, immigrants with medium and high pre-landing Canadian earnings in particular had higher employment incidences and earnings than their counterparts with no pre-landing Canadian work experience. This finding held in both observed results and after adjusting for differences in immigrant socio-demographic characteristics. Evidence based on immigrants who landed before the mid-2000s shows the earnings advantage of immigrants with pre-immigration Canadian work experience remained 10 years after landing.
It is perhaps not surprising that immigrants with Canadian work experience do better economically immediately after becoming permanent residents than those without such experience. Perhaps it is more useful information for the selection of economic immigrants that even after 10 years in Canada, immigrants entering without previous Canadian work experience tend not to catch up to immigrants who were selected from the temporary foreign workers pool.
References
Crossman, E., F. Hou and G. Picot. 2020. “Two-step immigration selection: A review of advantages and potential risks.” Statistics Canada, to be released.
Hou, F., and A. Bonikowska. 2018. “Selections before the selection: the earnings advantage of host-country work experience before permanent residence.” International Migration Review 52 (3): 695-723.
Hou, F., and E. Crossman, and G. Picot. 2020. “Two-step immigration selection: Recent development in Canada.” Statistics Canada, to be released.
Hou, F. and G. Picot. 2016. “Changing immigrant characteristics and pre-Landing Canadian earnings: Their effect on entry earnings over the 1990s and 2000s.” Canadian Public Policy 42 (3): 308-232.
Lu, Y. and F. Hou. 2019. “Temporary foreign workers in the Canadian labour force: Open versus employer-specific work permits”. Statistics Canada: Economic Insights, no 102.
Pandey, M. and J. Townsend. 2017. “Prior host-country work experience and immigrant labor market outcomes: evidence from Canada.” IZA Journal of Migration 6 (3): 1-22 DOI 10.1186/s40176-016-0075-x.
Statistics Canada. 2019. “Changes in outcomes of immigrants and non-permanent residents, 2017.” The Daily, December 16, 2019.
Yssaad, L. and A. Fields, 2018. "The Canadian immigrant labour market: recent trends from 2006-2017". Statistics Canada, Catalogue no. 71-606-X.
- Date modified: