
Economic Insights
Two-step Immigration Selection: An Analysis of its Expansion in Canada

Archived Content
Information identified as archived is provided for reference, research or recordkeeping purposes. It is not subject to the Government of Canada Web Standards and has not been altered or updated since it was archived. Please "contact us" to request a format other than those available.
Feng Hou, Statistics Canada
Eden Crossman, Immigration, Refugees and Citizenship Canada
Garnett Picot, Refugees and Citizenship Canada
This Economic Insights article documents the expansion of two-step immigration selection in Canada since the early 2000s. Two-step immigration selection refers to the selection of economic immigrants from among temporary foreign workers. The increased transition of a rapidly rising number of temporary foreign workers to permanent residence was made possible through the shifting composition of admission programs towards provincial programs and the Canadian Experience Class, and the growing reliance on temporary foreign workers within each admission program. Among economic principal applicants, the share with pre-landing Canadian work experience increased from 12% for the 2000 landing cohort to 59% for the 2018 landing cohort.
This is the second of five articles on the two-step selection process.Introduction
Canada, like Australia and New Zealand, selects an increasing share of economic immigrants from among temporary foreign workers. In this process, Canadian employers play a major role in recruiting and evaluating temporary foreign workers, while the government decides how many and which temporary foreign workers are eligible for admission as permanent residents, based on a set of criteria. As a previous review article noted, this two-step immigration process has many advantages and some potential challenges (Crossman, Hou and Picot 2020). The main advantages include a close match between immigrant skills and labour market demand, and improved labour market outcomes of immigrants. The key challenges are for the government to ensure temporary foreign workers are not subject to exploitative work conditions, to mitigate possible negative impact on the domestic workers, to ensure that the process is responding to labour market shortages rather than routine short-term job vacancies driven by turnover, and to maintain a balance between meeting the short-term and long-term needs of the labour market and broader economy.
Since the late 1990s, Canada has created new transition pathways for temporary foreign workers and international students to become permanent residents, such as the Provincial Nominee Programs and the Canadian Experience Class (Hou and Bonikowska 2018; IRCC 2015, 2017). Furthermore, the emphasis on pre-arranged job offers, Canadian work experience, and English or French language ability in the recently implemented Express Entry system of selecting economic immigrants also benefits temporary foreign workers seeking permanent residence (Lu and Hou 2017). These policy changes have prompted rapid expansion of two-step immigration selection.
This article is the second part of a five-part series that provides a broad overview of the increasing importance of temporary foreign workers in the selection and labour market outcomes of new immigrants. While the first article provides an overview of the literature on the advantages and potential risks of two-step immigration selection, this article documents how the two-step selection process expanded in Canada. It describes the increase in the number of temporary foreign workers and their transition to permanent residence. It further examines the role of shifting admission programs of economic immigrants in the expansion of two-step selection in Canada.
The rising number of temporary foreign workers and their transition to permanent residence
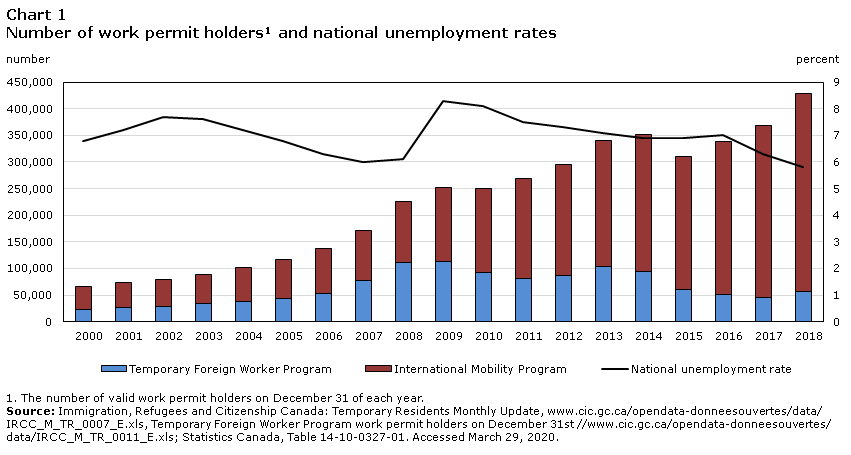
The expansion of two-step immigration selection in Canada has been driven by both increased number of temporary foreign temporary workers and rate of transition to permanent residency. From 2000 to 2018, the number of temporary foreign residents who held work permits in Canada has increased 6 fold, from 66,600 in 2000 to 429,000 in 2018 (Chart 1).Note The majority of temporary foreign workers are admitted through two programs: the Temporary Foreign Worker Program (TFWP) or the International Mobility Program (IMP). The TFWP is designed to fill short‑term labour shortages. TFWP participants hold an employer-specific work permit, which restricts them to a specific employer who has been required to prove an inability to find suitable Canadian workers. The IMP aims to advance Canada’s broad economic and cultural interests (Government of Canada 2016). The majority of IMP participants hold an open work permit, which allows them to work for any employer willing to hire them. In addition to work permit holders, some foreign temporary residents, particularly international students, can work in Canada without a work permit.
Data table for Chart 1
| Temporary Foreign Worker Program | International Mobility Program | National unemployment rate | |
|---|---|---|---|
| number | number | percent | |
| 2000 | 22,480 | 44,145 | 6.8 |
| 2001 | 26,140 | 46,895 | 7.2 |
| 2002 | 29,230 | 50,410 | 7.7 |
| 2003 | 33,970 | 54,330 | 7.6 |
| 2004 | 37,165 | 64,490 | 7.2 |
| 2005 | 43,350 | 73,780 | 6.8 |
| 2006 | 53,950 | 83,605 | 6.3 |
| 2007 | 78,260 | 92,920 | 6.0 |
| 2008 | 110,540 | 115,735 | 6.1 |
| 2009 | 112,500 | 139,860 | 8.3 |
| 2010 | 92,090 | 158,875 | 8.1 |
| 2011 | 81,550 | 187,180 | 7.5 |
| 2012 | 86,530 | 208,650 | 7.3 |
| 2013 | 103,935 | 235,855 | 7.1 |
| 2014 | 93,765 | 257,530 | 6.9 |
| 2015 | 60,010 | 251,025 | 6.9 |
| 2016 | 51,075 | 288,330 | 7.0 |
| 2017 | 46,060 | 321,755 | 6.3 |
| 2018 | 56,080 | 372,905 | 5.8 |
| Source: Immigration, Refugees and Citizenship Canada: Temporary Residents Monthly Update, www.cic.gc.ca/opendata-donneesouvertes/data/IRCC_M_TR_0007_E.xls, Temporary Foreign Worker Program work permit holders on December 31st //www.cic.gc.ca/opendata-donneesouvertes/data/IRCC_M_TR_0011_E.xls; Statistics Canada, Table 14-10-0327-01. Accessed March 29, 2020. | |||
Over the 2000 to 2018 period, the two main temporary foreign worker programs had divergent trends. The number of TFWP participants decreased after reaching a peak during the 2008-2009 recession when the national unemployment rate jumped by 2 percentage points (Chart 1). While the TFWP followed general economic conditions in most of the study period, the number of IMP participants increased steadily regardless of changes in overall economic conditions. By 2018, the number of IMP participants reached 6 times higher than that of TFWP participants.
Not all work permit holders actually worked in Canada in any given year. Some permit holders may leave Canada shortly after arriving Canada without having held a job. Others may have either not looked for a job or not been able to find a job, particularly those participating in the International Exchange Canada (IEC) program.Note It is also possible some permit holders worked in Canada but were not issued a T4 Canadian tax form (e.g., if they were paid directly by firm headquarters located outside Canada) (Lu and Hou 2019). Using the receipt of T4 earnings as a proxy measure of engagement in the Canadian labour market, Lu and Hou (2019) found that in 2016, 61% of open work permit holders (who comprised the majority of IMP participants) had T4 earnings, while 44% of high‑skill employer-specific work permit holders and 85% of low‑skill employer-specific work permit holders had T4 earnings.
While their number is rising rapidly, an increasing share of temporary foreign workers have made the transition to permanent residence. Estimates by Lu and Hou (2017) and Prokopenko and Hou (2018) showed that the share of temporary foreign workersNote who obtained permanent residency status by the 5th year after their initial arrival (i.e. the five year cumulative transition rate) increased from 9% for the 1995-1999 arrival cohort, to 14% for the 2000-2004 cohort, and again to 22% for the 2005-2009 cohort. Updated analyses using a more inclusive definition of first-time temporary foreign workersNote showed the 10-year cumulative transition rate increased from 30% for the 2001 cohort to 39% for the 2006 cohort.Note Thus, among those who obtained their first work permits in 2006, over one third had become permanent residents 10 years later.
Results from the 1995-1999 and 2000-2004 cohorts, for which available data points are longer than 10 years, show cumulative transition rates increased little after 10 years. Generally the likelihood of making a transition to permanent residency accelerates in the second year after obtaining the first work permit, but starts to level off after the 5th year, and changes little after 10 years. It remains to be seen whether more recent cohorts will follow these patterns (Lu and Hou 2017; Prokopenko and Hou 2018).
The cumulative transition rates vary considerably by temporary foreign worker permit type. For instance, among the 2006 cohort, the 10 year transition rate reached 51% for low-skill employer‑specific work permit holders, 47% for open work permit holders, but only 20% for high-skill employer-specific work permit holders. The main reason for the high transition rate among low‑skill employer-specific work permit holders is that for the 2006 (or earlier) cohort, most came under the Live-in Caregiver program which allows participants to apply for permanent residency after having worked as caregivers in their clients’ home in Canada for two years (Lu and Hou 2017).Note High-skill employer-specific work permit holders have more pathways to seek permanent residency, but they may not be highly motivated to do so because their skills are sought after internationally (Ci, Hou and Morissette 2018; Prokopenko and Hou 2018). Open work permit holders are a mixed group, and their work permits do not contain information on skill level (Lu and Hou 2019).
It is important to note that the relatively high transition rate among low-skilled temporary foreign workers does not mean they have a high share among those who transition to permanent residents. For instance, for the 2006 cohort of new temporary foreign workers, only 18% held low‑skilled work permits. Among those who had become permanent residents 10 years later, only 23% were low-skilled temporary foreign workers.Note An alternative measure of the skill distribution among temporary foreign workers who become permanent residents is their level of pre-landing Canadian earnings. Among economic immigrant principal applicants who landed in 2018, only 10% had low pre-immigration annual earnings ($20,000 or less in 2017 dollars), while the shares with medium ($20,000 to $50,000) and high earnings (over $50,000) were 59% and 31% respectively (see Table 2).
Shifting immigrant categories and the expansion of two-step immigration selection
The expansion of the two-step immigration selection was driven in part by significant changes in the types of programs used to select economic immigrants. Until the late 1990s, the Canadian Federal Skilled Worker Program (FSWP) was the primary stream within the economic immigration category. In an effort to improve the ability of the immigration system to respond to regional and sectoral skill shortages, the Government of Canada introduced a number of new programs, notably the Provincial Nominee Programs (PNP) in 1998, and the Canadian Experience Class (CEC) in 2008 (Ferrer, Picot and Riddell 2014; Hou and Picot 2016; IRCC 2015, 2017b). The province of Quebec has had its own provincial immigration program, the Quebec Skilled Workers Program (QSWP), since 1991.
These programs select permanent residents based on their potential ability to do well in the labour market, but they are administered differently and have different selection criteria. The PNPs are jointly administered by the federal and provincial governments. Provinces and territories nominate immigrants for their jurisdictions. The nominees are then assessed by the federal immigration department based on federal admissibility criteria. The CEC was introduced to help attract and retain highly skilled workers and international graduates who had demonstrated their ability to integrate into the Canadian labour market (IRCC 2015). The CEC provides a direct pathway to permanent residency for highly skilled workers and international graduates who have at least one year of skilled Canadian work experience (Alboim and Cohl 2012; IRCC 2015).
Over the past several years, the PNP and CEC programs have grown significantly while the proportion of immigrants entering through the FSWP declined. By 2018, FSWP entrants represented just 20% of all economic immigrants entering Canada while provincial programs (PNPs and Quebec admissions) and the CEC had increased to 50% and 15% respectively (IRCC nd.). The change in the admission categories was particularly large among economic class principal applicants. For these immigrants, the FSWP went from being the dominant selection program in 2000 (accounting for 78% of economic principal applicants) to being smaller than the provincial programs in 2018 (accounting for less than 30%) (Chart 2).

Data table for Chart 2
| Federal skilled worker program | Provincial programs | Canadian experience class | Other federal programs | |
|---|---|---|---|---|
| percent | ||||
| 2000 | 78.041 | 13.698 | Note ...: not applicable | 8.261 |
| 2001 | 76.190 | 16.561 | Note ...: not applicable | 7.249 |
| 2002 | 72.432 | 21.074 | Note ...: not applicable | 6.494 |
| 2003 | 68.213 | 24.491 | Note ...: not applicable | 7.296 |
| 2004 | 63.693 | 28.498 | Note ...: not applicable | 7.809 |
| 2005 | 64.216 | 27.116 | Note ...: not applicable | 8.668 |
| 2006 | 55.003 | 33.760 | Note ...: not applicable | 11.237 |
| 2007 | 49.304 | 39.975 | Note ...: not applicable | 10.721 |
| 2008 | 45.837 | 38.731 | Note ...: not applicable | 15.432 |
| 2009 | 35.835 | 45.807 | 2.683 | 15.675 |
| 2010 | 38.633 | 42.963 | 3.217 | 15.187 |
| 2011 | 29.995 | 50.464 | 5.947 | 13.593 |
| 2012 | 30.158 | 53.871 | 8.701 | 7.270 |
| 2013 | 27.190 | 54.580 | 6.582 | 11.649 |
| 2014 | 17.070 | 46.478 | 17.675 | 18.777 |
| 2015 | 23.584 | 43.596 | 14.282 | 18.537 |
| 2016 | 24.664 | 48.862 | 13.769 | 12.706 |
| 2017 | 14.364 | 46.579 | 26.422 | 12.635 |
| 2018 | 25.271 | 46.438 | 20.168 | 8.123 |
|
... not applicable Source: Statistics Canada, The Longitudinal Immigration Database. |
||||
The shift toward provincial programs and CEC is significant because they have had a larger share of entering immigrants who were previously temporary foreign workers than has been the case for the FSWP. Accordingly, this redistribution towards the CEC and provincial programs drove up the overall share of economic immigrants with previous Canadian work experience. A second factor also came into play. Within the provincial programs, the share of selected immigrants who were previously temporary foreign workers was increasing over time. In 2000, there was little difference between the FSWP and provincial programs in the share of selected immigrants with pre-immigration Canadian earnings, at 11% and 9% respectively for principal applicants (Table 1). By 2018 however, this share had increased to 62% in the provincial programs, and only around 20% in the FSWP.Note By definition, almost 100% of immigrants selected via the CEC have previous Canadian work experience as this is a requirement for admission.
A simple decomposition demonstrates that the redistribution towards the CEC and provincial programs, combined with the rising tendency of the provincial programs to select immigrants from the temporary foreign worker pool, contributed essentially the entire (98%) increase in the share of economic immigrants with pre-landing Canadian earnings over the 2000 to 2018 period. Among all entering adult economic immigrants, this share increased from 8% in 2000 to 46% in 2018. This increase was observed among both principal applicants and their spouses and dependents, although more noticeably among the principal applicants. By 2018, 59% of economic principal applicants had worked in Canada before landing (up from 12% in 2000), along with 22% of the spouses and dependents (up from 2% in 2000).
| All economic immigrants | Principal applicants | ||||||
|---|---|---|---|---|---|---|---|
| All | Principal applicants | Spouse/ dependant |
Federal skilled workers | Provincial programs | Canadian experience class | Other federal programs | |
| percent | |||||||
| 2000 | 7.8 | 11.5 | 2.1 | 8.7 | 11.2 | Note ...: not applicable | 38.1 |
| 2001 | 7.5 | 11.0 | 2.2 | 8.1 | 11.3 | Note ...: not applicable | 41.0 |
| 2002 | 7.8 | 11.4 | 2.3 | 8.2 | 13.2 | Note ...: not applicable | 41.4 |
| 2003 | 9.0 | 13.0 | 2.7 | 7.8 | 13.8 | Note ...: not applicable | 59.1 |
| 2004 | 10.9 | 15.7 | 4.0 | 11.2 | 14.2 | Note ...: not applicable | 57.6 |
| 2005 | 9.9 | 14.8 | 3.5 | 9.5 | 13.7 | Note ...: not applicable | 57.6 |
| 2006 | 15.7 | 22.6 | 6.0 | 16.8 | 20.9 | Note ...: not applicable | 56.2 |
| 2007 | 18.1 | 25.8 | 7.1 | 20.9 | 22.9 | Note ...: not applicable | 59.2 |
| 2008 | 21.8 | 31.1 | 8.4 | 24.3 | 26.0 | Note ...: not applicable | 63.7 |
| 2009 | 24.8 | 34.6 | 9.8 | 24.3 | 29.9 | 97.7 | 60.9 |
| 2010 | 23.3 | 32.9 | 8.8 | 18.8 | 29.6 | 97.5 | 64.4 |
| 2011 | 23.2 | 32.7 | 8.7 | 14.1 | 29.9 | 97.9 | 55.9 |
| 2012 | 27.9 | 39.4 | 11.0 | 16.3 | 38.3 | 97.3 | 74.8 |
| 2013 | 33.1 | 44.9 | 13.8 | 15.4 | 49.2 | 97.9 | 63.3 |
| 2014 | 44.1 | 57.8 | 19.0 | 24.3 | 46.4 | 98.3 | 78.3 |
| 2015 | 43.5 | 58.6 | 18.4 | 14.2 | 59.1 | 98.3 | 83.4 |
| 2016 | 43.4 | 58.6 | 19.2 | 33.0 | 53.4 | 98.0 | 85.2 |
| 2017 | 52.2 | 67.3 | 23.5 | 22.3 | 56.4 | 97.7 | 94.9 |
| 2018 | 46.3 | 59.0 | 21.8 | 10.7 | 62.2 | 97.2 | 95.7 |
|
... not applicable Source: Statistics Canada, The Longitudinal Immigration Database. |
|||||||
Not only did the share of immigrants who were previously temporary foreign workers increase, but their pre-landing earnings characteristics also changed over the 2000 to 2018 period. The average annual pre-landing Canadian earnings among economic principal applicants who were previously temporary foreign workers increased from $43,600 ($2017) in 2000 to $48,600 in 2018, not a large change in real earnings over almost 20 years. However, this relative stability masked two significant changes. The share with low pre-immigration Canadian earnings (under $20,000 annually) fell from 38% to 10% between 2000 and 2018 (Table 2). While the proportion with high pre-landing earnings (over $50,000) rose from 21% to 31%, their average earnings fell significantly from $129,000 ($2017) to $87,000 over the same period. Thus, both very low earners and very high earners constituted a smaller proportion of temporary foreign workers who made the transition to permanent residency. Over the period, the proportion of economic principal applicants who had middle-level earnings ($20,000 to $50,000) increased from 41% in 2000 to 59% in 2018.
These trends in annual earnings could be related to changes in labour market engagement (i.e., working longer or fewer hours per year), or changes in the wage rate, or both. The Longitudinal Immigration Database (IMDB) does not contain relevant information to separate these effects. The decline in the share of very low earnings workers suggests a reduction in the number of lower skilled workers making the transition, although some of the decline could be due to temporary foreign workers in the IMP in particular simply finding jobs with more hours per year.
Regarding the decline in the annual earnings of high wage earners who were principal applicants, multivariate analysisNote reveals that it was primarily associated with changes in three socio‑demographic characteristics: education, source region, and landing age. Over the mid‑2000s to mid-2010s, the share of these immigrants with a graduate degree (master’s or doctorate) fell (e.g., from 45% in 2005 to 31% in 2014). There were also significant shifts in the source regions of these immigrants. The share of high earners from the United States, Northern and Western Europe decreased from 45% in 2005 to 22% in 2018, while the share from Southern Asia and Southeastern Asia increased from 12% to 37% over the period. The average age at landing among this group of immigrants also decreased, from around 38 years in the mid-2010s to 33 years in 2018. Depending on which years are compared, these three factors accounted for one‑half to two-thirds of the decline in pre-immigration Canadian earnings in the high-earner group. This analysis suggests that among the highly skilled, there was a decline in the share who were very high skilled (i.e. highly educated), and a movement towards individuals from regions that traditionally have lower earnings for reasons related to language, lower returns to their education, and other factors. At the same time, the consequence of a flow of immigrants that are on average younger may be that initial earnings levels after permanent residency is obtained are not as high relative to those immigrants landing at a more mature age, if older age reflects a premium allocated to work experience and is an advantage in short-term labour market outcomes.
Overall these earnings trends suggest relatively little change in the average quality of the temporary foreign workers making the transition to permanent residency, but significant change in the upper and lower tails of the skills distribution.
| Ppercentage distribution | Average earnings | Median earnings | Total average | |||||||
|---|---|---|---|---|---|---|---|---|---|---|
| 0 - <=$20,000 | >$20,000 - <=$50,000 | >$50,000 | 0 - <=$20,000 | >$20,000 - <=$50,000 | >$50,000 | 0 - <=$20,000 | >$20,000 - <=$50,000 | >$50,000 | ||
| percent | 2017 dollars | 2017 dollars | ||||||||
| 2000 | 38.3 | 40.5 | 21.2 | 11,800 | 28,900 | 129,100 | 12,414 | 25,897 | 86,639 | 43,607 |
| 2001 | 37.4 | 40.9 | 21.7 | 11,800 | 28,900 | 131,600 | 12,730 | 25,992 | 88,581 | 44,764 |
| 2002 | 34.7 | 39.2 | 26.0 | 11,500 | 29,300 | 126,600 | 11,997 | 26,544 | 91,269 | 48,433 |
| 2003 | 32.3 | 43.9 | 23.9 | 11,600 | 29,000 | 137,200 | 12,465 | 26,266 | 97,343 | 49,203 |
| 2004 | 30.8 | 40.0 | 29.2 | 11,500 | 29,100 | 142,100 | 12,518 | 26,120 | 99,484 | 56,666 |
| 2005 | 34.2 | 41.4 | 24.4 | 12,200 | 28,600 | 144,300 | 13,690 | 25,826 | 99,083 | 51,202 |
| 2006 | 34.2 | 41.8 | 24.0 | 11,600 | 29,600 | 133,200 | 12,508 | 27,056 | 96,272 | 48,303 |
| 2007 | 31.9 | 42.8 | 25.3 | 11,500 | 30,400 | 126,800 | 12,545 | 28,223 | 91,131 | 48,760 |
| 2008 | 29.8 | 45.8 | 24.4 | 13,100 | 29,900 | 117,300 | 14,703 | 27,340 | 84,431 | 46,250 |
| 2009 | 24.8 | 48.9 | 26.3 | 13,200 | 31,500 | 110,500 | 15,085 | 29,843 | 80,572 | 47,706 |
| 2010 | 22.7 | 50.7 | 26.7 | 13,600 | 31,300 | 107,000 | 15,388 | 29,373 | 79,345 | 47,460 |
| 2011 | 17.1 | 53.7 | 29.1 | 13,500 | 32,300 | 105,600 | 15,245 | 31,123 | 79,990 | 50,430 |
| 2012 | 14.3 | 54.9 | 30.8 | 12,100 | 33,600 | 103,900 | 13,157 | 33,050 | 76,731 | 52,188 |
| 2013 | 13.9 | 56.4 | 29.7 | 12,300 | 33,000 | 99,000 | 13,642 | 32,135 | 74,786 | 49,703 |
| 2014 | 10.4 | 59.0 | 30.7 | 13,300 | 32,400 | 98,900 | 15,233 | 31,515 | 75,809 | 50,800 |
| 2015 | 10.1 | 59.8 | 30.1 | 12,600 | 32,500 | 96,700 | 13,978 | 31,541 | 74,440 | 49,791 |
| 2016 | 9.3 | 55.3 | 35.4 | 12,100 | 33,700 | 94,700 | 13,233 | 33,087 | 74,459 | 53,253 |
| 2017 | 9.4 | 58.3 | 32.3 | 12,500 | 33,700 | 91,100 | 13,747 | 33,072 | 71,645 | 50,230 |
| 2018 | 9.5 | 59.4 | 31.1 | 12,300 | 34,100 | 87,200 | 13,559 | 33,609 | 69,553 | 48,550 |
|
Note: Earnings are rounded to the nearest 100. Source: Statistics Canada, The Longitudinal Immigration Database. |
||||||||||
Summary
The expansion of two-step immigration selection in Canada has been propelled by the rising number of temporary foreign workers and their increased rate of transition to permanent residency. Over the 2000 to 2018 period, the number of temporary foreign workers (those who held valid work permits on December 31) in Canada went up from roughly 60,000 to 429,300 individuals. That said, not all work permit holders have earnings during any given year. There has not been a close correlation between the change in the national unemployment rate and the number of temporary foreign workers present in Canada since the early 2000s, due mostly to the continuing expansion of the International Mobility Program, even though the Temporary Foreign Worker Program followed the general economic conditions over the 2000s and early 2010s. Overall, the changes in the total number of temporary foreign workers have not been corresponding to the labour market demand. Among temporary foreign workers who obtained their first work permits in the early 2000s, over one-third became permanent residents within the subsequent 10 years.
The expansion of two-step selection is evident in the rapidly rising number of economic immigrants with pre-landing Canadian experience. In 2000, 8% of economic immigrants had pre‑landing Canadian earnings; this increased to 46% in 2018. Among principal applicants, the share with pre-landing Canadian earnings increased from 12% to 59%, respectively. This expansion occurred for two reasons: the shift towards provincial programs and the Canadian Experience Class (CEC), programs which both target temporary foreign workers, and an increased share of permanent residents who had previous Canadian earnings within provincial programs. The various admission programs differ considerably with respect to shares of new immigrants who had previously worked in Canada. In 2018 the Federal Skilled Worker Program (FSWP) had the lowest rate of selecting applicants with previous Canadian work experience—11% of those selected had pre-immigration Canadian earnings, compared with 62% in the provincial programs, and 97% among the CEC. These differences are significant because there has been a major shift in admission programs of economic immigrants. Up to the late 1990s, the FSWP was the primary entry stream for economic immigrants, but its share declined to about one-quarter by the mid-2010s. Meanwhile, the provincial programs (plus the Québec admission stream) increased and became the largest entry stream.
The types of temporary foreign workers selected—as indicated by their pre-landing Canadian earnings—also changed over the 2000 to 2018 period. The share with low pre-landing annual earnings fell from 38% to 10% of all economic principal applicants with pre-immigration Canadian earnings. The share with mid-level pre-immigration Canadian earnings rose from 41% to 59%, and the share with high pre-immigration Canadian earnings rose from 21% to 31%, although the average earnings of these high earners declined significantly over the period. Overall these earnings trends suggest relatively little change in the average quality of the temporary foreign workers making the transition to permanent residency, but significant change in the upper and lower tails of the skills distribution.
References
Alboim, N., and K. A. Cohl. 2012.“Shaping the future: Canada's rapidly changing immigration policies”. Maytree Foundation.
Ci, W., F. Hou, and R. Morissette. 2018. “Acquisition of permanent residence by temporary foreign workers in Canada: a panel study of labour market outcomes before and after the status transition.” IZA Journal of Development and Migration 8: 2.
Crossman, E., F. Hou and G. Picot. 2020. “Two-step immigration selection: A review of advantages and potential risks. Statistics Canada, to be released.
Ferrer, A. M., G. Picot and W. C. Riddell, 2014. “New directions in immigration policy: Canada's evolving approach to the selection of economic immigrants”.International Migration Review 48 (3): 846–867.
Government of Canada. 2016. Overhauling the Temporary Foreign Worker Program. Last updated February 9, 2016. Available at: http://www.esdc.gc.ca/en/foreign_workers/employers/overhaul.page (accessed November 15, 2016).
Hou, F., and A. Bonikowska. 2018. “Selections before the selection: the earnings advantage of host-country work experience before permanent residence.” International Migration Review 52 (3): 695-723.
Hou, F. and G. Picot. 2016. “Changing immigrant characteristics and pre-landing Canadian earnings: Their effect on entry earnings over the 1990s and 2000s.” Canadian Public Policy 42 (3): 308-232.
IRCC 2015. Evaluation of the Canadian Experience Class. Evaluation Division, Reference Number: E1-2013.
IRCC 2017. Evaluation of the Provincial Nominee Program. Evaluation Division, Reference Number: E1-2015.
IRCC nd. Canada - Admissions of permanent resident by province/territory of intended destination and immigration category https://open.canada.ca/data/en/dataset/f7e5498e-0ad8-4417-85c9-9b8aff9b9eda; Canada - Admissions of Permanent Residents by Immigration Category, 1980 - Q2 2016 http://www.cic.gc.ca/opendata-donneesouvertes/data/IRCC_PRadmiss_0002_E.xls.
Lu, Y., and F. Hou. 2017. Transition from Temporary Foreign Workers to Permanent Residents, 1990 to 2014. Analytical Studies Branch Research Paper Series, no. 389. Statistics Canada Catalogue no. 11F0019M. Ottawa: Statistics Canada.
Lu, Y. and F. Hou. 2019. “Temporary foreign workers in the Canadian labour force: Open versus employer-specific work permits”. Statistics Canada: Economic Insights, no 102.
Lu, Y. and F. Hou. 2020. “Immigration system, labor market structures, and overeducation of high-skilled immigrants in the United States and Canada.” International Migration Review DOI: 10.1177/0197918319901263.
Prokopenko, E. and F. Hou. 2018. “How temporary are Canada’s temporary foreign workers?” Population and Development Review 44 (2): 257-280.
- Date modified: