
Economic and Social Reports
Recent developments in the Canadian economy: Assessing the economic recovery from COVID-19

Archived Content
Information identified as archived is provided for reference, research or recordkeeping purposes. It is not subject to the Government of Canada Web Standards and has not been altered or updated since it was archived. Please "contact us" to request a format other than those available.
by Sean Clarke and Guy Gellatly
DOI: https://doi.org/10.25318/36280001202100300005-eng
Abstract
This article highlights changes in the pace of the economic recovery as tighter COVID-19 containment measures came into effect in late 2020 and early 2021. It provides an integrated analysis of recent changes in output, household spending, business investment, and international trade. It also draws on new data products that offer insights into the financial conditions facing businesses and households. The final section discusses advance estimates and early data releases for January 2021.
The article is based on data that are publicly available as of March 5, 2021. Detailed information on changes in economic and business conditions by calendar month is available at Canadian Economic News. A new presentation on the evolving impacts of COVID-19 on the economic and social lives of Canadians is available at COVID-19: A one-year update on social and economic impacts.
Authors
Sean Clarke and Guy Gellatly work in the Strategic Analysis, Publications and Training Division, Analytical Studies Branch, at Statistics Canada.
Introduction
Economic activity advanced at a sturdy pace in late 2020 despite the widespread introduction of tighter containment measures in many regions of the country. Real GDP rose 2.3% in the fourth quarter, supported by large changes in business stockpiles, strong momentum in the housing market, and the ongoing recovery in exports. Increased business investment in machinery and equipment and higher government spending also contributed to the headline gain. Economic growth in the fourth quarter exceeded market forecasts, despite a slight decline in household expenditures as consumers spent less on food and accommodation services, clothing and footwear, and new vehicles.
The data on fourth quarter GDP yield new expenditure benchmarks for evaluating different aspects of the recovery. Chart 1 compares economic activity in late 2020 to pre-COVID levels during the final quarter of 2019. Despite stronger-than-expected growth in the fourth quarter, real gross domestic product in late 2020 remained 3.2% below pre-pandemic levels.

Data table for Chart 1
| Percent | |
|---|---|
| Household expenditure |
-4.8 |
| Investment in housing |
14.4 |
| Non-residential business investment |
-13.1 |
| Goods exports |
-3.9 |
| Goods imports |
1.3 |
| Real gross domestic product at market prices |
-3.2 |
| Source: Statistics Canada, Table 36-10-0104-01. | |
Household spending was 4.8% below levels observed in late 2019, as lower outlays on accommodation and food services, transportation, and clothing offset higher spending on food and housing-related products and services.Note While goods exports rose in the fourth quarter, volumes remained nearly 4% below pre-pandemic levels, weighed down by lower shipments of motor vehicles and parts late in the year. In contrast, goods imports in the fourth quarter were 1.3% above levels in late 2019, buoyed by increases in consumer goods and industrial machinery.
Non-residential business investment in late 2020 remained severely impacted by the pandemic. Non-residential capital outlays in the fourth quarter were 13.1% below pre-pandemic levels, as spending on structures, weighed down by lower spending on non-residential buildings, continued to decline late into the year. Total outlays on non-residential structures in the fourth quarter were down almost 18% from levels observed in late 2019, while spending on machinery and equipment, despite strong momentum throughout the second half of 2020, remained 5.2% below. Investment in housing continues to be a key driver of the recovery. Housing outlays in the fourth quarter were over 14% above pre-pandemic levels, as new construction, renovations and resale activity continued to strengthen.Note
| Level during COVID-19 lockdowns (April) | Level in May | Level in June | Level in July | Level in August | Level in September | Level in October | Level in November | Level in December | |
|---|---|---|---|---|---|---|---|---|---|
| index (February 2020=100) | |||||||||
| Real GDP, all industries | 82.2 | 85.9 | 91.2 | 93.5 | 94.4 | 95.1 | 95.8 | 96.6 | 96.7 |
| Mining, quarrying and oil and gas extraction | 86.9 | 87.7 | 83.6 | 85.5 | 83.3 | 86.9 | 87.3 | 90.6 | 93.2 |
| Construction | 76.3 | 89.0 | 96.2 | 94.3 | 95.1 | 94.5 | 96.1 | 95.8 | 96.9 |
| Manufacturing | 72.5 | 78.8 | 89.8 | 93.9 | 95.0 | 95.7 | 95.5 | 97.0 | 95.9 |
| Wholesale trade | 77.7 | 81.8 | 94.5 | 99.2 | 99.3 | 99.0 | 100.6 | 101.5 | 100.3 |
| Retail trade | 71.1 | 82.6 | 99.8 | 100.2 | 100.6 | 101.9 | 101.9 | 103.2 | 99.8 |
| Transportation and warehousing | 68.2 | 69.0 | 75.1 | 79.1 | 78.4 | 79.5 | 80.9 | 81.5 | 82.1 |
| Professional, scientific and technical services | 87.3 | 88.6 | 91.2 | 93.4 | 94.8 | 96.2 | 97.6 | 98.3 | 98.7 |
| Arts, entertainment and cultural services | 42.7 | 39.5 | 41.1 | 45.1 | 49.4 | 50.0 | 51.2 | 50.4 | 49.3 |
| Accommodation and food services | 36.0 | 43.3 | 55.2 | 64.7 | 69.3 | 68.3 | 65.4 | 65.1 | 60.6 |
| Other private-sector services | 62.0 | 70.5 | 77.7 | 84.0 | 86.7 | 88.3 | 88.8 | 88.9 | 88.2 |
| Source: Statistics Canada, table 36-10-0434-01. | |||||||||
Economy-wide output continued to edge higher in December (+0.1%), despite declines in high-contact services that were directly impacted by tighter lockdown measures. Increases in mining and oil sands extraction contributed to higher output at year end. Activity in the oil sands has strengthened since September, rebounding to near pre-pandemic levels. In contrast, output in accommodation and food services fell sharply during the lockdowns in December. With four consecutive declines to end the year, accommodation and food services was at 61% of its pre-pandemic level. Retail trade also posted a sharp decline in December, the first in seven months. Overall, real GDP in December remained 3.3% below levels observed in February 2020.
Several other recent data releases yield key insights into the recovery. The non-residential capital intentions for 2021 offer some preliminary guidance on the extent to which businesses can be expected to ramp up their capital plans after curtailing investment spending in the wake of the initial lockdowns.Note Data on business openings and closures, currently available to November 2020, provide an early assessment on how changes in the severity of containment measures may be impacting start up and shutdown decisions in different sectors.Note The most recent Canadian Survey on Business Conditions provides updated measures of business sentiment as many companies were adapting to lockdown measures in early 2021.Note Lastly, the new experimental estimates of economic well-being for households show the degree to which emergency support programs affected levels of disposable income and saving among households with different income profiles and age characteristics.Note Each of these releases is discussed below.
Private capital intentions remain well below pre-pandemic levels
The non-residential capital intentions for 2021, collected between September 2020 and January 2021, indicate that companies are strengthening their capital plans, but that private spending will remain well below pre-pandemic levels. While private organizations expect to spend 5.6% more on structures and M&E this year than during 2020, anticipated outlays remain 12% below levels reported in 2019, and about 20% below peak levels observed in 2014, prior to the mid-decade collapse in oil prices.
Expected private outlays in 2021, at $159.6 billion, are about $22 billion below levels reported in 2019 (Chart 2). While over 40% of this shortfall reflects lower anticipated spending in Alberta, private intentions in all provinces remain below levels reported prior to the pandemic. Overall, anticipated outlays by private sector organizations account for 60% of total planned expenditures in 2021, down from two-thirds of reported expenditures in 2019, and almost three-quarters of total outlays when levels peaked in 2014.
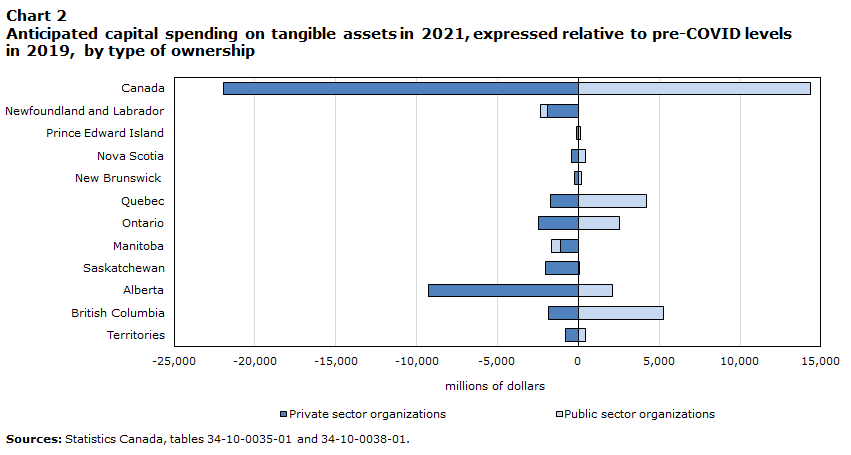
Data table for Chart 2
| Private sector organizations | Public sector organizations | |
|---|---|---|
| millions of dollars | ||
| Canada | -21,933 | 14,339 |
| Newfoundland and Labrador | -1,920 | -394 |
| Prince Edward Island | -118 | 100 |
| Nova Scotia | -406 | 412 |
| New Brunswick | -232 | 175 |
| Quebec | -1,713 | 4,225 |
| Ontario | -2,482 | 2,558 |
| Manitoba | -1,093 | -567 |
| Saskatchewan | -2,019 | 34 |
| Alberta | -9,257 | 2,101 |
| British Columbia | -1,872 | 5,259 |
| Territories | -819 | 437 |
| Sources: Statistics Canada, tables 34-10-0035-01 and 34-10-0038-01. | ||
The 2021 intentions data reinforce basic differences in the near-term outlook across industrial sectors. Overall capital intentions in mining and oil and gas extraction, at $32.9 billion, remain 28% below pre-pandemic levels, while anticipated outlays in manufacturing, at $20.2 billion, are 14% below. While planned spending in 2021 rose in both of these sectors, there is little evidence of a rebound in high-contact services directly impacted by containment measures. Retail intentions are unchanged from 2020, and remain 11.5% below levels observed in 2019. Planned capital spending in accommodation and food services, down 30% during 2020, is expected to fall an additional 27% in 2021 to just over one-half of pre-pandemic levels.
Business closures edge higher as restrictions tightened in late 2020
New monthly data on business openings and closures can be used to evaluate the impacts of changes in containment measures. While business openings have outpaced closures since July 2020, the gap between the two has narrowed as tighter public health restrictions came into effect during the fall. Total closures in November rose by 5.6% while openings edged down 0.6%. While closures remained below pre-pandemic levels, the uptick in November reflected higher closures in most industrial sectors, including high-contact services. As a result, the gradual recovery in the number active businesses slowed to 0.1%, after advancing at a slightly faster pace in September and October.
The openings and closures data underscore the extent to which COVID-19 has resulted in sizable declines in the number of active firms operating in different sectors of the economy. As of November, the total number of active firms was 4.5% below pre-COVID levels. While net declines hovered around the 8% mark in accommodation and food services and in arts, entertainment and recreation, all major industrial sectors have fewer businesses operating in late 2020. Net declines in construction, manufacturing, and mining and oil and gas extraction are in the 4% to 5% range. In retail and wholesale trade, industries where sales quickly rebounded to pre-pandemic levels after the initial lockdowns, net declines in active businesses hover near the 5% mark. These declines, in large part, reflect closures among small businesses.Note
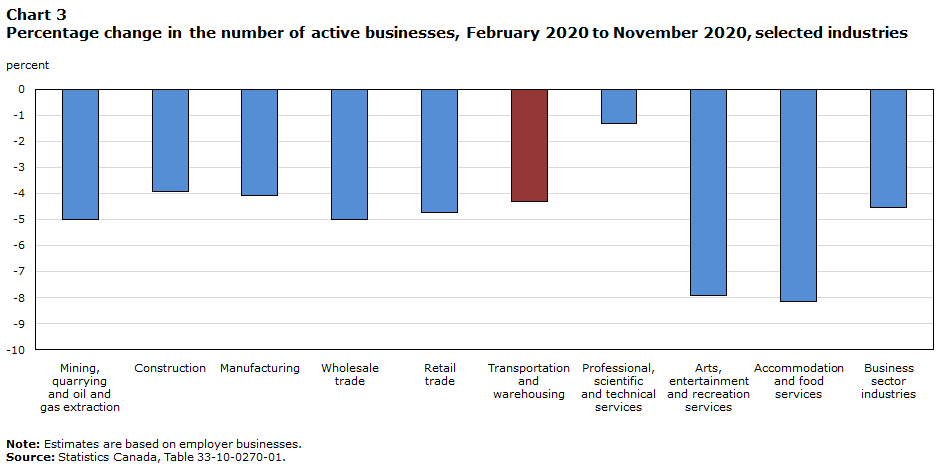
Data table for Chart 3
| Percent | |
|---|---|
| Mining, quarrying and oil and gas extraction | -5.0 |
| Construction | -3.9 |
| Manufacturing | -4.1 |
| Wholesale trade |
-5.0 |
| Retail trade |
-4.7 |
| Transportation and warehousing | -4.3 |
| Professional, scientific and technical services | -1.3 |
| Arts, entertainment and recreation services | -7.9 |
| Accommodation and food services | -8.2 |
| Business sector industries |
-4.5 |
|
Note: Estimates are based on employer businesses. Source: Statistics Canada, Table 33-10-0270-01. |
|
A key issue going forward is to ascertain what these changes in industrial organization, if they become permanent, may ultimately mean for competition and productivity. Recent analysis at the agency has shown that average business productivity rose markedly over the first three quarters of 2000—in part because many companies were adopting new digital technologies and streamlining their business practices, but also because lower paid workers in many sectors were much harder hit by the lockdowns (see COVID-19 in Canada: A One-year Update on Social and Economic Impacts). In accommodation and food services and arts, recreation and entertainment, rising productivity may largely reflect declines in hours worked among these workers. Aggregate business productivity will also increase if labour and capital are transferred disproportionately out of less productive sectors. In addition, the disproportionate impact of the pandemic on smaller businesses may have implications for the amount of competition in certain industries, if large numbers of small firms are unable to recover. The overall impacts of these and other changes in industrial organization due to COVID-19 will be difficult to fully assess until business support programs, which continue to provide a lifeline to many companies, begin to wind down (see COVID-19 in Canada: A One-year Update on Social and Economic Impacts).
Near-term business outlook remains uncertain given lockdown measures
The most recent data from the Canadian Survey on Business Conditions, collected between mid-January and mid-February 2021, highlight high levels of financial uncertainty as companies were adjusting to more stringent containment measures early in 2021. Four in ten businesses reported that they were unable to take on additional debt, a proportion that rose above 50% among businesses in accommodation and food services. Small businesses were less able than large companies to take on more debt, highlighting the continued stress on small companies with thinner margins and more limited financial reserves. When assessing their sales outlook over the near term, three in ten businesses anticipated that sales would decrease over the next three months, while just over one in ten anticipated that sales would rise.
Businesses that responded to the survey also provided guidance on their expected resiliency in the event that revenue and expenditure levels remain largely unchanged. Just over one-half of businesses were unable to report how long they could continue to operate at current revenue and expenditure levels before considering closure or bankruptcy, while 5% indicated that they would be able to operate for less than three months.Note
Government transfers bolstered household incomes and saving
The fourth quarter data on household incomes and saving continue to underscore the extraordinary impacts that emergency support programs have had on economic conditions in the household sector. After a strong rebound in the third quarter, employee compensation (which is comprised mostly of wages and salaries) continued to strengthen in late 2020, effectively recovering to levels observed prior to the pandemic. Government transfers to households in the fourth quarter, despite edging lower during the second half of the year, remained one-third above pre-pandemic levels. As a result, household disposable income was almost 8% higher in late 2020 than during the final quarter of 2019.
Elevated after-tax incomes, coupled with the slowdown consumption late in the year, kept household savings in the double-digit range. The household saving rate was 12.7% in the fourth quarter, down from 13.7% in the third and 27.8% in the second. The sudden rise in government transfers to households, via the emergency response programs, more than offset the sharp declines in employee compensation during the lockdowns.

Data table for Chart 4
| First quarter 2020 | Second quarter 2020 | Third quarter 2020 | |
|---|---|---|---|
| percent | |||
| Highest income quintile | -1.9 | 7.1 | 5.5 |
| Fourth income quintile | -2.6 | 12.9 | 4.6 |
| Third income quintile | -0.8 | 17.0 | 2.2 |
| Second income quintile | -1.2 | 23.9 | -0.8 |
| Lowest income quintile | -3.6 | 33.6 | 2.4 |
| Source: Statistics Canada, National Economic Accounts Division, distributions of household economic accounts, sub-annual experimental estimates. | |||
The new experimental estimates of economic well-being for households show how extensive these income supports were throughout the household sector. Wage and salaries fell across all income quintiles at the onset of the pandemic, with more pronounced losses among low income households. The emergency support measures introduced in the second quarter more than compensated for lost wages and salaries during the lockdowns, irrespective of income level. Although a larger proportion of total COVID-19 support went to middle- and upper-income earners, the impact of benefits were larger for low income households. Those in the bottom quintile saw their disposable income rise by 34%, while incomes in the top quintile grew by 7%.
As containment measures loosened during the third quarter, COVID support programs augmented the broad-based rebound in wages and salaries as disposable incomes continued to expand. Among top earners, disposable income rose by an additional 5.5%, while households in the middle and bottom quintiles saw more modest gains.
While many households benefitted from these programs, their economic impact was felt more by low-income households. Over the first three quarters of 2020, the value of government COVID-19 support measures represented 16.4% of disposable income for the lowest earners, compared with 4.3% among the highest earners.
Early data for 2021 suggest stronger than expected output despite employment losses
Early output signals for January, beginning with the flash estimates for wholesale and manufacturing, and culminating with the +0.5% advance estimate of real GDP, suggest that economy-wide output advanced steadily into the New Year.Note The notable, broad-based surge in merchandise exports in January, two-thirds of which came from higher volumes, reinforces a more positive near-term outlook than that anticipated in late 2020.
January’s trade release warrants some emphasis. Merchandise exports rose 8.1%, supported by higher shipments of aircrafts, consumer goods, energy products, and forestry products. While the increase in aircrafts reflected atypical movements due to fleet retirements, the overall strength in export volumes is consistent with stronger economic conditions in the United States. Canada’s exports to the U.S rose 11.3% to start the year, exceeding February 2020 levels for the first time since the start of the pandemic.
Stronger output signals in January provide some counterweight against headline employment losses totaling 213,000—losses that underscore the heavy toll that more stringent lockdown measures continue to have on high-contact services. Employment in retail trade fell 160,000 in January as lockdown measures in Ontario and Quebec led to sharp reductions in part-time work. Losses in accommodation and food services totaled 75,000, the fourth consecutive monthly decline. These losses have an outsized impact on younger workers. The unemployment rate among 15- to 24-year-olds rose by almost 2 percentage points to 19.7% to start the year, while the participation rate among youth edged below levels last seen in June 2020.
References
Lafrance-Cooke, A. 2021. Changes in Employment by Businesses During the COVID-19 Pandemic: New Insights on the Experimental Series of Monthly Business Openings and Closures. Economic and Social Reports, vol. 1, no. 3. Statistics Canada Catalogue no. 36-28-0001. Ottawa: Statistics Canada.
Mitchell, T. et. al. 2020. Consumer expenditures during COVID-19: An exploratory analysis of the effects of changing consumption patterns on consumer price indexes. Prices Analytical Series. Catalogue no. 62-F1004M. Ottawa: Statistics Canada.
Statistics Canada, 2021. COVID-19 in Canada: A One-year Update on Social and Economic Impacts. A Presentation Series from Statistics Canada About the Economy, Environment and Society. Statistics Canada Catalogue no. 11-631-X. Ottawa: Statistics Canada.
Further reading:
Statistics Canada, 2020. COVID-19 in Canada: A Six-month Update on Social and Economic Impacts. A Presentation Series from Statistics Canada About the Economy, Environment and Society. Statistics Canada Catalogue no. 11-631-X. Ottawa: Statistics Canada.
- Date modified: