
COVID-19 in Canada: A Six-month Update on Social and Economic Impacts

Archived Content
Information identified as archived is provided for reference, research or recordkeeping purposes. It is not subject to the Government of Canada Web Standards and has not been altered or updated since it was archived. Please "contact us" to request a format other than those available.
On October 20, 2020, an enhanced version of this booklet was published. This version contains additional content: a statistical overview of Canada, as well as some information about the agency's communications, dissemination and outreach activities.
Foreword

Anil Arora
Chief Statistician of Canada
The COVID-19 pandemic has had profound impacts on Canada's economy and society. As a purposeful response to a public health crisis, the policies enacted to contain the spread of the virus have resulted in unprecedented disruptions in the social and economic lives of Canadians, changing how they interact, learn, work, and consume. While disorienting in the near term, the longer-term impacts of these changes may prove transformative, accelerating many of the trends towards digitalization and automation and the changes in the quality of work that were underway prior to the pandemic. The crisis has also laid bare many of the social and economic hardships facing marginalized Canadians, raising fundamental questions about the inclusiveness of the recovery.
Responding effectively to a crisis requires timely, credible information. COVID-19 has substantially increased the demand for data and analyses that illuminate the challenges facing Canadians as households, businesses, and governments gravitate toward a new normal. This compendium provides an overview of the initial health, economic and social impacts of COVID-19, based on information collected during the lockdown period of late March and April, and as social and economic restrictions were eased in the late spring and summer months. The compendium will be updated periodically as new information becomes available.
COVID-19 in Canada: A Six-month Update on Social and Economic Impacts
COVID-19 has touched the lives of all Canadians.
Since the pandemic began, Statistics Canada has monitored its impacts to provide information on how COVID-19 has affected diverse communities across the country.
A data portrait tells how Canadians are faring at the pandemic's six-month mark:
- Changes in Canadians' concerns and response to COVID-19 — Canadians' response, shifting health concerns, precautions, generational differences
- Economic impacts — Business outputs, labour, worker security, structural changes, business survival, investment
- Health and Social impacts — Mental health, vulnerable people, school disruptions, parenting
- Justice impacts — Policing, victim services, corrections.
Did you know?
Statistics Canada's website is filled with information about COVID-19!
- Statistics about COVID-19 received over 1.6 million visits in the first six months of the pandemic.
- The COVID-19: A data perspective portal has been visited more than 200,000 times.
- The new publication StatCan COVID-19: Data to Insights for a Better Canada has released over 85 analytical articles on COVID-19.
- Data tables on confirmed COVID-19 cases have been viewed more than 170,000 times.
Canada: An overview in statistics
Population

- Population: 38,005,238 (July 1, 2020)
- Average age: 41.4 years (July 1, 2020)
- Life expectancy at birth: 79.9 years for men and 84.1 years for women (2018)
- Fertility rate: 1.47 births per woman (2019)
- Indigenous population: 1,673,785 (2016)
- Visible minority population: 7,674,580 (2016; as defined by the Employment Equity Act)
Society

- Most common mother tongues: English, French, Chinese languages, Punjabi, Tagalog, Spanish, Arabic, Italian, German and Urdu (2016)
- People employed: 18.5 million (September 2020)
- Unemployment rate: 9.0% (September 2020)
- Median after-tax income of families and unattached Canadians: $61,400 (2018)
- Average weekly earnings: $1,118.40 (July 2020)
- Crime rate: 5,488 per 100,000 population (2018)
Economy

- Gross domestic product: $1,879 billion in July 2020 (chained 2012 dollars at annual rate)
- Retail sales: $52.9 billion (July 2020)
- Exports: $44.9 billion (August 2020)
- Imports: $47.4 billion (August 2020)
- Manufacturing sales: $53.1 billion (July 2020)
- Building permits: $8.1 billion (August 2020)
- Federal government revenue: $335.1 billion (2018)
Changes in Canadians' concerns and response to COVID-19
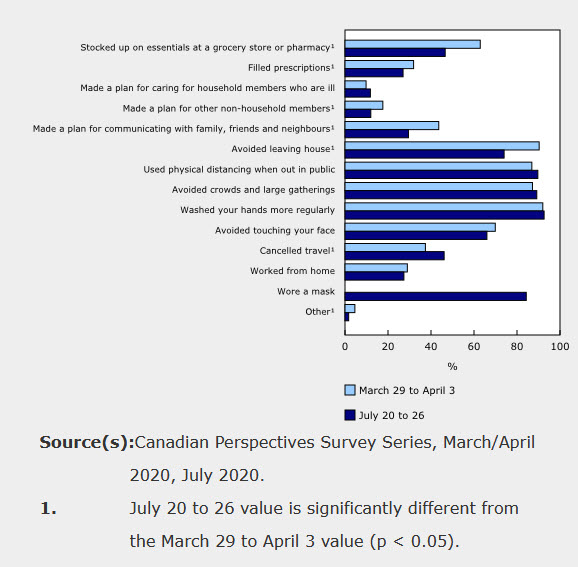
Canadians continue to take precautions for COVID-19
Canadians continue to physically distance, wear masks and take other precautions to reduce cases and avoid overwhelming the health care system.
In July, more than 90% of people said that they would continue to wash their hands more often, and almost all Canadians reported avoiding crowds and large gatherings and keeping a safe distance from others.
- Results were similar at the start of the pandemic.
- Some variations exist between provinces. In a June web panel survey, 90% of respondents in British Columbia and Atlantic Canada said they would avoid crowds and large gatherings, compared with 71% of Quebec respondents.
As restrictions eased, some precautions were less likely to be followed:
- Canadians were less likely to stock up on essentials—47% (July) from 63% (March).
- Canadians were less likely to avoid leaving the house—74% (July) from 90% in (March).
Main precautions taken by Canadians as a result of COVID-19, by period of web panel survey, 2020
Description: Main precautions taken by Canadians as a result of COVID-19, by period of web panel survey, 2020
Source(s): Canadian Perspectives Survey Series, March/April 2020, July 2020.
1. July 20 to 26 value is significantly different from the March 29 to April 3 value (p < 0.05).
Concern about the health and social impacts of COVID-19 has fallen since the start of the pandemic
In July, Canadians were less likely to report being very or extremely anxious about health:
- their own health—27% (July) from 36% (March)
- the health of a household member—41% (July) from 54% (March)
- the health of Canadians—42% (July) from 69% (March).
The decline in health concerns was similar across regions, for immigrants and people born in Canada, as well as for men and women. Older Canadians posted larger declines.
After cases fell in June, Canadians' concerns about the pandemic's health consequences dropped in July. The largest declines were concerns about cases overloading the health system (down 32 percentage points) and about Canadians' health (down 28 percentage points).
Proportion of Canadians who are very or extremely concerned about selected issues, by period of web panel survey, 2020
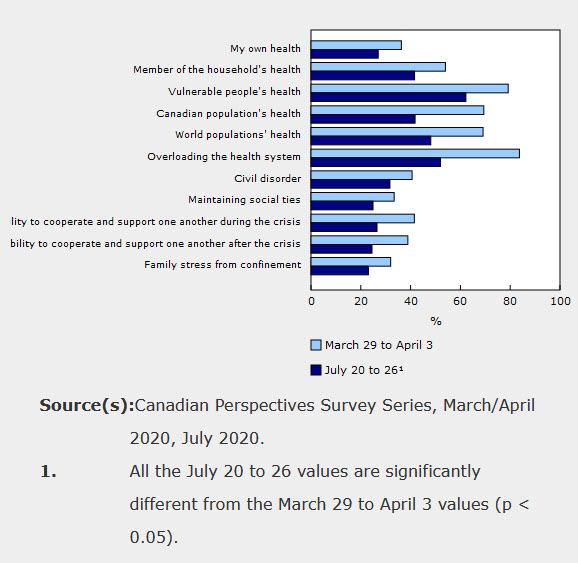
Source(s): Canadian Perspectives Survey Series, March/April 2020, July 2020.
1. All the July 20 to 26 values are significantly different from the March 29 to April 3 values (p < 0.05).
Concerns that many Canadians are at higher risk of severe outcomes
Evidence suggests that most people (74%) who were hospitalized with COVID-19 reported one or more pre-existing chronic conditions.
In Canada, 11 million people (38%) aged 18 and older have at least one health condition that puts them at higher risk of severe COVID-19 outcomes. At higher risk are:
- seniors aged 80 and older (72%)
- people living in low-income households (40%)
- First Nations people (48%) and Métis (41%).
Rates were lower among visible minority groups compared with those who identified as White (40%):
- 25% among Arab/West Asian Canadians
- 26% among East/Southeast Asian Canadians
- 35% among Black Canadians
(Note: rates unadjusted for differences in age structure)
Proportion of those with at least one chronicFootnote 1 condition related to severe symptoms of COVID-19 by age and gender, Canada, 2017-2018 (household population)

Description - Proportion of those with at least one chronic condition related to severe symptoms of COVID-19 by age and gender, Canada, 2017-2018 (household population)
| Males | Females | |
|---|---|---|
| 18 to 39 | 19 | 17 |
| 40 to 59 | 42 | 35 |
| 60 to 79 | 64 | 57 |
| 80 years and older | 72 | 72 |
| Source: Statistics Canada, Canadian Community Health Survey, 2017-2018. | ||
Most Canadians would get tested for COVID-19 if symptomatic or in contact with others who were symptomatic
About 6 in 10 Canadians would get tested if they experienced symptoms (64%) or were in contact with someone who had symptoms or tested positive for COVID-19 (59%).
- Women (67%) are more likely to get tested than men (60%).
- Canadians with a bachelor's degree (69%) are more likely to get tested than those with a high school diploma (61%).
- People living in Atlantic Canada (72%) are more likely to get tested than in Ontario (65%) or British Columbia (55%).
Just over one-third of Canadians (36%) reported that they would get tested if they were not experiencing symptoms but had concerns about infecting others.
Canadians' reasons to get tested for the COVID-19 virus, if testing were widely available

Description - Canadians' reasons to get tested for the COVID-19 virus, if testing were widely available
| Reasons | Percent |
|---|---|
| If I were to experience symptoms | 63.5 |
| If I had been in contact or thought that I had been in contact with people who had symptoms or who had tested positive | 58.9 |
| If I did not have any symptoms but had concerns of infecting others | 35.7 |
| Other reason | 5.0 |
| I don't plan to get tested | 7.3 |
| Note: Categories do not sum to 100% because respondents could select more than one response. Source: Statistics Canada, Canadian Perspectives Survey Series 3 (June 2020). |
|
More than half of Canadians are willing to use a contact tracing application
More than half of Canadians (56%) consider it "somewhat likely" or "very likely" that they would use a contact tracing application.
Although younger Canadians are more likely to socialize in large groups, only 16% said they would be "very likely" to use a contact tracing application, compared with 33% of seniors.
Concerns about privacy and government access to location data are the leading reasons why people would not use a contact tracing application.
People in the Prairie provinces (17%) and Quebec (21%) are less likely to report they would be "very likely" to use a contact tracing application compared with Atlantic Canada (28%), Ontario (28%) and British Columbia (30%).
Reasons why people who were unlikely to use a contact tracing app would not install it, June 2020

Description - Reasons why people who were unlikely to use a contact tracing app would not install it, June 2020
| Reason for not installing contact tracing app | Percent |
|---|---|
| I think it is an invasion of privacy | 64 |
| I don't want the government to have access to my location data | 44 |
| I don't believe enough people will install it | 24 |
| I don't own a smartphone or have a data plan | 17 |
| It would negatively impact my mental health | 15 |
| Other reason | 10 |
| The app would be too much hassle to install | 8 |
| I don't believe I will catch the virus | 4 |
| Source: Canadian Perspectives Survey Series, June 2020. | |
Most Canadians are willing to get a COVID-19 vaccine when available
More than half of Canadians (58%) said that they would very likely get a COVID-19 vaccine when it becomes available.
By contrast, 44% of Canadians are not very likelyFootnote 2 to get a vaccine. Less likely to get a vaccine are
- people younger than 65 years
- those with less than a bachelor's degree
- landed and non-landed immigrants.
The most common reasons for not getting a vaccine were
- lack of confidence in the safety of the vaccine (54%)
- concern about the risks and side effects (52%)
- waiting until it seems safe (35%)
- not considering it necessary (26).
Proportion of Canadians not very likely to get a vaccine, by selected characteristics, June 2020

Description - Proportion of Canadian not very likely* to get a vaccine by selected characteristics, June 2020
Proportion of Canadian not very likely* to get a vaccine by selected characteristics, June 2020
- Grade 13 graduate or less
- 44
- Trades, community college, CEGEP, or university certificate below Backelors level
- 47
- Bachelors degree
- 40
- Above Bachelors degree
- 27
- No children under age 18
- 40
- Children under age 18
- 49
- Born in Canada
- 41
- Landed immigrant
- 48
- Not a landed immigrant
- 52
- British Columbia
- 46
- Prairie regions
- 44
- Ontario
- 41
- Quebec
- 46
- Atlantic
- 32
- 65+
- 30
- 45 to 64
- 45
- 25 to 44
- 48
- 15 to 24
- 42
Source: Statistics Canada, Canadian Perspectives Survey Series 3, June 2020
Did you know?
Since March 17, the agency has held 55 teleconference briefings with media on a number of topics:
- employment
- prices
- manufacturing
- retail
- economic production.
Statistics Canada data were cited in more than 65,000 news articles in the past five months.
Economic impacts
COVID-19 brings unprecedented declines in business outputs
COVID-19 restrictions brought about severe contractions in most industrial sectors, including many service-based industries that typically support the economy during conventional downturns.
The road to recovery will involve major adaptations for businesses and households, which pose challenges for an equitable and resilient recovery.
Real gross domestic product

Description - Real gross domestic product
| Real gross domestic product | |
|---|---|
| 2007 | 0.6 |
| 1.0 | |
| 0.4 | |
| 0.1 | |
| 2008 | 0.1 |
| 0.4 | |
| 0.8 | |
| -1.2 | |
| 2009 | -2.3 |
| -1.1 | |
| 0.4 | |
| 1.2 | |
| 2010 | 1.2 |
| 0.5 | |
| 0.7 | |
| 1.1 | |
| 2011 | 0.8 |
| 0.2 | |
| 1.4 | |
| 0.8 | |
| 2012 | 0.1 |
| 0.3 | |
| 0.1 | |
| 0.2 | |
| 2013 | 0.9 |
| 0.6 | |
| 0.8 | |
| 1.1 | |
| 2014 | 0.2 |
| 0.9 | |
| 1.0 | |
| 0.7 | |
| 2015 | -0.5 |
| -0.3 | |
| 0.4 | |
| 0.1 | |
| 2016 | 0.5 |
| -0.5 | |
| 1.0 | |
| 0.6 | |
| 2017 | 1.2 |
| 1.2 | |
| 0.4 | |
| 0.4 | |
| 2018 | 0.5 |
| 0.4 | |
| 0.6 | |
| 0.2 | |
| 2019 | 0.3 |
| 0.8 | |
| 0.3 | |
| 0.1 | |
| 2020 | -2.1 |
| -11.5 | |
The 2008-2009 recession witnessed sharp reductions in business investement and trade. Annual GDP fell 2.9% in 2009. Economic growth rebounded sharply in 2010 and 2011, supported by investment and trade in energy. Economic strength in Western Canada supported the recovery. Oil price shock: Sharp contractions in investment spending. Alberta's economy contracted by 3.5% in 2015 and 3.6% in 2016. Job creation strengthened from mid-2016 to late 2017 as growth shifted towards Ontario, Quebec and British Columbia. Economic growth moderates in 2018 and 2019 as household spending and business investment slow. The COVID-19 pandemic: Severe declines in household spending, business investment and trade. Notes: Data available on CODR. Quarter over quarter percent changes derived and presented in the graph. Source: Statistics Canada, Table 36-10-0104 |
|
Pandemic brings severe declines in most types of economic activity
With families facing job and income uncertainty, household spending fell by a record 13% during the second quarter of 2020.
Employment earnings fell by almost 9%. Household disposable income rose by almost 11% because of government transfers and income supports.
Higher disposable income, coupled with lower spending, pushed the household savings rate to just over 28%, up from about 8% in the first quarter.
Strong retail numbers in May and June and housing numbers in July indicate consumers are opening their pocketbooks. But questions remain about the long-term impact of the pandemic on mid- and lower-income households. The outlook on business investment remains weak and the trade outlook is mixed, depending largely on developments in the United States.
Historic declines in household spending, business investment, and international trade as the economy contracted by 11.5% in the second quarter

Description - Historic declines in household spending, business investment, and international trade as the economy contracted by 11.5% in the second quarter - Real GDP and selected components
| Q2 2020 | Q1 2020 | Q4 2019 | Q3 2019 | |
|---|---|---|---|---|
| Real gross domestic product at market prices | -11.5 | -2.1 | 0.1 | 0.3 |
| Household spending | -13.1 | -3.2 | 0.4 | 0.5 |
| Business investement | -16.2 | -0.6 | -0.7 | 1.7 |
| Exports | -18.4 | -2.2 | -1.1 | -0.1 |
| Imports | -22.6 | -2.6 | -0.8 | 0 |
| Notes: Data available on CODR. Quarter over quarter percent changes derived and presented in the graph. Source: quarterly GDP, expenditure and income |
||||
As businesses reopen, stark differences are seen across sectors
The COVID-19 business recovery, especially in services, is very uneven. Many professional services are rebounding quickly, while other services struggle to recover. Some sectors, particularly tourism and hospitality, face major logistical challenges. In June, the accommodation and food services sector was at 55% of its pre-pandemic level.
Economic output continues to rebound as more businesses reopen

Description - Economic output continues to rebound as more businesses reopen
| February | March | April | May | June | |
|---|---|---|---|---|---|
| Total | 100 | 93 | 82 | 86 | 91 |
| Goods industries | 100 | 94 | 79 | 85 | 92 |
| Service industries | 100 | 92 | 83 | 86 | 91 |
| Notes: Data available on CODR. Month over month percent changes derived and presented in the graph. Sources: GDP by industry Release Date: August 28, 2020. |
|||||
Real gross domestic product, expressed as a percentage of pre-COVID-19 levels, selected service industries industries

Description - Real gross domestic product, expressed as a percentage of pre-COVID levels, selected service industries industries
| Activity during COVID-19 economic shutdown (April 2020) | Activity during current reference month (June 2020) | |
|---|---|---|
| Service industries | 83 | 91 |
| Finance and insurance | 99 | 101 |
| Professional, scientific and technical services | 87 | 91 |
| Retail trade | 71 | 101 |
| Transportation and warehousing | 68 | 74 |
| Accommodation and food services | 34 | 55 |
| Source: Statistics Canada, table 36-10-0434-01. | ||
Economic output: COVID-19 shutdown leads to historic declines in labour market activity
From February to April, 5.5 million workers were affected by the pandemic shutdown. By August, the number had fallen to 1.8 million.
Labour market indicators:
Unemployment rate:
- 10.2% (August)
- 10.9% (July)
- 13.7% (May)
- 5.6% (February)
Employment rate:
- 58.0% (August)
- 57.3% (July)
- 52.1% (April)
- 61.8% (February)
From February to April, 3 million jobs were lost, including almost 2 million in full-time work.
Employment rose by 1.9 million from April to August. Total employment in August was 5.3% below its pre-pandemic level.
Employment, by type of work

Description - Employment, by type of work
| February | March | April | May | June | July | August | |
|---|---|---|---|---|---|---|---|
| Total | 100.0 | 94.7 | 84.3 | 85.9 | 90.8 | 93.0 | 94.3 |
| Full-time | 100.0 | 97.0 | 87.5 | 88.9 | 92.1 | 92.5 | 93.9 |
| Part-time | 100.0 | 85.0 | 70.4 | 72.4 | 85.4 | 95.0 | 96.1 |
| Source: Statistics Canada, table 14-10-0287-01. | |||||||
Employment is recovering, but steep losses remain in certain sectors
Employment in several heavily affected industries (e.g., construction, manufacturing) has rebounded to more than 90% of pre-COVID-19 levels.
By contrast, overall employment in accommodation and food services remains more than 20% below the level in February.
Net employment losses, February to August, 2020
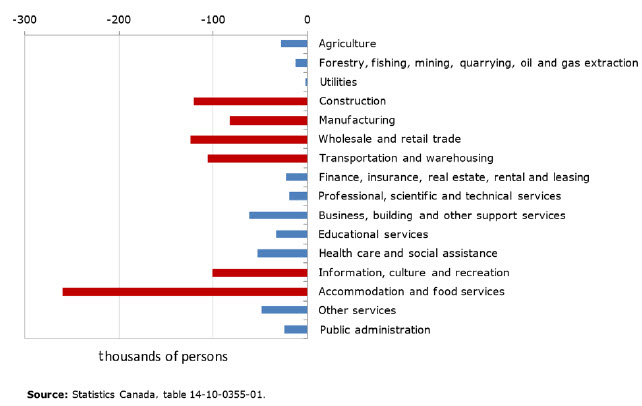
Description - Net employment losses, February to August, 2020
| Thousands of persons | |
|---|---|
| Agriculture | -28 |
| Forestry, fishing, mining, quarrying, oil and gas extraction | -13 |
| Utilities | -2 |
| Construction | -121 |
| Manufacturing | -83 |
| Wholesale and retail trade | -124 |
| Transportation and warehousing | -106 |
| Finance, insurance, real estate, rental and leasing | -23 |
| Professional, scientific and technical services | -19 |
| Business, building and other support services | -62 |
| Educational services | -33 |
| Health care and social assistance | -53 |
| Information, culture and recreation | -101 |
| Accommodation and food services | -260 |
| Other services | -49 |
| Public administration | -24 |
| Source: Statistics Canada table: 14-10-0355-01. | |
Immigrants and visible minority groups face much higher risk of COVID-19-related work stoppages
Recent immigrants were more likely than Canadian-born workers to lose jobs in March and April, mainly because they are often new to the job market and are more likely to work in lower-wage jobs.
Poverty rates in 2015 among working families, by ethnicity of major income earner
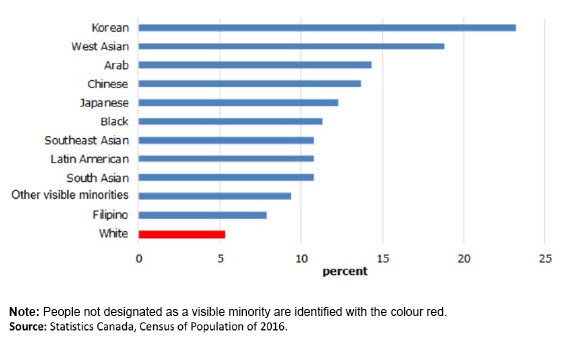
Description - Poverty rates in 2015 among working families, by ethnicity of major income earner
| Percent | |
|---|---|
| White | 5.3 |
| Filipino | 7.9 |
| Other visible minorities | 9.4 |
| South Asian | 10.8 |
| Latin American | 10.8 |
| Southeast Asian | 10.8 |
| Black | 11.3 |
| Japanese | 12.3 |
| Chinese | 13.7 |
| Arab | 14.3 |
| West Asian | 18.8 |
| Korean | 23.2 |
| Note: People not designated as a visible minority are identified with the colour red. Source: Statistics Canada, Census of Population of 2016. |
|
Percentage of workers employed in accommodation and food services and arts, entertainment and recreation, 2016

Description - Percentage of workers employed in accommodation and food services and arts, entertainment and recreation, 2016
| Percent | |
|---|---|
| South Asian | 9.7 |
| Chinese | 12.5 |
| Black | 9.2 |
| Filipino | 15.5 |
| Latin American | 9.6 |
| Arab | 9.2 |
| Southeast Asian | 15.3 |
| West Asian | 10.8 |
| Korean | 20.6 |
| Japanese | 15.8 |
| Other visible minorities | 10.8 |
| Aboriginal peoples | 10.4 |
| White | 8.0 |
| Overall | 8.8 |
| Note: People not designated as a visible minority are identified with the colour red. Source: Statistics Canada, Census of Population of 2016. |
|
Low-wage workers have been affected by COVID-19 shutdowns to a far greater extent than during the 2008/2009 recession
Average monthly layoff rates of employees, by wage decile, 2007, 2009 and 2020Footnote 3

Description - Average monthly layoff rates of employees, by wage decile, 2007, 2009 and 2020
| 2007 | 2009 | 2020 | |
|---|---|---|---|
| Bottom decile | 1.6 | 2.0 | 12.9 |
| 2nd | 1.5 | 1.7 | 11.3 |
| 3rd | 1.4 | 1.8 | 9.0 |
| 4th | 1.2 | 1.6 | 7.1 |
| 5th | 1.1 | 1.5 | 5.8 |
| 6th | 0.9 | 1.5 | 4.5 |
| 7th | 0.8 | 1.2 | 4.1 |
| 8th | 0.8 | 1.2 | 3.5 |
| 9th | 0.8 | 1.2 | 2.9 |
| Top decile | 0.6 | 0.7 | 1.9 |
| Source: Statistics Canada, Labour Force Survey. | |||
Percentage change, from 2019 to 2020, in the number of employees working at least half their usual hours, by 2019 wage decile

Description - Percentage change, from 2019 to 2020, in the number of employees working at least half their usual hours, by 2019 wage decile
| April | July | |
|---|---|---|
| Bottom decile | -65.1 | -39.4 |
| 2 | -52.7 | -20.1 |
| 3 | -43.4 | -11.1 |
| 4 | -24.1 | -0.6 |
| 5 | -34.3 | -12.6 |
| 6 | -25.8 | -9.9 |
| 7 | -16.4 | -3.4 |
| 8 | -9.7 | 2.7 |
| 9 | -0.5 | 8.0 |
| Top decile | 13.7 | 16.0 |
| Source: Statistics Canada, Labour Force Survey. | ||
Youth, less-educated workers, women, recent immigrants and temporary employees have been hit harder during the pandemic
Among temporary employees aged 25 to 54, employment with significant hours of work was 20% lower in August 2020 than in August 2019.
Among permanent employees aged 25 to 54, the gap was 3%.
Employees with jobs that can be done from home have generally fared better during the pandemic.
Percentage change, from 2019 to 2020, in the proportion of population employed and working at least half of their usual hours
Individuals aged 15 to 24 versus others

Description - Individuals aged 15 to 24 versus others
| 15 to 24 | 25 to 44 | All | |
|---|---|---|---|
| February | 101.8 | 100.8 | 101 |
| March | 67.3 | 82.3 | 80 |
| April | 51.7 | 72.8 | 70 |
| May | 57.3 | 77.4 | 75 |
| June | 75.3 | 85.2 | 83 |
| July | 83.2 | 91.3 | 89 |
| August | 85.7 | 93.5 | 91 |
| Source: Statistics Canada, special tabulations, Labour Force Survey. | |||
Women versus men

Description - Women versus men
| men | women | |
|---|---|---|
| February | 100.9 | 100.6 |
| March | 84.9 | 74.8 |
| April | 72.8 | 67.5 |
| May | 77.5 | 71.2 |
| June | 86.0 | 80.4 |
| July | 90.4 | 87.9 |
| August | 92.4 | 89.4 |
| Source: Statistics Canada, special tabulations, Labour Force Survey. | ||
Individuals aged 15 and over, by immigration status

Description - Individuals aged 15 and over, by immigration status
| Recent immigrants | Others | |
|---|---|---|
| February | 101.5 | 100.7 |
| March | 84.1 | 79.9 |
| April | 66.0 | 70.7 |
| May | 70.7 | 74.9 |
| June | 82.1 | 83.5 |
| July | 88.9 | 89.4 |
| August | 91.1 | 91.3 |
| Source: Statistics Canada, special tabulations, Labour Force Survey. | ||
Individuals aged 25 to 54, by education

Description - Individuals aged 25 to 54, by education
| Less than high school | High school | BA+ | |
|---|---|---|---|
| February | 101.6 | 102.2 | 100.1 |
| March | 76.6 | 81.7 | 84.4 |
| April | 58.4 | 65.0 | 82.8 |
| May | 67.7 | 70.7 | 85.4 |
| June | 82.6 | 81.5 | 89.1 |
| July | 91.3 | 86.3 | 94.5 |
| August | 95.6 | 88.6 | 95.7 |
| Source: Statistics Canada, special tabulations, Labour Force Survey. | |||
Structural challenges in heavily affected sectors—transportation
Disruptions to Canadian airlines are unprecedented
Percentages indicate year-over-year changes.

Description - Disruptions to the Canadian airline industry
Disruptions to the Canadian airline industry
The title of the infographic is "Disruptions to the Canadian airline industry"
In brackets underneath the title it says "Percentages indicate year-over-year changes."
The first subheading is "2001 – September 11 events in the United States". The description under this subheading says "A sudden 26% drop in passengers followed by a gradual recovery."
There are five blue arrows in a row pointing to the right. Each arrow contains one month with the year-over-year percentage change for that month. The first arrow is for the month of September and the change is minus 26.0%. The second arrow is for the month of October and the change is minus 18.4%. The third arrow is for the month of November and the change is minus 9.6%. The fourth arrow is for the month of December and the change is minus 3.4%. The fifth arrow is for the month of January 2002 and the change is minus 1.3%.
The second subheading is "2003 – SARS (severe acute respiratory syndrome) outbreak." The description under this subheading says "A gradual decline in passengers, reaching a 26% decrease in May, followed by a gradual recovery."
There are five green arrows in a row pointing to the right. Each arrow contains one month with the year-over-year percentage change for that month. The first arrow is for the month of February and the change is minus 10.1%. The second arrow is for the month of March and the change is minus 12.7%. The third arrow is for the month of April and the change is minus 25.2%.The fourth arrow is for the month of May and the change is minus 26.0%. The fifth arrow is for the month of June and the change is minus 17.1%.
The third subheading is "2020 – COVID-19 pandemic." The description under this subheading says "A steep decline, falling to 97% fewer passengers than the previous year."
There are four red arrows in a row pointing to the right. Each arrow contains one month with the year-over-year percentage change for that month. The first arrow is for the month of March and the change is minus 44.1%. The second arrow is for the month of April and the change is minus 97.0%. The third arrow is for the month of May and the change is minus 96.7%. The fourth arrow is for the month of June and the change is minus 93.9%.
Source(s): Monthly Civil Aviation Survey (5026), table 23-10-0079-01.
Severe declines in public transit as workers adjust to the new normal

Description - Severe declines in public transit as workers adjust to the new normal
| 2019 | 2020 | |
|---|---|---|
| Jan | 159 | 163.4 |
| Feb | 153.5 | 160.9 |
| Mar | 163.5 | 94.8 |
| Apr | 156.5 | 23.4 |
| May | 152.7 | 26.2 |
| Jun | 149.5 | 37.9 |
| Source: Statistics Canada, table 23-10-0521-01. | ||
Structural challenges in heavily affected sectors—commercial real estate
Commercial rents fell 3.1% in the second quarter of 2020, after edging down 0.2% in the first quarter. The declines were widespread across building types and in every province and territory.
As of the end of the second quarter, a small percentage of commercial property owners indicated that they had applied for the Canada Emergency Commercial Rent Assistance program on behalf of their tenants.
The long-term outlook of the commercial real estate market remains in flux. Tenants are assessing their future office space needs as large numbers of corporate employees continue to work from home. This could put further downward pressure on new office lease rates.
The pandemic pulled down commercial rents across Canada

Description - The pandemic pulled down commercial rents across Canada
| Q1 2019 | Q2 2019 | Q3 2019 | Q4 2019 | Q1 2020 | Q2 2020 | |
|---|---|---|---|---|---|---|
| Office buildings | 99.9 | 99.4 | 100.1 | 100.6 | 100.5 | 97.4 |
| Retail buildings | 99.4 | 99.4 | 100.3 | 100.9 | 99.9 | 96.9 |
| Industrial buildings and warehouses | 98.9 | 99.8 | 100.4 | 100.9 | 101.4 | 98.2 |
| Source: Statistics Canada, table 18-10-0260-01. | ||||||
Structural challenges in heavily affected sectors—retail trade
The retail sector rebounded quickly from storefront closures as companies developed or enhanced their online platforms. From February to May 2020, total retail sales fell by 18%, while retail e-commerce sales doubled. By June, the volume of retail activity had surpassed pre-COVID-19 levels, while payroll employment in retail industries was 15% below levels in February.
Retail e-commerce sales soar to an all-time high

Description - Retail e-commerce sales soar to an all-time high
| E-commerce | In-store | |
|---|---|---|
| 2016 | 100 | 100 |
| 110.8 | 99.5 | |
| 105.1 | 96 | |
| 105.8 | 100.1 | |
| 104.3 | 93.6 | |
| 105.6 | 96.9 | |
| 107.8 | 97.6 | |
| 111.1 | 96.4 | |
| 120 | 99.3 | |
| 115.6 | 99.4 | |
| 117.9 | 98.9 | |
| 165 | 103 | |
| 2017 | 140.9 | 103 |
| 136.5 | 103.1 | |
| 142.8 | 103.1 | |
| 150.8 | 105.1 | |
| 147 | 103.2 | |
| 147.8 | 105 | |
| 152.9 | 104.9 | |
| 152.5 | 105 | |
| 151.9 | 105 | |
| 156.1 | 106.9 | |
| 169.7 | 105.7 | |
| 165.7 | 106.5 | |
| 2018 | 165.7 | 105.2 |
| 159.2 | 105.5 | |
| 163.8 | 107.3 | |
| 167.6 | 104.5 | |
| 174.2 | 107.9 | |
| 178.6 | 108.1 | |
| 167.9 | 105.9 | |
| 180.5 | 107.8 | |
| 172 | 108.4 | |
| 188 | 108.4 | |
| 207.4 | 107.5 | |
| 177.8 | 108.1 | |
| 2019 | 189.1 | 107.9 |
| 188.7 | 107.5 | |
| 204 | 108.9 | |
| 203.4 | 107.7 | |
| 217.7 | 108.4 | |
| 232.5 | 107.7 | |
| 225.8 | 108.8 | |
| 223.6 | 109.9 | |
| 228 | 107.6 | |
| 217.7 | 108.4 | |
| 220.2 | 108.9 | |
| 244.5 | 108.3 | |
| 2020 | 213.6 | 110.2 |
| 230.2 | 111.4 | |
| 273.8 | 97.8 | |
| 448.6 | 73 | |
| 459 | 85.9 | |
| Source: Statistics Canada, Census of Population of 2016. | ||
E-commerce sales increase more among non-essential retailers

Description - E-commerce sales increase more among non-essential retailers
| In-store | E-commerce | |
|---|---|---|
| Retail trade | -34.5 | 94.8 |
| Furniture and home furnishings stores | -69.6 | 191.2 |
| General merchandise stores | -15.1 | 170.1 |
| Sporting goods, hobby, book and music stores | -79 | 154.9 |
| Food and beverage stores | 3.3 | 107 |
| Clothing and clothing accessories stores | -84.2 | 83.3 |
| Health and personal care stores | -16.1 | 55.6 |
| Building material and garden equipment and supplies dealers | -15.8 | 40.5 |
| Source: Statistics Canada, Monthly Retail Trade Survey. | ||
Digitalization drives structural change
Employment in the digital economy has outpaced even high growth areas in the service sector. Digitally intensive industries have higher rates of innovation and more high-growth firms than other sectors.
Employment growth in selected sectors since the 2008/2009 recession

Description - Employment growth in selected sectors since the 2008-2009 recession
| 2010 | 2011 | 2012 | 2013 | 2014 | 2015 | 2016 | 2017 | 2018 | 2019 | |
|---|---|---|---|---|---|---|---|---|---|---|
| All industries | 100 | 102 | 103 | 105 | 106 | 107 | 108 | 110 | 113 | 115 |
| Clean technology and environment | 100 | 105 | 107 | 110 | 112 | 119 | 118 | 123 | 125 | |
| Digital economy | 100 | 103 | 105 | 118 | 121 | 125 | 132 | 137 | ||
| Knowledge-based industries | 100 | 103 | 106 | 107 | 109 | 110 | 110 | 114 | 119 | 123 |
| Health care and social assistance | 100 | 101 | 103 | 105 | 107 | 109 | 112 | 114 | 117 | 121 |
| Sources: Statistics Canada, special tabulations, "Measuring digital economic activities in Canada: Initial estimates"; Environmental and Clean Technology Products Economic Account; and Survey of Employment, Payrolls and Hours. | ||||||||||
Percentage of high-growth firms, by industry

Description - Percentage of high-growth firms, by industry
| Percent | |
|---|---|
| Digital Industries | 18.58% |
| Information & cultural industries | 11.87% |
| Agriculture, forestry, fishing & hunting | 11.17% |
| Mining, quarrying, oil & gas extraction & utilities | 10.06% |
| Finance, insurance, real estate, rental & leasing | 9.44% |
| Construction | 9.33% |
| Manufacturing | 9.07% |
| Administrative, support, waste management & remediation | 8.98% |
| Professional, scientific & technical | 7.96% |
| Wholesale trade | 7.23% |
| Transportation & warehousing | 6.84% |
| Arts, entertainment, recreation, accommodation & food | 6.71% |
| Retail trade | 6.20% |
| Other services (except public admin.) | 5.49% |
| Source: Statistics Canada, special tabulation, National Accounts Longitudinal Microdata File. | |
Risks and opportunities associated with digitalization in the workplace are unevenly distributed
Lower-income workers have a greater risk of job automation and less opportunity for telework.
Percentage of workers at high-risk of automation-related job transformation, by percentile of employment income
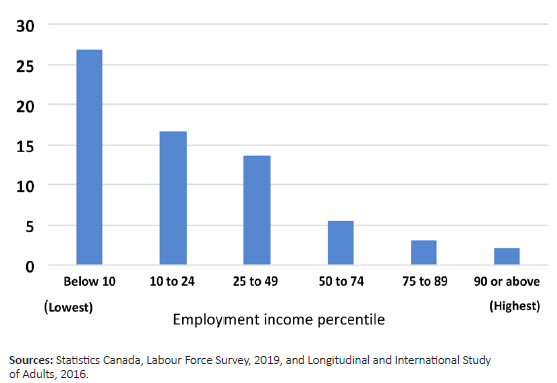
Description - Percentage of workers at high-risk of automation-related job transformation, by percentile of employment income
| Percent | |
|---|---|
| Below 10 | 26.8 |
| 10-24 | 16.6 |
| 25-49 | 13.7 |
| 50-74 | 5.5 |
| 75-89 | 3.1 |
| 90 or above | 2.1 |
| Sources: Statistics Canada, Labour Force Survey, 2019, and Longitudinal and International Study of Adults, 2016. | |
Percentage of adults in jobs that can be done from home, by family earnings decile, dual-earner families, 2019

Description - Percentage of adults in jobs that can be done from home, by family earnings decile, dual-earner families, 2019
| Husbands | Wives | Both | |
|---|---|---|---|
| 1st (Lowest) | 18.7 | 28.6 | 8.1 |
| 2nd | 23.5 | 36.5 | 10.9 |
| 3rd | 27.3 | 45.1 | 14.7 |
| 4th | 28.3 | 49.9 | 16.3 |
| 5th | 33.8 | 55.8 | 21.7 |
| 6th | 38 | 57.1 | 24.6 |
| 7th | 40.5 | 63.2 | 27.6 |
| 8th | 50.7 | 65.9 | 36.9 |
| 9th | 53.1 | 66.9 | 39.1 |
| 10th (Highest) | 66.1 | 74.8 | 53.9 |
| Source: Statistics Canada, Special Tabulations, Labour Force Survey, Occupational Information Network (O*NET). | |||
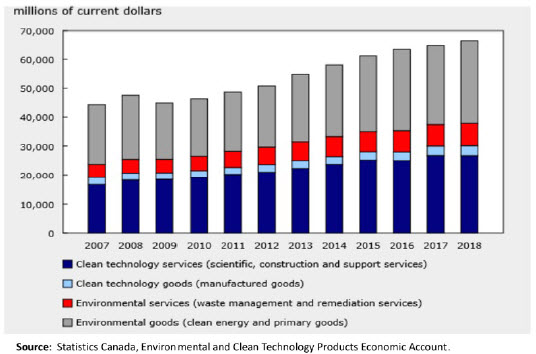
Environmental and clean technology products and services—investing in resilience and growth
Environmental and clean technology (ECT) products and services include clean electricity, clean technology, manufactured goods, scientific services, research and development services, constructions services, and support services.
- Clean electricity production accounts for over 40% of GDP in this sector.
- ECT products and services account for 3.2% of GDP, 1.9 % of Canadian exports and 2.6% of imports.
- ECT activity accounts for about 320,000 jobs.
Share of total jobs attributable to ECT activity

Gross domestic product, ECT activities
Did you know?
Statistics Canada is partnering with universities to expand access to its data and help researchers respond to COVID-19.
The University of British Columbia harnessed the power of microdata to produce the Vancouver School of Economics COVID-19 Risk/Reward Assessment Tool. This tool is helping policy analysts and businesses make informed decisions
The Université du Québec à Montréal, McGill University and Dalhousie University are accessing microdata to evaluate the ongoing economic trade-offs inherent in policy decisions related to the COVID-19 crisis.
Western University is working with Statistics Canada's Labour Force Survey data to examine the impact of COVID-19 on employment by gender.
The University of Toronto is working with Labour Force Survey data and new web panel data to study the economic impacts of the pandemic and the adoption of behaviours to contain the spread of COVID-19 across Canada.
Health and Social impacts
The pandemic has had a major impact on Canadians' quality of life
The pandemic has led to the lowest level of life satisfaction reported by Canadians since the time series started in 2003.
Finances, health and social contacts—three pillars of quality of life—have all been affected by COVID-19.
Average life satisfaction in Canada declined from 8.1 in 2018 to 6.7 in June 2020, a drop of 1.4 points on a scale of 0 to 10. This is about three times the size of the decline associated with being unemployed as opposed to employed (in non-pandemic times).
The share of Canadians rating their life satisfaction as 8 or above fell from 72% in 2018 to 40% in June 2020.
Outcomes are similar in the United Kingdom, where life satisfaction has declined by 1.2 points.
Canadians' ratings of their life satisfaction, 2018 and June 2020

Description - Canadians' ratings of how they feel about their life as a whole right now, response distributions in 2018 and June 2020, Canada
| 2018 | June 2020 | |
|---|---|---|
| 0-2 | 0.8% | 3.9% |
| 3 | 0.6% | 4.9% |
| 4 | 1.1% | 4.9% |
| 5 | 4.3% | 14.3% |
| 6 | 5.1% | 11.9% |
| 7 | 15.8% | 20.6% |
| 8 | 31.6% | 19.5% |
| 9 | 20.1% | 10.1% |
| 10 | 20.6% | 9.9% |
| Sources: 2018 Canadian Community Health Survey and June 2020 Canadian Perspectives Survey Series. | ||
In the face of COVID-19, youth and immigrants experienced largest declines in life satisfaction
Since the pandemic began, average life satisfaction among youth has fallen by 1.8 points, compared with a 1.2 point drop among older Canadians.
Before the pandemic, immigrants and people born in Canada generally reported similar levels of life satisfaction.
After COVID-19 began, average life satisfaction declined more among immigrants from Asia (-1.8 points) and the United States or Europe (-1.7 points) than among people born in Canada (-1.3 points).
Declines in average life satisfaction have been smaller in Atlantic Canada and in Manitoba and Saskatchewan (-1.1 points) and larger in British Columbia (-1.5 points).
Average life satisfaction reported by women and men did not differ significantly before or during the pandemic.
Average life satisfaction, by age group, Canada, 2018 and June 2020

Description - Average life satisfaction, by age group, Canada, 2018 and June 2020
| Age Group | 2018 | June 2020 |
|---|---|---|
| Age 15 to 29 | 8.2 | 6.4 |
| Age 30 to 59 | 8.0 | 6.7 |
| Age 60 or older | 8.1 | 6.9 |
| Note: Error bars represent 95% confidence intervals. Source: 2018 Canadian Community Health Survey and June 2020 Canadian Perspectives Survey Series |
||
Average life satisfaction, by immigration status, Canada 2018 and June 2020

Description - Average life satisfaction, by immigration status, Canada 2018 and June 2020
| Immigration Status | 2018 | June 2020 |
|---|---|---|
| Born in Canada | 8.1 | 6.8 |
| Immigrant-US,Europe, Oceania | 8.1 | 6.4 |
| Immigrant-Asia | 8.0 | 6.2 |
| Immigrant-Other regions | 8.1 | 6.9 |
| Note: Error bars represent 95% confidence intervals. Source: 2018 Canadian Community Health Survey and June 2020 Canadian Perspectives Survey Series |
||
Since the pandemic began, young Canadians have experienced the greatest decline in mental health
Since the COVID-19 pandemic began, fewer Canadians have reported having excellent or very good mental health—55% (July) from 68% (2019 pre-COVID-19).
Prior to COVID-19, youth aged 15 to 24 were the least likely to report excellent or very good mental health. During the pandemic, youth reported the greatest decline in mental health—40% (July) from 60% (pre-COVID-19).
Seniors aged 65 and older are the only group who did not experience declines in mental health since the pandemic began.
Women continue to report lower levels of mental health compared with men (52% vs. 58%).
Proportion of Canadians reporting excellent or very good mental health pre- and post-COVID-19 by age group, Canada, 2019, and March and July 2020*
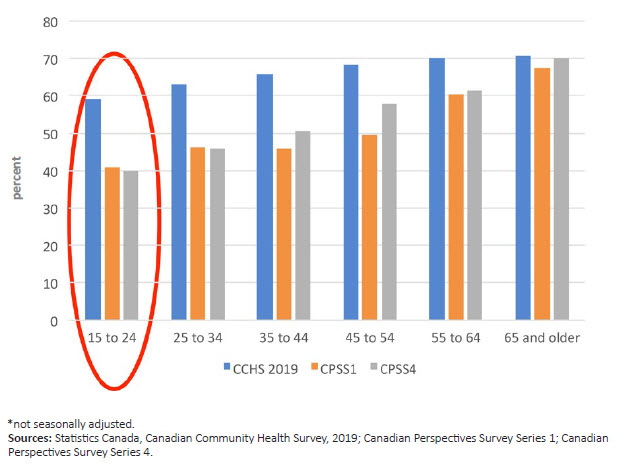
Description - Proportion of Canadians reporting excellent or very good mental health pre and post COVID by age group, Canada, 2019, March and July2020
| Canadian Community Health Survey 2019 | Canadian Perspectives Survey Series1 | Canadian Perspectives Survey Series4 | |
|---|---|---|---|
| 15 to 24 | 59.3 | 41.0 | 39.9 |
| 25 to 34 | 63.3 | 46.2 | 45.8 |
| 35 to 44 | 65.8 | 45.9 | 50.4 |
| 45 to 54 | 68.3 | 49.5 | 58.0 |
| 55 to 64 | 70.2 | 60.6 | 61.5 |
| 65 and older | 70.8 | 67.5 | 70.0 |
| Sources: Statistics Canada, Canadian Community Health Survey, 2019; Canadian Perspectives Survey Series 1; Canadian Perspectives Survey Series 4; *not seasonally adjusted | |||
Visible minority groups are more likely to report poor mental health and impacts on their ability to meet financial obligations
In response to a pandemic crowdsourcing survey, members of visible minority groups (Visible minority groups include South Asian, Chinese, Black, Filipino and Arab) were more likely than White participants to
- report "fair" or "poor" self-rated mental health (28% vs. 23%)
- report symptoms consistent with moderate or severe generalized anxiety disorder (30% vs. 24%).
Visible minority groups were more likely to report that the pandemic had had a "moderate" or "major" impact on their ability to meet their financial obligations compared with White participants (35% vs. 22%). Rates were highest among
- South Asian participants—44%
- Black participants—38%
- Filipino participants—36%.
Proportion of participants by mental health outcome and specific population group designated as a visible minority

Description - Proportion of participants by mental health outcomes and specific population groups designated as visible minorities.
| Fair/poor self-rated mental health | Somewhat/much worse mental health since physical distancing began | Symptoms consistent with moderate/severe generalized anxiety disorder in the two weeks prior to completing the questionnaire | |
|---|---|---|---|
| percent | |||
| White | 22.9 | 52.2 | 24.2 |
| South Asian | 30.3 | 55.3 | 34.6 |
| Chinese | 25.7 | 48.1 | 22.0 |
| Black | 27.9 | 48.1 | 32.0 |
| Filipino | 26.9 | 45.5 | 37.2 |
| Arab | 21.0 | 48.6 | 30.0 |
| Source: Impacts of COVID-19 on Canadians – Your Mental Health (April 24 to May 11, 2020). | |||
Immigrants are disproportionately working in jobs with greater COVID-19 exposure
Immigrants are more likely to be front-line or essential service workers, including workers in long-term care homes where the majority of deaths in Canada have occurred.
The proportion of immigrants employed as nurse aides, orderlies and patient service associates rose from 22% to 36% from 1996 to 2016.
Prior to COVID-19, visible minorities were overrepresented in this sector—34% of workers identified as visible minorities (compared with 21% in other sectors).
This trend has continued during COVID-19. In July, 24% of employed Filipino Canadians and 20% of employed Black Canadians worked in this industry, compared with 14% of all workers
Proportion of immigrants among nurse aides, orderlies and patient service associates, Canada, 1996, 2006 and 2016

Description - Proportion of immigrants among nurse aides, orderlies and patient service associates, Canada, 1996, 2006 and 2016
| Nurse aides, orderlies and patient service associates | All other occupations | |||||
|---|---|---|---|---|---|---|
| 1996 | 2006 | 2016 | 1996 | 2006 | 2016 | |
| percent | ||||||
| Women | 18.5 | 22.7 | 30.6 | 8.5 | 11.4 | 12.6 |
| Men | 3.2 | 3.5 | 5.2 | 10.6 | 9.7 | 11.1 |
| Source: Statistics Canada, Census of Population, 1996, 2006 and 2016. | ||||||
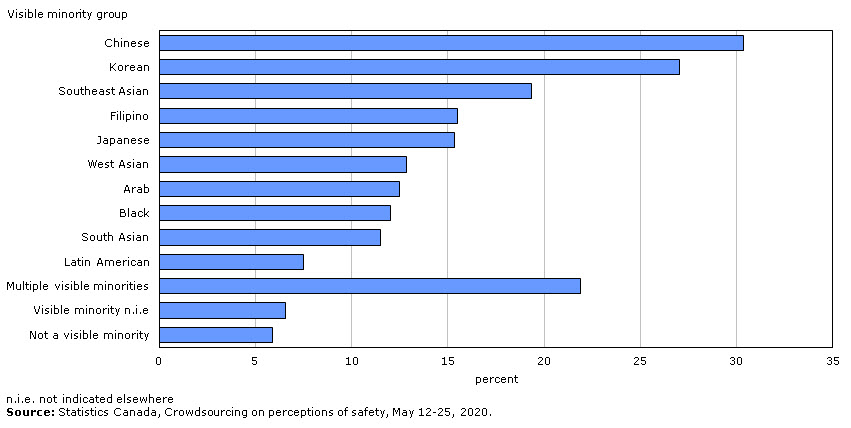
Since COVID-19 began, visible minorities have been more likely to report harassment, attacks and stigma
Added to the health and economic impacts of COVID-19, some people feel afraid of harassment or attacks based on race, ethnicity or skin colour.
Visible minority participants in a crowdsourcing survey were three times more likely to report a perceived increase in the frequency of harassment or attacks since COVID-19 began, compared with other respondents (18% vs. 6%).
The difference was most pronounced among Chinese, Korean and Southeast Asian participants.
In addition, 27% of visible minority participants in a crowdsourcing survey on safety felt somewhat unsafe when walking alone in their neighbourhood after dark, compared with 15% of participants not designated as visible minorities.
Perceived increase in harassment or attacks on the basis of race, ethnicity, or skin colour in neighbourhood since the start of the COVID-19 pandemic, by visible minority group, Canada, 2020
Description - Perceived increase in harassment or attacks on the basis of race, ethnicity, or skin colour in neighbourhood since the start of the COVID-19 pandemic, by visible minority group, Canada, 2020
| No symptoms | Minimal symptoms | Mild symptoms | Moderate symptoms | Severe symptoms | |
|---|---|---|---|---|---|
| percent | |||||
| Recent Immigrants (0 to 5 years since admission (YSA)) | 9 | 28 | 33 | 17 | 14 |
| Established immigrants (6+ YSA) | 16 | 33 | 29 | 12 | 9 |
| Canadian-born | 12 | 31 | 30 | 15 | 11 |
| Source: Statistics Canada, Impacts of COVID-19 on Canadians – Your mental health. | |||||
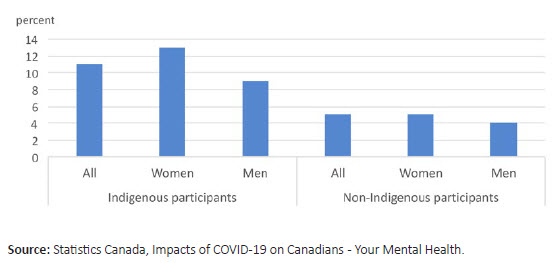
Since the pandemic began, Indigenous people have reported worsening mental health, including increases in anxiety and stress
A relatively high percentage of Indigenous participants reported worsening mental health.
Indigenous women are particularly affected: 46% reported that their days are quite a bit or extremely stressful and 48% reported symptoms consistent with moderate or severe generalized anxiety disorder.
Mental health impacts since the start of the pandemic, Indigenous and non-Indigenous participants by gender, April 24 to May 11, 2020

Description - Mental health impacts since the start of the pandemic, Indigenous and non-Indigenous participants by gender, April 24 to May 11, 2020
| Reporting days quite a bit stressful/extremely stressful | Reporting mental heath as somewhat worse/much worse since physical distancing began | Reporting symptoms of moderate or severe generalized anxiety disorder | ||||
|---|---|---|---|---|---|---|
| Women | Men | Women | Men | Women | Men | |
| Indigenous participants | 46 | 32 | 64 | 54 | 48 | 31 |
| Non-Indigenous participants | 30 | 24 | 57 | 47 | 29 | 21 |
| Source: Impacts of COVID-19 on Canadians - Your Mental Health | ||||||
Since the pandemic began, Indigenous people have reported greater economic impact
Although job losses have been similar, Indigenous people are feeling the financial impacts of COVID-19 more sharply than non-Indigenous people.
Among Indigenous participants, 37% experienced job loss or reduced work hours, compared with 35% of non-Indigenous participants.
Over one-third (36%) of Indigenous participants reported that the COVID-19 pandemic had had an impact on their ability to meet financial obligations or essential needs, compared with 25% of non-Indigenous participants.
Among those who experienced job loss or reduced work hours, 65% of Indigenous participants reported a strong or moderate financial impact, compared with 56% of non-Indigenous participants.
Self-reported employment and financial impact of COVID-19, May 26 to June 8, 2020
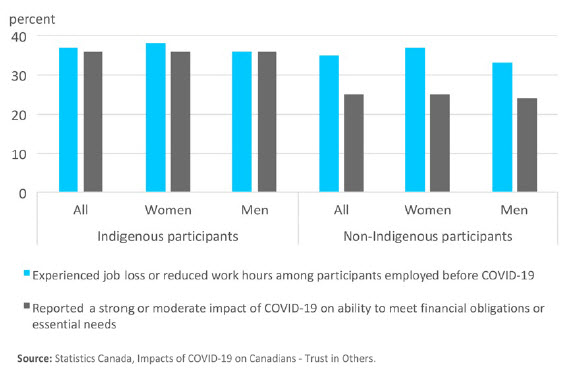
Description - Self-reported employment and financial impact of COVID-19, May 26 to June 8, 2020
| Indigenous participants | Non-Indigenous participants | ||||||
|---|---|---|---|---|---|---|---|
| All | Women | Men | All | Women | Men | ||
| Experienced job loss or reduced work hours among participants employed before COVID-19 | 37 | 38 | 36 | 35 | 37 | 33 | |
| Reported a strong or moderate impact of COVID-19 on ability to meet financial obligations or essential needs | 36 | 36 | 36 | 25 | 25 | 24 | |
| Source: Statistics Canada, Impacts of COVID-19 on Canadians - Trust in Others | |||||||
Since the pandemic began, Indigenous people have reported safety concerns
Among Indigenous participants, 17% reported that they believed crime had increased in their neighbourhood since the start of the pandemic, compared with 11% of non-Indigenous participants.
In addition, 22% of Indigenous participants felt that people in their neighbourhood are being harassed or attacked "often" or "sometimes" because of their race, ethnicity or skin colour. This compares with 11% of non-Indigenous participants.
Among Indigenous participants, 50% xpressed a high level of trust in the federal government to make good decisions about when and how to reopen businesses and public spaces. This compares with 62% of non-Indigenous participants.
Percentage reporting some level of concern about the impact of COVID-19 on violence in their home, April 24 to May 11, 2020
Description - Percentage reporting some level of concern about the impact of COVID-19 on violence in their home, April 24 to May 11, 2020
| Indigenous participants | Non-Indigenous participants | |||||
|---|---|---|---|---|---|---|
| All | Women | Men | All | Women | Men | |
| Percentage reporting some level of concern about the impact of COVID-19 on violence in the home | 11 | 13 | 9 | 5 | 5 | 4 |
| Source: Statistics Canada, Impacts of COVID-19 on Canadians - Your Mental Health. | ||||||
When asked about the impacts of COVID-19,
- 47% of Indigenous women reported being "very" or "extremely" concerned about family stress from confinement.
- 13% of Indigenous women reported some level of concern (somewhat/very/extremely) about violence in their home.
Since the pandemic began, many parents have reported being very or extremely concerned about their children and their families
Concerns for their children:

Description - Concerns for their children
Percentage of participants who were very or extremely concerned about their children’s…
| Percent | |
|---|---|
| Opportunities to socialize with friends | 71 |
| Amount of screen time | 64 |
| Loneliness or isolation | 54 |
| General mental health | 46 |
| School year and academic success | 40 |
| Source(s): Statistics Canada, Impacts of COVID-19 on Canadians – Parenting during the Pandemic, June 2020 | |
Concerns about balancing child care, schooling and work were highest among those with school-aged children aged 4 to 11.

Description - Concerns about balancing child care, schooling and work were highest among those with school aged children aged 4 to 11.
| Percent | |
|---|---|
| Preschool-aged children only | 70 |
| School-aged children aged 4 to 11 | 80 |
| School-aged children aged 12 to 14 | 55 |
| Children of various ages | 76 |
| Source(s): Statistics Canada, Impacts of COVID-19 on Canadians – Parenting during the Pandemic, June 2020 | |
Concerns for their families:

Description - Concerns for their families
Percentage of participants who were very or extremely concerned for their families in terms of…
| Percent | |
|---|---|
| Balancing child care, schooling and work | 74 |
| Managing their child's or children's behaviours, stress levels, anxiety and emotions | 61 |
| Having less patience, raising their voice, or scolding or yelling at their children | 46 |
| Staying connected with family or friends | 43 |
| Getting along and supporting each other | 37 |
| Feeling lonely in their own home | 30 |
| Source(s): Statistics Canada, Impacts of COVID-19 on Canadians – Parenting During the Pandemic, June 2020 | |
Concerns about balancing work and child care: A majority of families require child care in order to work
When child care services reopen, will your child or children attend?
- Preschoolers
- Yes: 56%
- No: 24%
- Young school age (4 to 11)
- Yes: 27%
- No 30%
When asked why they will not send their children to child care…
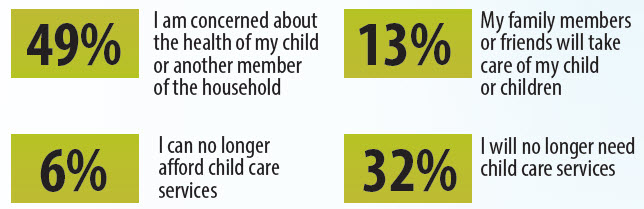
Description - When asked why they will not send their children to child care
| percent | |
|---|---|
| I am concerned about the health of my child or another member of the household | 49 |
| I can no longer afford child care services | 6 |
| My family members or friends will take care of my child or children | 13 |
| I will no longer need child care services | 32 |
| Source(s): Statistics Canada, Impacts of COVID-19 on Canadians – Parenting during the Pandemic, June 2020 | |
Among the 1 in 3 participants who said their children would resume attending, 88% said that they require child care in order to work
As some schools move to online learning, lack of access to the Internet and devices may disadvantage some children in low-income households
While only 1.2% of Canadian households with children do not have access to the Internet at home, the rate is higher among low-income households (4.2%) compared with high-income households (0.2%).
Low-income households are also more likely to have less than one device for each household member (63%) compared with 56% among high-income households.
Percentage of households with children younger than 18 who have less than one Internet-enabled device per household member

Description - Percentage of households with children under age 18 who have less than one internet-enabled device per household member
| Percent | |
|---|---|
| Lowest quartile | 63.0 |
| Second quartile | 60.7 |
| Third quartile | 56.9 |
| Highest quartile | 56.2 |
| Total | 58.4 |
| Source: Statistics Canada, Canadian Internet Use Survey, 2018. | |
Percentage of households with children younger than 18 who have no home Internet

Description - Percentage of households with children under age 18 who have no home internet
| Percent | |
|---|---|
| Lowest quartile | 4.2 |
| Second quartile | 1.9 |
| Third quartile | 0.4 |
| Highest quartile | 0.2 |
| Total | 1.2 |
| Source: Statistics Canada, Canadian Internet Use Survey, 2018. | |
Families of children with disabilities have higher rates of concern about the impacts of COVID-19
A higher proportion of parents of children with disabilities are very or extremely concerned about their children's amount of screen time, loneliness or isolation, general mental health, school year and academic success.
Crowdsourcing participants' concerns for their children aged 0 to 14 years because of the COVID-19 pandemic, by presence of children with disabilities at home

Description - Crowdsourcing participants' concerns for their children aged 0 to 14 years due to the COVID-19 pandemic, by presence of children with disabilities at home
| Children without disabilities | Children with disabilities | |
|---|---|---|
| percent | ||
| General physical health | 21.6 | 27.6 |
| General mental health | 42.8 | 60.4 |
| Loneliness or isolation | 51.6 | 63.0 |
| School year and academic success | 35.6 | 57.6 |
| Opportunities to socialize with friends | 70.2 | 73.8 |
| Amount of screen time | 61.7 | 72.6 |
| Online safety | 22.3 | 34.4 |
| Amount of physical activity | 35.5 | 49.4 |
| Eating junk food or sweets | 20.0 | 28.3 |
| Notes: Percent calculations exclude both "not applicable" and "not stated" responses. The pattern of results was similar when "not applicable" responses were included. Source: Impacts of COVID-19 on Canadians - Parenting During the Pandemic: Data Collection Series (5323). |
||
COVID-19 has disrupted postsecondary studies—more so for students in services, trades and health care
Early in the pandemic, 26% of postsecondary students who responded to a crowdsourcing questionnaire (100,000 participants) indicated that their education had been disrupted.
COVID-19's impact varied by discipline, with students in programs related to services (56%), trades (53%), or health care (41%) hardest hit.
Almost all participants (92%) reported that they had some or all of their courses moved online.
- Among students taking online courses, 7% reported they were unable to complete some or all of their course work.
- Non-completion rates were higher among students in services (10%), trades (13%), and health care (9%) compared with science and education (6%).

Description - For many students, academic work was delayed, postponed or cancelled
| Percentage | |
|---|---|
| Some courses cancelled or postponed | 26% |
| Not able to complete some or all courses | 10% |
| Planned work placement delayed or cancelled | 35% |
| Not able to complete credential as planned | 11% |
| Some or all courses moved online | 92% |
| Source: Impacts of the COVID pandemic on post secondary students | |
Postsecondary students are very concerned about their financial situations
In a postsecondary crowdsourcing survey early in the pandemic, students said that they were very or extremely concerned about their finances—even after the Canada Emergency Student Benefits (CESB) was announced. Concerns included
- using up savings—73% before CESB vs. 61% after
- paying for tuition next term—56% before CESB vs. 48% after
- taking on more student debt—73% before CESB) vs. 61% after CESB.
Factors associated with slower debt repayment include having a larger debt at graduation, being a single parent, reporting a disability and being a landed immigrant or a member of a visible minority group (college graduates only).

Description - Student debt at graduation, by level of study, class of 2015
According to the most recent National Graduates Survey, about half of the postsecondary graduates who completed their education in 2015 had student debt at graduation.
| Level of study | PercentTable note 1 |
|---|---|
| Total | 50 |
| College | 48 |
| Bachelor's | 53 |
| Master's | 46 |
| Doctorate | 36 |
| ProfessionalTable note 2 | 85 |
|
|
| Level of study | Constant dollars | ||||
|---|---|---|---|---|---|
| Total | 17,496 | ||||
| College | 11,467 | ||||
| Bachelor's | 20,004 | ||||
| Master's | 19,735 | ||||
| Doctorate | 25,401 | ||||
| ProfessionalTable note 1 | 60,287 | ||||
|
|||||
The pandemic's effects on youth employment may be felt for many years
The economic shutdown has had a huge impact on young Canadians. In April, just over 38% of young people aged 15 to 24 were working—a drop from 58% in February. By August, the employment rate had partly rebounded to just over 49%.
Recent gains for youth employment have been in part-time work. Full-time work has fallen since April and is down almost one-quarter from pre-pandemic levels, particularly reflecting job losses among young women.
The class of 2020 could lose $23,000 to $44,000 in cumulative earnings over the next five years if the youth unemployment rate reaches 28% in 2020 and $8,000 to $15,000 if the rate is 19%.
Unemployment rate for youth aged 15 to 24, February to August 2020

Description - Unemployment rate, 15 to 24 year-olds, Canada, February to August 2020
| February | March | April | May | June | July | August | |
|---|---|---|---|---|---|---|---|
| Males | 11.7 | 15.6 | 25.9 | 29.5 | 28.1 | 26.7 | 25.6 |
| Females | 8.8 | 18.2 | 28.6 | 29.3 | 26.8 | 21.3 | 20.2 |
| Source: Statistics Canada, Labour Force Survey | |||||||
Since the pandemic, youth have been more likely to increase their use of substances — particularly cannabis
Poor mental health has been shown to be associated with increased use of substances during the pandemic.
Youth aged 15 to 34 continue to be most likely to have increased their use of cannabis during the pandemic—12 %.
Prior to COVID-19, 14% of Canadians reported consuming cannabis—the rate was 24% among youth aged 15 to 24.
Proportion of Canadians reporting an increased use of substances during COVID-19, by age group, July 2020

Description - Proportion of Canadians reporting an increase use of substances during COVID-19 by age group, July 2020
| Cannabis | Alcohol | Tobacco | |
|---|---|---|---|
| 15 to 34 Increased | 12.0 | 16.3 | 5.6 |
| 35 to 54 Increased | 5.5 | 21.7 | 5.1 |
| 55+ Increased | 1.5 | 11.5 | 3.9 |
| Source: Statistics Canada, Canadian Perspectives Survey Series (Canadian Perspectives Survey Series), Wave 4 July 2020. | |||
Did you know?
Statistics Canada continues to help Canadians understand and use statistics!
Webinars help Canadians make the most of Statistics Canada data during the pandemic:
- An Analysis of Recent Issues Faced by the Canadian Pork Industry
- Impact of COVID-19 on Transportation Services Price Indexes
- COVID-19's Impacts on the Wholesale Trade Sector: Sales and Prices
- A Brief Overview of the Canadian Statistical Geospatial Explorer.
Register online to catch the next webinar!
The agency has also released a number of videos to help Canadians use its data:
- Check out the Data Literacy Training videos and the agency's YouTube channel.
Justice impacts
Police calls for service increased, while police-reported crime declined
During the first four months of the COVID-19 pandemic, 17 police services in Canada reported a 16% decrease in some criminal incidents, compared with the same period the year before.
Police reported fewer incidents of:
shoplifting (-6%), residential breaking and entering (-22%), motor vehicle theft (-5%), and assault (-11%), and sexual assaults (-27%), including by a family member.
Calls for service increased 7%:
wellness checks (+12%), domestic disturbances (+12%), and mental health-related calls, such as a person in an emotional crisis (+11%).
| Toronto, Ontario, municipal (35304) | Regina, Saskatchewan, municipal (47603) | Vancouver, British Columbia, municipal (59023) | ||||||||||
|---|---|---|---|---|---|---|---|---|---|---|---|---|
| Actual incidents | Actual incidents | Actual incidents | ||||||||||
| Violations and calls for service | March 2020 | April 2020 | May 2020 | June 2020 | March 2020 | April 2020 | May 2020 | June 2020 | March 2020 | April 2020 | May 2020 | June 2020 |
| Number | ||||||||||||
| Total assaults (levels 1, 2, 3) | 1,220 | 889 | 1,110 | 1,202 | 161 | 127 | 156 | 164 | 414 | 365 | 424 | 398 |
| Total breaking and entering | 718 | 616 | 489 | 482 | 125 | 125 | 159 | 112 | 523 | 559 | 368 | 309 |
| Calls for service, domestic disturbances / disputes | 1,881 | 1,649 | 1,879 | 1,859 | 371 | 386 | 427 | 445 | 514 | 502 | 497 | 506 |
| Source: Statistics Canada, table 35-10-0169-01 Selected police-reported crime and calls for service during the COVID-19 pandemic, March 2020 to June 2020. | ||||||||||||
Changing landscape of vulnerability—victim services adapt to COVID-19
Social isolation, loss of employment and reduced income are factors known to increase the risk of domestic violence, and these conditions have been heightened during the pandemic.
Just over half (54%) of responding victim services reported an increase in the number of victims of domestic violence that they served between mid-March and early July.
Most victim services found ways to adapt to the COVID-19 pandemic to continue serving their clients, such as enhancing cleaning measures, shifting personnel to working from home, or using technology to communicate with clients.
Perceived changes in the number of victims served since the beginning of the COVID-19 pandemic, 2020
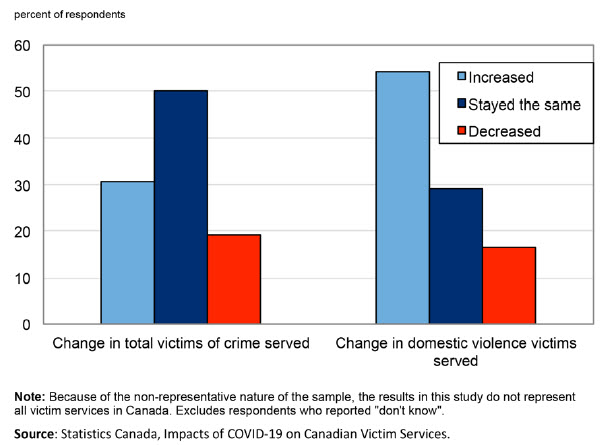
Description - Perceived changes in the number of victims served since the beginning of the COVID-19 pandemic, 2020
| Perceived change by type of client | Increased | Stayed the same | Decreased |
|---|---|---|---|
| percent of respondents | |||
| Change in total victims of crime served | 31 | 50 | 19 |
| Change in domestic violence victims served | 54 | 29 | 17 |
| Note: Because of the non-representative nature of the sample, the results in this study do not represent all victim services in Canada. Excludes respondents who reported "don't know". Source: Statistics Canada, Impacts of COVID-19 on Canadian Victim Services. |
|||
Correctional services reduce custodial populations to mitigate COVID-19 health risks
While balancing public safety concerns, correctional institutions have taken steps to lessen public health risks associated with COVID-19 by reducing the number of people held in custody.
The measure led to an unprecedented 16% drop in the average daily count of adults in custody from February to April. Historically, monthly changes in counts are rarely more than 1%.
By early August, there had been 1,496 COVID-19 tests conducted on the federal custodial population. Close to one-quarter (24%) were positive.
The average count of adults in federal custody fell by 1%, whereas counts were down by one-quarter (25%) for those in provincial or territorial custody.
Total adult custodial population by year (2019 and 2020) and month (February, March and April)

Description - Total adult custodial population by year (2019 and 2020) and month (February, March and April)
| 2019 | 2020 | |
|---|---|---|
| Feburary | 37,967 | 37,976 |
| March | 38, 314 | 36,960 |
| April | 38, 484 | 31,901 |
| Source(s): Statistics Canada, Canadian Centre for Justice and Community Safety Statistics, Adult Corrections Key Indicator Report, Daily article | ||
Did you know?
Statistics Canada is using social media to reach out to Canadians during the pandemic!
Follow us on Facebook, Instagram, LinkedIn, Reddit, Twitter and YouTube.
From April to September 2020, we
- published 4,463 social media posts
- recorded 18,361,193 total impressions
- had 512,209 interactions on the agency's social media platforms
- added 38,689 new followers.
- Date modified: