
Latest Developments in the Canadian Economic Accounts
Inter-generational comparisons of household economic well-being
Summary
This study of data from the Distributions of Household Economic Accounts compares households’ economic well-being from a macro-economic accounts perspective, as measured by net saving and net worth for each generation when the major income earner for a household in one generation reached the same point in the life cycle as the major income earner for a household in another generation. The study finds that while younger generations have higher disposable income and higher consumption expenditure than older generations when they reached the same age, their net saving is relatively similar. As well, younger generations’ economic well-being may be more at risk due to the COVID-19 pandemic since they depend more on employment as a primary source of income, they have higher debt relative to income, and they have less equity in financial and real estate assets from which to draw upon when needed.
Acknowledgements
This paper was prepared by James Gauthier of the National Economic Accounts Division, Statistics Canada.
This work would not have been possible without the invaluable contributions of Amanda Sinclair, Jackie Maisonneuve, Habib Saani, Matthew Hoffarth, Dave Krochmalnek and Brenda Bugge, as well as support from Monique Deschambault, Rob Puchyr, Jennifer Withington and Catherine Van Rompaey.
Introduction
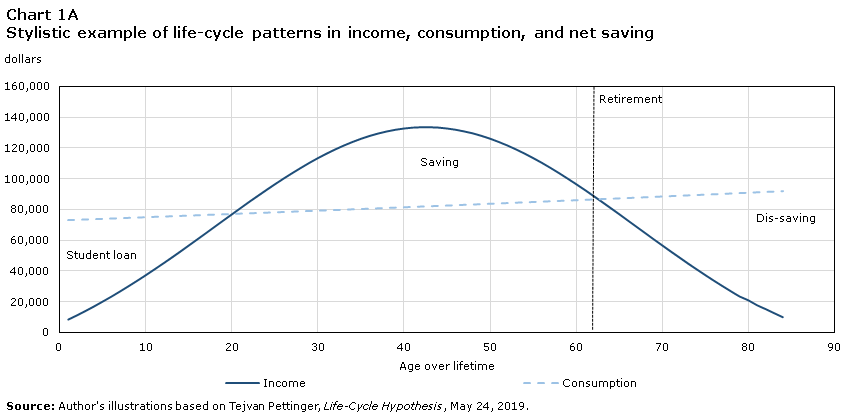
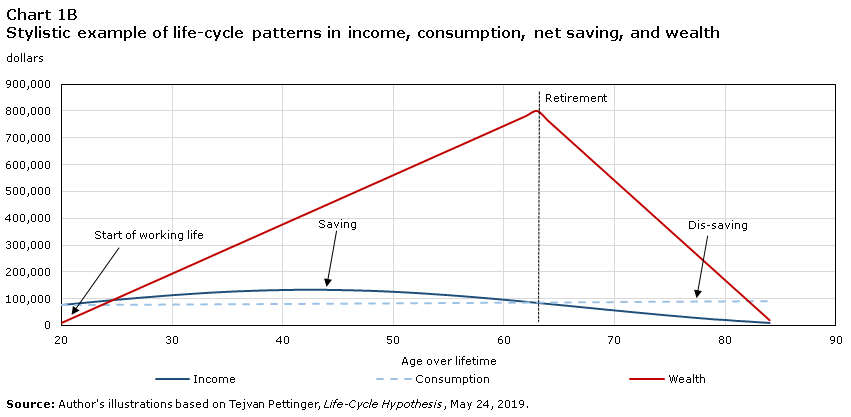
According to the life-cycle hypothesis, households spend and save over their lifetimes based on their expectations of future income and, consequently, their ability to generate wealth (Szenberg, 2008). Chart 1 illustrates that as a major income earner in a household transitions through early adulthood, they increase their consumption and debt holdings, assuming that future gains in their income and wealth will accommodate such spending. During middle age, households save to maintain their expected future consumption as they transition to retirement and draw from their accumulated wealth (Pew Research Center, 2015, and Pettinger, 2019).
Data table for Chart 1A
| Lifetime age | Income | Consumption |
|---|---|---|
| dollars | ||
| 1 | 8,469 | 72,827 |
| 2 | 11,213 | 73,040 |
| 3 | 14,079 | 73,253 |
| 4 | 17,065 | 73,467 |
| 5 | 20,169 | 73,680 |
| 6 | 23,388 | 73,893 |
| 7 | 26,718 | 74,107 |
| 8 | 30,154 | 74,320 |
| 9 | 33,692 | 74,533 |
| 10 | 37,324 | 74,746 |
| 11 | 41,044 | 74,960 |
| 12 | 44,843 | 75,173 |
| 13 | 48,714 | 75,386 |
| 14 | 52,645 | 75,600 |
| 15 | 56,627 | 75,813 |
| 16 | 60,649 | 76,026 |
| 17 | 64,698 | 76,240 |
| 18 | 68,762 | 76,453 |
| 19 | 72,827 | 76,666 |
| 20 | 76,879 | 76,879 |
| 21 | 80,905 | 77,093 |
| 22 | 84,889 | 77,308 |
| 23 | 88,817 | 77,523 |
| 24 | 92,672 | 77,739 |
| 25 | 96,440 | 77,955 |
| 26 | 100,105 | 78,172 |
| 27 | 103,651 | 78,389 |
| 28 | 107,063 | 78,607 |
| 29 | 110,326 | 78,826 |
| 30 | 113,426 | 79,045 |
| 31 | 116,348 | 79,265 |
| 32 | 119,079 | 79,486 |
| 33 | 121,605 | 79,707 |
| 34 | 123,916 | 79,929 |
| 35 | 125,999 | 80,151 |
| 36 | 127,846 | 80,374 |
| 37 | 129,445 | 80,598 |
| 38 | 130,791 | 80,822 |
| 39 | 131,875 | 81,047 |
| 40 | 132,694 | 81,272 |
| 41 | 133,241 | 81,498 |
| 42 | 133,516 | 81,725 |
| 43 | 133,516 | 81,952 |
| 44 | 133,241 | 82,180 |
| 45 | 132,694 | 82,409 |
| 46 | 131,875 | 82,638 |
| 47 | 130,791 | 82,868 |
| 48 | 129,501 | 83,099 |
| 49 | 127,902 | 83,330 |
| 50 | 126,055 | 83,562 |
| 51 | 123,972 | 83,794 |
| 52 | 121,661 | 84,027 |
| 53 | 119,135 | 84,261 |
| 54 | 116,404 | 84,496 |
| 55 | 113,482 | 84,731 |
| 56 | 110,382 | 84,966 |
| 57 | 107,119 | 85,203 |
| 58 | 103,707 | 85,440 |
| 59 | 100,161 | 85,678 |
| 60 | 96,496 | 85,916 |
| 61 | 92,728 | 86,155 |
| 62 | 88,873 | 86,395 |
| 63 | 84,945 | 86,635 |
| 64 | 80,961 | 86,876 |
| 65 | 76,935 | 87,118 |
| 66 | 72,883 | 87,360 |
| 67 | 68,818 | 87,603 |
| 68 | 64,754 | 87,847 |
| 69 | 60,705 | 88,091 |
| 70 | 56,683 | 88,336 |
| 71 | 52,701 | 88,582 |
| 72 | 48,770 | 88,829 |
| 73 | 44,899 | 89,076 |
| 74 | 41,100 | 89,324 |
| 75 | 37,380 | 89,572 |
| 76 | 33,748 | 89,821 |
| 77 | 30,210 | 90,071 |
| 78 | 26,774 | 90,322 |
| 79 | 23,444 | 90,573 |
| 80 | 21,000 | 90,825 |
| 81 | 17,800 | 91,078 |
| 82 | 15,300 | 91,331 |
| 83 | 12,600 | 91,585 |
| 84 | 10,000 | 91,840 |
| Source: Author's illustrations based on Tejvan Pettinger, Life-Cycle Hypothesis, May 24, 2019. | ||
Data table for Chart 1B
| Lifetime age | Income | Consumption | Wealth |
|---|---|---|---|
| dollars | |||
| 20 | 76,879 | 76,879 | 10,000 |
| 21 | 80,905 | 77,093 | 28,372 |
| 22 | 84,889 | 77,308 | 46,744 |
| 23 | 88,817 | 77,523 | 65,116 |
| 24 | 92,672 | 77,739 | 83,488 |
| 25 | 96,440 | 77,955 | 101,860 |
| 26 | 100,105 | 78,172 | 120,233 |
| 27 | 103,651 | 78,389 | 138,605 |
| 28 | 107,063 | 78,607 | 156,977 |
| 29 | 110,326 | 78,826 | 175,349 |
| 30 | 113,426 | 79,045 | 193,721 |
| 31 | 116,348 | 79,265 | 212,093 |
| 32 | 119,079 | 79,486 | 230,465 |
| 33 | 121,605 | 79,707 | 248,837 |
| 34 | 123,916 | 79,929 | 267,209 |
| 35 | 125,999 | 80,151 | 285,581 |
| 36 | 127,846 | 80,374 | 303,953 |
| 37 | 129,445 | 80,598 | 322,326 |
| 38 | 130,791 | 80,822 | 340,698 |
| 39 | 131,875 | 81,047 | 359,070 |
| 40 | 132,694 | 81,272 | 377,442 |
| 41 | 133,241 | 81,498 | 395,814 |
| 42 | 133,516 | 81,725 | 414,186 |
| 43 | 133,516 | 81,952 | 432,558 |
| 44 | 133,241 | 82,180 | 450,930 |
| 45 | 132,694 | 82,409 | 469,302 |
| 46 | 131,875 | 82,638 | 487,674 |
| 47 | 130,791 | 82,868 | 506,047 |
| 48 | 129,501 | 83,099 | 524,419 |
| 49 | 127,902 | 83,330 | 542,791 |
| 50 | 126,055 | 83,562 | 561,163 |
| 51 | 123,972 | 83,794 | 579,535 |
| 52 | 121,661 | 84,027 | 597,907 |
| 53 | 119,135 | 84,261 | 616,279 |
| 54 | 116,404 | 84,496 | 634,651 |
| 55 | 113,482 | 84,731 | 653,023 |
| 56 | 110,382 | 84,966 | 671,395 |
| 57 | 107,119 | 85,203 | 689,767 |
| 58 | 103,707 | 85,440 | 708,140 |
| 59 | 100,161 | 85,678 | 726,512 |
| 60 | 96,496 | 85,916 | 744,884 |
| 61 | 92,728 | 86,155 | 763,256 |
| 62 | 88,873 | 86,395 | 781,628 |
| 63 | 84,945 | 86,635 | 800,000 |
| 64 | 80,961 | 86,876 | 762,857 |
| 65 | 76,935 | 87,118 | 725,714 |
| 66 | 72,883 | 87,360 | 688,571 |
| 67 | 68,818 | 87,603 | 651,429 |
| 68 | 64,754 | 87,847 | 614,286 |
| 69 | 60,705 | 88,091 | 577,143 |
| 70 | 56,683 | 88,336 | 540,000 |
| 71 | 52,701 | 88,582 | 502,857 |
| 72 | 48,770 | 88,829 | 465,714 |
| 73 | 44,899 | 89,076 | 428,571 |
| 74 | 41,100 | 89,324 | 391,429 |
| 75 | 37,380 | 89,572 | 354,286 |
| 76 | 33,748 | 89,821 | 317,143 |
| 77 | 30,210 | 90,071 | 280,000 |
| 78 | 26,774 | 90,322 | 242,857 |
| 79 | 23,444 | 90,573 | 205,714 |
| 80 | 21,000 | 90,825 | 168,571 |
| 81 | 17,800 | 91,078 | 131,429 |
| 82 | 15,300 | 91,331 | 94,286 |
| 83 | 12,600 | 91,585 | 57,143 |
| 84 | 10,000 | 91,840 | 20,000 |
| Source: Author's illustrations based on Tejvan Pettinger, Life-Cycle Hypothesis, May 24, 2019. | |||
The Distributions of Household Economic Accounts (DHEA) include annual estimates by generation of disposable income and consumption expenditure from 1999 to 2019, and of wealth from 2010 to 2019.Note These estimates allow for inter-generational comparisons of households’ economic well-being from a macro-economic perspective, as measured by net saving. Net saving represents the excess funds a household has to increase its net worth. Net worth, or wealth, represents the sum total of a household’s assets less its liabilities.
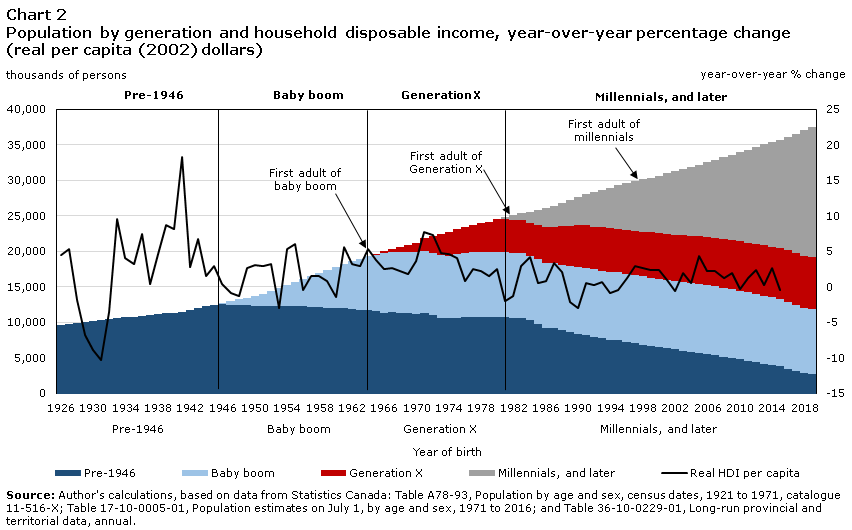
The illustration in chart 2 provides an overview of how the Canadian population has evolved by generation cohort over time from 1926 to 2019, and how the life experiences of households may have been affected by variations in their disposable income during those periods. Over time, real household disposable income per capita has varied along with fluctuations in economic activity, the onset and resolution of global conflicts, as well as the introduction of, and later modifications to government-sponsored social assistance, education, universal health care and old age security.
Data table for Chart 2
| Generation | Birth year | Pre-1946 | Baby boom | Generation X | Millennials, and later | Real HDI per capita |
|---|---|---|---|---|---|---|
| thousands of persons | year-over-year % change | |||||
| Pre-1946 | 1926 | 9,583 | Note ...: not applicable | Note ...: not applicable | Note ...: not applicable | Note ...: not applicable |
| 1927 | 9,742 | Note ...: not applicable | Note ...: not applicable | Note ...: not applicable | 4.5 | |
| 1928 | 9,901 | Note ...: not applicable | Note ...: not applicable | Note ...: not applicable | 5.4 | |
| 1929 | 10,060 | Note ...: not applicable | Note ...: not applicable | Note ...: not applicable | -1.9 | |
| 1930 | 10,219 | Note ...: not applicable | Note ...: not applicable | Note ...: not applicable | -6.7 | |
| 1931 | 10,377 | Note ...: not applicable | Note ...: not applicable | Note ...: not applicable | -8.9 | |
| 1932 | 10,490 | Note ...: not applicable | Note ...: not applicable | Note ...: not applicable | -10.3 | |
| 1933 | 10,603 | Note ...: not applicable | Note ...: not applicable | Note ...: not applicable | -3.5 | |
| 1934 | 10,716 | Note ...: not applicable | Note ...: not applicable | Note ...: not applicable | 9.6 | |
| 1935 | 10,829 | Note ...: not applicable | Note ...: not applicable | Note ...: not applicable | 4.1 | |
| 1936 | 10,942 | Note ...: not applicable | Note ...: not applicable | Note ...: not applicable | 3.2 | |
| 1937 | 11,055 | Note ...: not applicable | Note ...: not applicable | Note ...: not applicable | 7.5 | |
| 1938 | 11,168 | Note ...: not applicable | Note ...: not applicable | Note ...: not applicable | 0.4 | |
| 1939 | 11,281 | Note ...: not applicable | Note ...: not applicable | Note ...: not applicable | 4.6 | |
| 1940 | 11,394 | Note ...: not applicable | Note ...: not applicable | Note ...: not applicable | 8.7 | |
| 1941 | 11,507 | Note ...: not applicable | Note ...: not applicable | Note ...: not applicable | 8.2 | |
| 1942 | 11,757 | Note ...: not applicable | Note ...: not applicable | Note ...: not applicable | 18.3 | |
| 1943 | 12,007 | Note ...: not applicable | Note ...: not applicable | Note ...: not applicable | 2.8 | |
| 1944 | 12,257 | Note ...: not applicable | Note ...: not applicable | Note ...: not applicable | 6.8 | |
| 1945 | 12,507 | Note ...: not applicable | Note ...: not applicable | Note ...: not applicable | 1.6 | |
| Baby boon | 1946 | 12,557 | 200 | Note ...: not applicable | Note ...: not applicable | 3.0 |
| 1947 | 12,507 | 500 | Note ...: not applicable | Note ...: not applicable | 0.4 | |
| 1948 | 12,457 | 800 | Note ...: not applicable | Note ...: not applicable | -0.8 | |
| 1949 | 12,407 | 1,100 | Note ...: not applicable | Note ...: not applicable | -1.2 | |
| 1950 | 12,357 | 1,400 | Note ...: not applicable | Note ...: not applicable | 2.7 | |
| 1951 | 12,287 | 1,722 | Note ...: not applicable | Note ...: not applicable | 3.1 | |
| 1952 | 12,290 | 2,133 | Note ...: not applicable | Note ...: not applicable | 3.0 | |
| 1953 | 12,290 | 2,547 | Note ...: not applicable | Note ...: not applicable | 3.3 | |
| 1954 | 12,290 | 2,961 | Note ...: not applicable | Note ...: not applicable | -2.9 | |
| 1955 | 12,290 | 3,375 | Note ...: not applicable | Note ...: not applicable | 5.4 | |
| 1956 | 12,290 | 3,791 | Note ...: not applicable | Note ...: not applicable | 6.1 | |
| 1957 | 12,200 | 4,312 | Note ...: not applicable | Note ...: not applicable | -0.4 | |
| 1958 | 12,150 | 4,793 | Note ...: not applicable | Note ...: not applicable | 1.6 | |
| 1959 | 12,100 | 5,274 | Note ...: not applicable | Note ...: not applicable | 1.6 | |
| 1960 | 12,080 | 5,725 | Note ...: not applicable | Note ...: not applicable | 0.9 | |
| 1961 | 12,046 | 6,192 | Note ...: not applicable | Note ...: not applicable | -1.4 | |
| 1962 | 11,900 | 6,693 | Note ...: not applicable | Note ...: not applicable | 5.7 | |
| 1963 | 11,800 | 7,148 | Note ...: not applicable | Note ...: not applicable | 3.2 | |
| 1964 | 11,700 | 7,603 | Note ...: not applicable | Note ...: not applicable | 2.9 | |
| 1965 | 11,600 | 7,908 | 150 | Note ...: not applicable | 5.4 | |
| Generation X | 1966 | 11,285 | 8,430 | 300 | Note ...: not applicable | 3.8 |
| 1967 | 11,500 | 8,376 | 450 | Note ...: not applicable | 2.6 | |
| 1968 | 11,400 | 8,537 | 700 | Note ...: not applicable | 2.7 | |
| 1969 | 11,300 | 8,648 | 1,000 | Note ...: not applicable | 2.2 | |
| 1970 | 11,200 | 8,659 | 1,400 | Note ...: not applicable | 1.8 | |
| 1971 | 11,388 | 8,738 | 1,836 | Note ...: not applicable | 3.7 | |
| 1972 | 11,000 | 8,738 | 2,480 | Note ...: not applicable | 7.8 | |
| 1973 | 10,700 | 8,738 | 3,054 | Note ...: not applicable | 7.3 | |
| 1974 | 10,700 | 8,710 | 3,398 | Note ...: not applicable | 4.8 | |
| 1975 | 10,700 | 8,943 | 3,500 | Note ...: not applicable | 4.7 | |
| 1976 | 10,785 | 8,996 | 3,669 | Note ...: not applicable | 4.1 | |
| 1977 | 10,800 | 9,076 | 3,850 | Note ...: not applicable | 0.9 | |
| 1978 | 10,800 | 9,076 | 4,087 | Note ...: not applicable | 2.5 | |
| 1979 | 10,800 | 9,076 | 4,326 | Note ...: not applicable | 2.2 | |
| 1980 | 10,800 | 9,076 | 4,640 | Note ...: not applicable | 1.6 | |
| Millennials, and later | 1981 | 10,800 | 9,076 | 4,640 | 304 | 2.5 |
| 1982 | 10,700 | 9,076 | 4,640 | 701 | -2.0 | |
| 1983 | 10,650 | 9,076 | 4,640 | 1,001 | -1.2 | |
| 1984 | 10,300 | 9,076 | 4,640 | 1,591 | 2.9 | |
| 1985 | 9,809 | 9,076 | 4,800 | 2,157 | 4.2 | |
| 1986 | 9,274 | 9,170 | 5,000 | 2,657 | 0.6 | |
| 1987 | 9,274 | 9,170 | 5,000 | 3,003 | 0.8 | |
| 1988 | 8,900 | 9,250 | 5,400 | 3,242 | 3.4 | |
| 1989 | 8,650 | 9,350 | 5,650 | 3,627 | 2.1 | |
| 1990 | 8,354 | 9,459 | 5,934 | 3,944 | -2.1 | |
| 1991 | 8,200 | 9,480 | 5,980 | 4,377 | -3.0 | |
| 1992 | 8,000 | 9,500 | 6,000 | 4,871 | 0.5 | |
| 1993 | 7,800 | 9,520 | 6,070 | 5,295 | 0.3 | |
| 1994 | 7,600 | 9,540 | 6,120 | 5,741 | 0.7 | |
| 1995 | 7,482 | 9,567 | 6,170 | 6,083 | -0.8 | |
| 1996 | 7,300 | 9,580 | 6,200 | 6,530 | -0.4 | |
| 1997 | 7,100 | 9,590 | 6,250 | 6,966 | 1.3 | |
| 1998 | 6,900 | 9,610 | 6,300 | 7,345 | 2.9 | |
| 1999 | 6,700 | 9,630 | 6,350 | 7,721 | 2.7 | |
| 2000 | 6,532 | 9,650 | 6,396 | 8,108 | 2.4 | |
| 2001 | 6,350 | 9,670 | 6,450 | 8,551 | 2.4 | |
| 2002 | 6,200 | 9,680 | 6,500 | 8,980 | 1.0 | |
| 2003 | 6,050 | 9,690 | 6,570 | 9,334 | -0.5 | |
| 2004 | 5,900 | 9,700 | 6,620 | 9,721 | 2.0 | |
| 2005 | 5,745 | 9,711 | 6,680 | 10,108 | 0.6 | |
| 2006 | 5,560 | 9,700 | 6,750 | 10,561 | 4.3 | |
| 2007 | 5,400 | 9,695 | 6,800 | 10,994 | 2.2 | |
| 2008 | 5,200 | 9,690 | 6,850 | 11,507 | 2.2 | |
| 2009 | 5,000 | 9,686 | 6,900 | 12,043 | 1.2 | |
| 2010 | 4,804 | 9,682 | 6,969 | 12,550 | 1.9 | |
| 2011 | 4,600 | 9,660 | 7,000 | 13,079 | -0.3 | |
| 2012 | 4,400 | 9,630 | 7,050 | 13,634 | 1.3 | |
| 2013 | 4,200 | 9,600 | 7,100 | 14,183 | 2.4 | |
| 2014 | 4,000 | 9,570 | 7,130 | 14,737 | 0.3 | |
| 2015 | 3,819 | 9,544 | 7,167 | 15,172 | 2.7 | |
| 2016 | 3,500 | 9,450 | 7,230 | 15,929 | -0.4 | |
| 2017 | 3,200 | 9,330 | 7,260 | 16,755 | Note ...: not applicable | |
| 2018 | 2,900 | 9,200 | 7,290 | 17,675 | Note ...: not applicable | |
| 2019 | 2,790 | 9,070 | 7,324 | 18,409 | Note ...: not applicable | |
| Source: Author's calculations, based on data from Statistics Canada: Table A78-93, Population by age and sex, census dates, 1921 to 1971, catalogue 11-516-X; Table 17-10-0005-01, Population estimates on July 1st, by age and sex, 1971 to 2016; and Table 36-10-0229-01, Long-run provincial and territorial data, annual. | ||||||
Households have different sources of income and varying consumption needs and preferences as they progress through the life cycle, including: early adulthood, when a major income earner completes his/her education and training and embarks on a career; middle age, when a career is established and some may choose to start a family and support the development of their children; and senior age, when a major income earner may transition to retirement and draw from a pension or receive social benefits.
Throughout the following analysis, unless otherwise specified, values for income, consumption, net saving and net worth are adjusted for inflation using the all-items Consumer Price Index. Adjusting these estimates for general price inflation in any given period allows for more direct comparisons of the state of household sector economic well-being across generations as they reached the same point in their life cycle (Heisz and Richards, 2019).
The estimates shown within the following analysis include the DHEA measure of average dollars per household. While DHEA estimates are available on both an average dollars per household basis as well as by average dollars per consumption unit, the latter of which controls not only for the number of households but also for differences in the number of persons and age composition within households (DHEA, 2020, and OECD, 2013), the observations presented in this paper are consistent using either measure. Other factors, not controlled for in the following analysis, include differences in business cycle effects, cohort effects, such as changes in educational attainment, and family dynamics, including the participation of women in the labour force, the incidence of two-earner families, etc. Unless otherwise specified, younger generations refer to households with a major income earner in the millennial generation (millennials) and generation X, while older generations refer to households with a major income earner in the baby boom generation (boomers) and the pre-1946 generation.
Younger generations have higher disposable income as well as higher consumption expenditure than older generations when they reached the same age
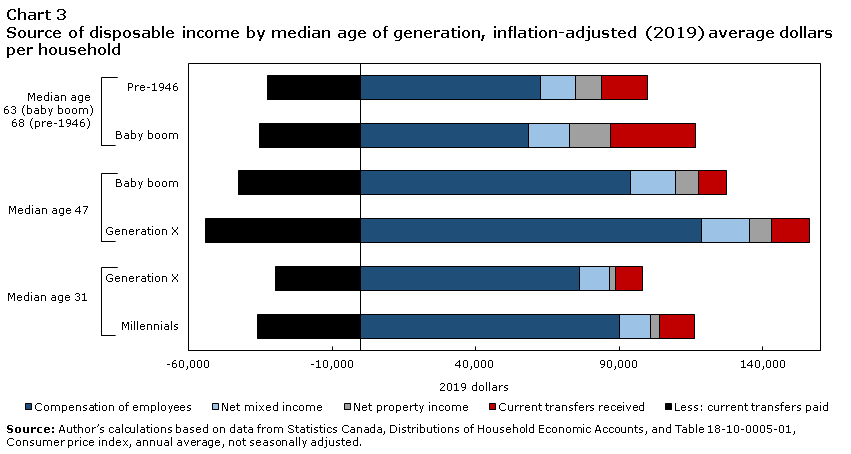
As illustrated in chart 3, a household may derive its disposable income from a number of sources, including from labour compensation such as wages and salaries, property income from receipts of interest and dividends, transfers from employer-sponsored pension plans, and from social benefits provided by governments and non-profit institutions serving households. In the DHEA, disposable income is presented net of all associated payments for taxes, interest paid and social contributions. Households may also receive mixed income from the operation of an unincorporated business, from direct rental income, and also from imputed rental income for owner-occupiers of dwellings.
Data table for Chart 3
| Median age by generation | ||||||
|---|---|---|---|---|---|---|
| Median age 31 | Median age 47 | Median age 63 (baby boom), 68 (pre-1946) | ||||
| Millennials | Generation X | Generation X | Baby boom | Baby boom | Pre-1946 | |
| 2019 dollars | ||||||
| Compensation of employees | 90,047 | 76,139 | 118,608 | 94,106 | 58,340 | 62,615 |
| Net mixed income | 10,968 | 10,332 | 16,832 | 15,618 | 14,213 | 12,083 |
| Net property income | 2,960 | 2,359 | 7,630 | 7,894 | 14,300 | 9,313 |
| Current transfers received | 12,384 | 9,448 | 13,366 | 9,751 | 29,602 | 15,993 |
| Less: current transfers paid | -36,170 | -29,588 | -53,971 | -42,458 | -35,180 | -32,517 |
| Source: Author’s calculations based on data from Statistics Canada, Distributions of Household Economic Accounts, and Table 18-10-0005-01, Consumer price index, annual average, not seasonally adjusted. | ||||||
On an inflation-adjusted (2019) dollar basis, when millennial households’ major income earner reached a median age of 31 in 2019, their average disposable income was $80,200, higher than for generation X households’ who had $68,700 when they reached that same age in 2002. Most of the difference for millennial households is due to higher average labour compensation earned through wages and salaries.
Similarly, when generation X households reached a median age of 47 in 2019, their income was $102,500, compared to $84,900 for boomer households who reached that same age in 2003. Generation X also had higher labour compensation, mainly through wages and salaries, than boomers earned at that same age.
Although a direct comparison of income between the pre-1946 generation and boomer households cannot be made, as the median ages of the major income earner do not intersect for the years available, the overall trend for boomers suggests that when they do reach their late sixties it is likely that their disposable income will be higher than what the pre-1946 generation had at that age. When boomers reached the age of 63 in 2019, their household disposable income was about $81,300 compared with the pre-1946 generation who had $67,500 when they reached the age of 68 in 1999. Boomers earned more than the pre-1946 generation from mixed income (including self-employment, actual and imputed rent) and from net property (investment) income. As well, boomers received higher transfer income, including old age security and employer-sponsored pension benefits.
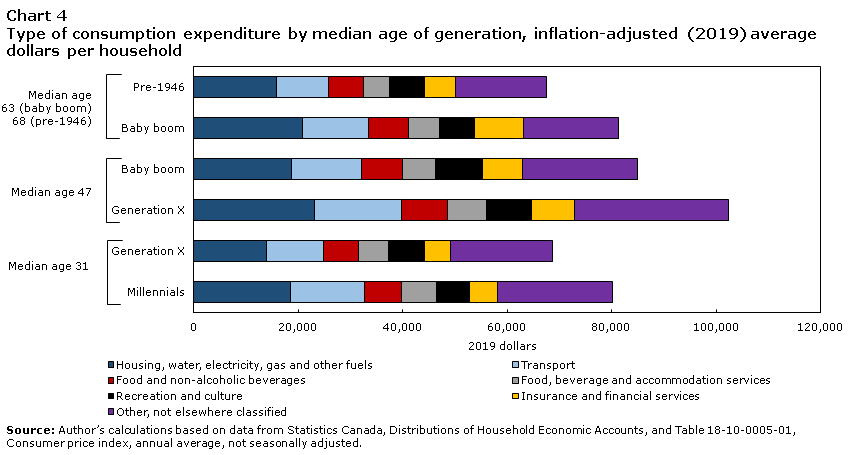
Higher consumption expenditures for younger generations due mainly to housing and utility costs
Household consumption expenditure consists mainly of cash outlays for consumer goods and services, but it also includes imputed expenditures related to owner‑occupied rent. Similar to income, chart 4 shows that each successive generation spent more than the preceding generation, in inflation-adjusted terms, when they reached the same points in their life cycle. While younger generations spent more than older generations on most types of consumption expenditures, these increases were driven mainly by housing and utility costs – including paid and imputed rental fees, maintenance and repair costs, as well as water, electricity, gas and other fuel costs. Regardless of generation, housing and utility costs accounted for about a quarter of overall household spending. Other key expenditure items that increased for each successive generation include transport, food, beverage and accommodation services, as well as insurance and financial services.
Data table for Chart 4
| Median age by generation | ||||||
|---|---|---|---|---|---|---|
| Median age 31 | Median age 47 | Median age 63 (baby boom), 68 (pre-1946) |
||||
| Millennials | Generation X | Generation X | Baby boom | Baby boom | Pre-1946 | |
| 2019 dollars | ||||||
| Housing, water, electricity, gas and other fuels | 18,428 | 13,970 | 23,111 | 18,599 | 20,847 | 15,747 |
| Transport | 14,176 | 10,905 | 16,558 | 13,519 | 12,591 | 10,116 |
| Food and non-alcoholic beverages | 7,064 | 6,676 | 8,852 | 7,926 | 7,650 | 6,656 |
| Food, beverage and accommodation services | 6,785 | 5,765 | 7,583 | 6,266 | 5,894 | 5,000 |
| Recreation and culture | 6,253 | 6,766 | 8,556 | 9,020 | 6,720 | 6,701 |
| Insurance and financial services | 5,426 | 5,106 | 8,288 | 7,534 | 9,502 | 5,858 |
| Other, not elsewhere classified | 22,057 | 19,500 | 29,518 | 22,047 | 18,070 | 17,411 |
| Source: Author’s calculations based on data from Statistics Canada, Distributions of Household Economic Accounts, and Table 18-10-0005-01, Consumer price index, annual average, not seasonally adjusted. | ||||||
Evolution of net saving similar by generation
To derive household net saving, in addition to factoring in household disposable income and consumption expenditure, an adjustment is applied in the DHEA estimates to include the change in employer-sponsored pension entitlements. The change in pension entitlements accounts for additions or subtractions to a household’s saving, depending on whether employee contributions and investment income outweigh pension withdrawals. In the context of the macro-economic accounts, since a net increase in the value of pension entitlements increases a household’s equity in pension funds, it is considered as an addition to their saving, which can be accessed by a household in retirement.
Net saving for younger generations has evolved in similar ways over time. As shown in chart 5, net saving was positive for both millennials ($8,300) and generation X ($4,800) households when the major income earner reached a median age of 31. Although millennials had higher disposable income than generation X, they also had higher consumption expenditure. Over the entire 1999-2019 period, net saving generally increased for both millennials and generation X households as they continue to work and contribute to their pensions.

Data table for Chart 5
| Median age | Value per household | |||||||||||
|---|---|---|---|---|---|---|---|---|---|---|---|---|
| Disposable income | Household final consumption expenditure | Net saving | ||||||||||
| Pre-1946 | Baby boom | Generation X | Millennials | Pre-1946 | Baby boom | Generation X | Millennials | Pre-1946 | Baby boom | Generation X | Millennials | |
| 2019 dollars | ||||||||||||
| 18 | Note ...: not applicable | Note ...: not applicable | Note ...: not applicable | 22,615 | Note ...: not applicable | Note ...: not applicable | Note ...: not applicable | 27,753 | Note ...: not applicable | Note ...: not applicable | Note ...: not applicable | -3,741 |
| 19 | Note ...: not applicable | Note ...: not applicable | Note ...: not applicable | 31,225 | Note ...: not applicable | Note ...: not applicable | Note ...: not applicable | 31,052 | Note ...: not applicable | Note ...: not applicable | Note ...: not applicable | 771 |
| 20 | Note ...: not applicable | Note ...: not applicable | Note ...: not applicable | 33,525 | Note ...: not applicable | Note ...: not applicable | Note ...: not applicable | 31,895 | Note ...: not applicable | Note ...: not applicable | Note ...: not applicable | 2,810 |
| 21 | Note ...: not applicable | Note ...: not applicable | Note ...: not applicable | 37,861 | Note ...: not applicable | Note ...: not applicable | Note ...: not applicable | 39,370 | Note ...: not applicable | Note ...: not applicable | Note ...: not applicable | -263 |
| 22 | Note ...: not applicable | Note ...: not applicable | Note ...: not applicable | 39,771 | Note ...: not applicable | Note ...: not applicable | Note ...: not applicable | 44,595 | Note ...: not applicable | Note ...: not applicable | Note ...: not applicable | -3,254 |
| 23 | Note ...: not applicable | Note ...: not applicable | Note ...: not applicable | 46,214 | Note ...: not applicable | Note ...: not applicable | Note ...: not applicable | 49,844 | Note ...: not applicable | Note ...: not applicable | Note ...: not applicable | -838 |
| 24 | Note ...: not applicable | Note ...: not applicable | Note ...: not applicable | 50,041 | Note ...: not applicable | Note ...: not applicable | Note ...: not applicable | 54,834 | Note ...: not applicable | Note ...: not applicable | Note ...: not applicable | -1,883 |
| 25 | Note ...: not applicable | Note ...: not applicable | Note ...: not applicable | 57,141 | Note ...: not applicable | Note ...: not applicable | Note ...: not applicable | 56,720 | Note ...: not applicable | Note ...: not applicable | Note ...: not applicable | 4,690 |
| 26 | Note ...: not applicable | Note ...: not applicable | Note ...: not applicable | 60,757 | Note ...: not applicable | Note ...: not applicable | Note ...: not applicable | 61,251 | Note ...: not applicable | Note ...: not applicable | Note ...: not applicable | 4,166 |
| 27 | Note ...: not applicable | Note ...: not applicable | Note ...: not applicable | 64,357 | Note ...: not applicable | Note ...: not applicable | Note ...: not applicable | 65,076 | Note ...: not applicable | Note ...: not applicable | Note ...: not applicable | 4,906 |
| 28 | Note ...: not applicable | Note ...: not applicable | Note ...: not applicable | 69,011 | Note ...: not applicable | Note ...: not applicable | Note ...: not applicable | 71,673 | Note ...: not applicable | Note ...: not applicable | Note ...: not applicable | 3,352 |
| 29 | Note ...: not applicable | Note ...: not applicable | 60,970 | 73,581 | Note ...: not applicable | Note ...: not applicable | 62,920 | 74,340 | Note ...: not applicable | Note ...: not applicable | 2,652 | 6,660 |
| 30 | Note ...: not applicable | Note ...: not applicable | 65,675 | 77,746 | Note ...: not applicable | Note ...: not applicable | 64,969 | 78,976 | Note ...: not applicable | Note ...: not applicable | 5,826 | 7,056 |
| 31 | Note ...: not applicable | Note ...: not applicable | 68,688 | 80,189 | Note ...: not applicable | Note ...: not applicable | 69,219 | 80,914 | Note ...: not applicable | Note ...: not applicable | 4,767 | 8,305 |
| 32 | Note ...: not applicable | Note ...: not applicable | 69,254 | Note ...: not applicable | Note ...: not applicable | Note ...: not applicable | 69,858 | Note ...: not applicable | Note ...: not applicable | Note ...: not applicable | 5,562 | Note ...: not applicable |
| 33 | Note ...: not applicable | Note ...: not applicable | 71,844 | Note ...: not applicable | Note ...: not applicable | Note ...: not applicable | 73,445 | Note ...: not applicable | Note ...: not applicable | Note ...: not applicable | 5,421 | Note ...: not applicable |
| 34 | Note ...: not applicable | Note ...: not applicable | 76,304 | Note ...: not applicable | Note ...: not applicable | Note ...: not applicable | 78,253 | Note ...: not applicable | Note ...: not applicable | Note ...: not applicable | 5,665 | Note ...: not applicable |
| 35 | Note ...: not applicable | Note ...: not applicable | 79,028 | Note ...: not applicable | Note ...: not applicable | Note ...: not applicable | 80,160 | Note ...: not applicable | Note ...: not applicable | Note ...: not applicable | 7,200 | Note ...: not applicable |
| 36 | Note ...: not applicable | Note ...: not applicable | 80,579 | Note ...: not applicable | Note ...: not applicable | Note ...: not applicable | 79,981 | Note ...: not applicable | Note ...: not applicable | Note ...: not applicable | 9,648 | Note ...: not applicable |
| 37 | Note ...: not applicable | Note ...: not applicable | 84,268 | Note ...: not applicable | Note ...: not applicable | Note ...: not applicable | 79,652 | Note ...: not applicable | Note ...: not applicable | Note ...: not applicable | 13,397 | Note ...: not applicable |
| 38 | Note ...: not applicable | Note ...: not applicable | 86,604 | Note ...: not applicable | Note ...: not applicable | Note ...: not applicable | 84,061 | Note ...: not applicable | Note ...: not applicable | Note ...: not applicable | 12,138 | Note ...: not applicable |
| 39 | Note ...: not applicable | Note ...: not applicable | 87,584 | Note ...: not applicable | Note ...: not applicable | Note ...: not applicable | 85,116 | Note ...: not applicable | Note ...: not applicable | Note ...: not applicable | 13,067 | Note ...: not applicable |
| 40 | Note ...: not applicable | Note ...: not applicable | 90,701 | Note ...: not applicable | Note ...: not applicable | Note ...: not applicable | 89,440 | Note ...: not applicable | Note ...: not applicable | Note ...: not applicable | 12,515 | Note ...: not applicable |
| 41 | Note ...: not applicable | Note ...: not applicable | 93,793 | Note ...: not applicable | Note ...: not applicable | Note ...: not applicable | 92,080 | Note ...: not applicable | Note ...: not applicable | Note ...: not applicable | 13,369 | Note ...: not applicable |
| 42 | Note ...: not applicable | Note ...: not applicable | 94,603 | Note ...: not applicable | Note ...: not applicable | Note ...: not applicable | 93,967 | Note ...: not applicable | Note ...: not applicable | Note ...: not applicable | 12,856 | Note ...: not applicable |
| 43 | Note ...: not applicable | 81,182 | 95,295 | Note ...: not applicable | Note ...: not applicable | 81,874 | 95,860 | Note ...: not applicable | Note ...: not applicable | 8,378 | 11,497 | Note ...: not applicable |
| 44 | Note ...: not applicable | 83,171 | 95,439 | Note ...: not applicable | Note ...: not applicable | 82,608 | 96,390 | Note ...: not applicable | Note ...: not applicable | 9,859 | 12,376 | Note ...: not applicable |
| 45 | Note ...: not applicable | 84,549 | 99,653 | Note ...: not applicable | Note ...: not applicable | 83,569 | 99,587 | Note ...: not applicable | Note ...: not applicable | 9,752 | 13,490 | Note ...: not applicable |
| 46 | Note ...: not applicable | 85,488 | 101,060 | Note ...: not applicable | Note ...: not applicable | 86,237 | 99,847 | Note ...: not applicable | Note ...: not applicable | 7,657 | 14,794 | Note ...: not applicable |
| 47 | Note ...: not applicable | 84,911 | 102,466 | Note ...: not applicable | Note ...: not applicable | 86,729 | 100,107 | Note ...: not applicable | Note ...: not applicable | 6,901 | 16,098 | Note ...: not applicable |
| 48 | Note ...: not applicable | 87,543 | Note ...: not applicable | Note ...: not applicable | Note ...: not applicable | 90,626 | Note ...: not applicable | Note ...: not applicable | Note ...: not applicable | 6,045 | Note ...: not applicable | Note ...: not applicable |
| 49 | Note ...: not applicable | 87,215 | Note ...: not applicable | Note ...: not applicable | Note ...: not applicable | 90,938 | Note ...: not applicable | Note ...: not applicable | Note ...: not applicable | 5,537 | Note ...: not applicable | Note ...: not applicable |
| 50 | Note ...: not applicable | 88,620 | Note ...: not applicable | Note ...: not applicable | Note ...: not applicable | 90,667 | Note ...: not applicable | Note ...: not applicable | Note ...: not applicable | 6,981 | Note ...: not applicable | Note ...: not applicable |
| 51 | Note ...: not applicable | 89,954 | Note ...: not applicable | Note ...: not applicable | Note ...: not applicable | 92,594 | Note ...: not applicable | Note ...: not applicable | Note ...: not applicable | 6,477 | Note ...: not applicable | Note ...: not applicable |
| 52 | Note ...: not applicable | 90,890 | Note ...: not applicable | Note ...: not applicable | Note ...: not applicable | 93,426 | Note ...: not applicable | Note ...: not applicable | Note ...: not applicable | 5,751 | Note ...: not applicable | Note ...: not applicable |
| 53 | Note ...: not applicable | 90,276 | Note ...: not applicable | Note ...: not applicable | Note ...: not applicable | 93,171 | Note ...: not applicable | Note ...: not applicable | Note ...: not applicable | 4,152 | Note ...: not applicable | Note ...: not applicable |
| 54 | Note ...: not applicable | 90,631 | Note ...: not applicable | Note ...: not applicable | Note ...: not applicable | 91,432 | Note ...: not applicable | Note ...: not applicable | Note ...: not applicable | 5,148 | Note ...: not applicable | Note ...: not applicable |
| 55 | Note ...: not applicable | 88,035 | Note ...: not applicable | Note ...: not applicable | Note ...: not applicable | 89,239 | Note ...: not applicable | Note ...: not applicable | Note ...: not applicable | 4,651 | Note ...: not applicable | Note ...: not applicable |
| 56 | Note ...: not applicable | 88,107 | Note ...: not applicable | Note ...: not applicable | Note ...: not applicable | 88,685 | Note ...: not applicable | Note ...: not applicable | Note ...: not applicable | 4,656 | Note ...: not applicable | Note ...: not applicable |
| 57 | Note ...: not applicable | 87,437 | Note ...: not applicable | Note ...: not applicable | Note ...: not applicable | 87,465 | Note ...: not applicable | Note ...: not applicable | Note ...: not applicable | 4,375 | Note ...: not applicable | Note ...: not applicable |
| 58 | Note ...: not applicable | 86,501 | Note ...: not applicable | Note ...: not applicable | Note ...: not applicable | 87,051 | Note ...: not applicable | Note ...: not applicable | Note ...: not applicable | 2,596 | Note ...: not applicable | Note ...: not applicable |
| 59 | Note ...: not applicable | 89,778 | Note ...: not applicable | Note ...: not applicable | Note ...: not applicable | 87,902 | Note ...: not applicable | Note ...: not applicable | Note ...: not applicable | 4,127 | Note ...: not applicable | Note ...: not applicable |
| 60 | Note ...: not applicable | 84,470 | Note ...: not applicable | Note ...: not applicable | Note ...: not applicable | 86,436 | Note ...: not applicable | Note ...: not applicable | Note ...: not applicable | -1,675 | Note ...: not applicable | Note ...: not applicable |
| 61 | Note ...: not applicable | 84,531 | Note ...: not applicable | Note ...: not applicable | Note ...: not applicable | 86,426 | Note ...: not applicable | Note ...: not applicable | Note ...: not applicable | -2,682 | Note ...: not applicable | Note ...: not applicable |
| 62 | Note ...: not applicable | 82,866 | Note ...: not applicable | Note ...: not applicable | Note ...: not applicable | 85,616 | Note ...: not applicable | Note ...: not applicable | Note ...: not applicable | -5,094 | Note ...: not applicable | Note ...: not applicable |
| 63 | Note ...: not applicable | 81,274 | Note ...: not applicable | Note ...: not applicable | Note ...: not applicable | 83,752 | Note ...: not applicable | Note ...: not applicable | Note ...: not applicable | -6,386 | Note ...: not applicable | Note ...: not applicable |
| 64 | Note ...: not applicable | Note ...: not applicable | Note ...: not applicable | Note ...: not applicable | Note ...: not applicable | Note ...: not applicable | Note ...: not applicable | Note ...: not applicable | Note ...: not applicable | Note ...: not applicable | Note ...: not applicable | Note ...: not applicable |
| 65 | Note ...: not applicable | Note ...: not applicable | Note ...: not applicable | Note ...: not applicable | Note ...: not applicable | Note ...: not applicable | Note ...: not applicable | Note ...: not applicable | Note ...: not applicable | Note ...: not applicable | Note ...: not applicable | Note ...: not applicable |
| 66 | Note ...: not applicable | Note ...: not applicable | Note ...: not applicable | Note ...: not applicable | Note ...: not applicable | Note ...: not applicable | Note ...: not applicable | Note ...: not applicable | Note ...: not applicable | Note ...: not applicable | Note ...: not applicable | Note ...: not applicable |
| 67 | Note ...: not applicable | Note ...: not applicable | Note ...: not applicable | Note ...: not applicable | Note ...: not applicable | Note ...: not applicable | Note ...: not applicable | Note ...: not applicable | Note ...: not applicable | Note ...: not applicable | Note ...: not applicable | Note ...: not applicable |
| 68 | 55,901 | Note ...: not applicable | Note ...: not applicable | Note ...: not applicable | 57,417 | Note ...: not applicable | Note ...: not applicable | Note ...: not applicable | -3,708 | Note ...: not applicable | Note ...: not applicable | Note ...: not applicable |
| 69 | 55,516 | Note ...: not applicable | Note ...: not applicable | Note ...: not applicable | 57,417 | Note ...: not applicable | Note ...: not applicable | Note ...: not applicable | -6,869 | Note ...: not applicable | Note ...: not applicable | Note ...: not applicable |
| 70 | 53,802 | Note ...: not applicable | Note ...: not applicable | Note ...: not applicable | 56,250 | Note ...: not applicable | Note ...: not applicable | Note ...: not applicable | -8,002 | Note ...: not applicable | Note ...: not applicable | Note ...: not applicable |
| 71 | 52,314 | Note ...: not applicable | Note ...: not applicable | Note ...: not applicable | 54,744 | Note ...: not applicable | Note ...: not applicable | Note ...: not applicable | -8,699 | Note ...: not applicable | Note ...: not applicable | Note ...: not applicable |
| 72 | 55,408 | Note ...: not applicable | Note ...: not applicable | Note ...: not applicable | 57,203 | Note ...: not applicable | Note ...: not applicable | Note ...: not applicable | -9,830 | Note ...: not applicable | Note ...: not applicable | Note ...: not applicable |
| 73 | 55,378 | Note ...: not applicable | Note ...: not applicable | Note ...: not applicable | 58,291 | Note ...: not applicable | Note ...: not applicable | Note ...: not applicable | -11,423 | Note ...: not applicable | Note ...: not applicable | Note ...: not applicable |
| 74 | 55,975 | Note ...: not applicable | Note ...: not applicable | Note ...: not applicable | 57,610 | Note ...: not applicable | Note ...: not applicable | Note ...: not applicable | -10,878 | Note ...: not applicable | Note ...: not applicable | Note ...: not applicable |
| 75 | 57,475 | Note ...: not applicable | Note ...: not applicable | Note ...: not applicable | 58,762 | Note ...: not applicable | Note ...: not applicable | Note ...: not applicable | -11,581 | Note ...: not applicable | Note ...: not applicable | Note ...: not applicable |
| 76 | 55,471 | Note ...: not applicable | Note ...: not applicable | Note ...: not applicable | 56,463 | Note ...: not applicable | Note ...: not applicable | Note ...: not applicable | -11,194 | Note ...: not applicable | Note ...: not applicable | Note ...: not applicable |
| 77 | 58,075 | Note ...: not applicable | Note ...: not applicable | Note ...: not applicable | 54,793 | Note ...: not applicable | Note ...: not applicable | Note ...: not applicable | -8,440 | Note ...: not applicable | Note ...: not applicable | Note ...: not applicable |
| 78 | 56,627 | Note ...: not applicable | Note ...: not applicable | Note ...: not applicable | 56,393 | Note ...: not applicable | Note ...: not applicable | Note ...: not applicable | -12,313 | Note ...: not applicable | Note ...: not applicable | Note ...: not applicable |
| 79 | 57,495 | Note ...: not applicable | Note ...: not applicable | Note ...: not applicable | 56,573 | Note ...: not applicable | Note ...: not applicable | Note ...: not applicable | -13,262 | Note ...: not applicable | Note ...: not applicable | Note ...: not applicable |
| 80 | 54,687 | Note ...: not applicable | Note ...: not applicable | Note ...: not applicable | 56,612 | Note ...: not applicable | Note ...: not applicable | Note ...: not applicable | -14,991 | Note ...: not applicable | Note ...: not applicable | Note ...: not applicable |
| 81 | 53,855 | Note ...: not applicable | Note ...: not applicable | Note ...: not applicable | 54,337 | Note ...: not applicable | Note ...: not applicable | Note ...: not applicable | -13,024 | Note ...: not applicable | Note ...: not applicable | Note ...: not applicable |
| Source: Author’s calculations based on data from Statistics Canada, Distributions of Household Economic Accounts, and Table 18-10-0005-01, Consumer price index, annual average, not seasonally adjusted. | ||||||||||||
Generation X spent less than their household income when they reached a median age of 47 in 2019, at $100,100 for consumption versus $102,500 for income, while boomers spent more when they reached that same age in 2003, at $86,700 for consumption vs. $84,900 for income. Both generation X and boomers increased their pension entitlements, however, which more than compensated for their spending, resulting in positive net saving for both generations. Net saving for generation X ($16,100) was more than two times higher than for boomers ($6,900) at the same median age of 47 years old.
Boomers and the pre-1946 generation both had negative net saving, at -$6,400 and ‑$3,700 respectively, as they spent more than their disposable income when they reached a median age in their sixties and they withdrew more from their pensions than they contributed or earned through investment interest. Despite their negative net saving, older generations may be able to maintain their future consumption as they have accumulated significant assets from which to draw upon when needed.
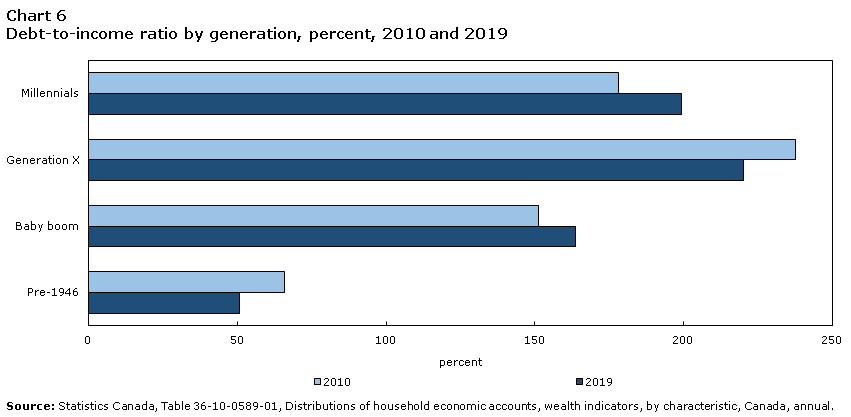
Generation X have highest debt-to-income ratio, but ratio for millennials increases
As indicated in chart 6, while the debt-to-income ratio was highest in 2019 for generation X households, at 220%, that ratio has decreased by 18 percentage points since 2010 as their disposable income grew by more than their mortgage debt. In contrast, millennials have increased their ratio by 21 percentage points, from 178% in 2010 to 199% in 2019. While growing real estate values for millennials have more than compensated for their increased debt holdings since 2010, disposable income has not kept pace, growing at an average rate of 5% per year compared with 6% for total debt.
Data table for Chart 6
| Generation | 2010 | 2019 |
|---|---|---|
| percent | ||
| Millennials | 178.1 | 199.2 |
| Generation X | 237.7 | 220.2 |
| Baby boom | 151.1 | 163.7 |
| Pre-1946 | 65.9 | 50.7 |
| Source: Statistics Canada, Table 36-10-0589-01, Distributions of household economic accounts, wealth indicators, by characteristic, Canada, annual. | ||
Millennials’ economic well-being more at risk as they work in industries deeply affected by the COVID-19 pandemic
According to the Labour Force Survey, summarized in chart 7, as of the second quarter of 2019, millennials accounted for 69% of employment in accommodation and food services, 57% in retail trade, and 56% in information, culture and recreation.

Data table for Chart 7
| Industry | Millennials | Generation X | Baby boom and pre-1946 |
|---|---|---|---|
| share of generation total | |||
| Goods-producing industries | 43.0 | 33.3 | 23.7 |
| Other services-producing industries | 42.3 | 34.7 | 22.9 |
| Retail trade | 57.1 | 23.5 | 19.3 |
| Information, culture and recreation | 55.9 | 26.9 | 17.2 |
| Accommodation and food services | 69.2 | 18.5 | 12.3 |
| Source: Author’s calculations based on data from Statistics Canada, Labour Force Survey, Public Use Microdata File. | |||
As noted in recent assessments of the Canadian economy (Statistics Canada, September and August 2020; Conference Board of Canada, August 2020; Bank of Canada, July 2020; C.D. Howe Institute, 2020), while financial markets and real estate values have remained relatively stable since the beginning of the year, the COVID‑19 pandemic is having a more noticeable impact on employment, especially in industries in which youth account for a majority of workers.
In particular, while reductions in employment for millennials were greater than for older generations across all industry types, they were especially severe in services-producing jobs, where younger generations tend to comprise a higher share of the total workforce. As shown in chart 8, as of the second quarter of 2020, employment for millennial workers fell by about 45% from the prior year in accommodation and food services, by 29% in information, culture and recreation, and by 20% in retail trade.

Data table for Chart 8
| Industry | Millennials | Generation X | Baby boom and Pre-1946 |
|---|---|---|---|
| % | |||
| Accommodation and food services | -45.1 | -35.8 | -32.0 |
| Information, culture and recreation | -28.5 | -11.8 | -18.1 |
| Retail Trade | -20.4 | -12.9 | -8.8 |
| Other services-producing industries | -8.0 | -6.4 | -8.0 |
| Goods-producing | -14.0 | -11.4 | -10.9 |
| Source: Author’s calculations based on data from Statistics Canada, Labour Force Survey, Public Use Microdata File. | |||
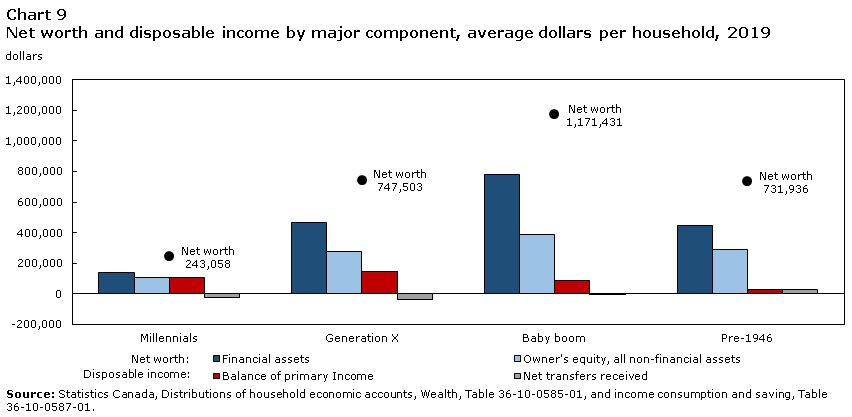
…and younger generations have less equity from which to draw upon when needed
Going forward, millennials may continue to face challenges in servicing their consumption and debt obligations, as they have not accumulated as much equity in financial and real estate assets from which to draw upon relative to older generations. As indicated in chart 9, the net worth of millennials, as measured by the value of their financial assets and their equity in real estate and other non-financial assets, is about one-third the value held by generation x, one-fifth of that for boomers, and one-third of that for the pre-1946 generation.
Data table for Chart 9
| Generation | Millennials | Generation X | Baby boom | Pre-1946 |
|---|---|---|---|---|
| dollars | ||||
| Financial assets | 137,907 | 469,322 | 780,598 | 444,804 |
| Owner's equity, all non-financial assets | 105,151 | 278,181 | 390,833 | 287,132 |
| Balance of primary Income | 103,975 | 143,070 | 86,853 | 27,675 |
| Net transfers received | -23,786 | -40,605 | -5,578 | 26,181 |
| Net worth | 243,058 | 747,503 | 1,171,431 | 731,936 |
| Source: Statistics Canada, Distributions of household economic accounts, Wealth, Table 36-10-0585-01, and income consumption and saving, Table 36-10-0587-01. | ||||
In conclusion, as the impacts of the COVID-19 pandemic continue to work their way through the economy, the well-being of millennials may be more at risk relative to older generations, despite the introduction of unprecedented income support programs. Due to uncertainty in their disposable income, some millennials may choose to postpone major life events such as buying a house, starting a family and investing in their children’s education.
Appendix
Characteristics by generation for the major income earner in a household, Distributions of Household Economic Accounts for the 2019 reference year
Pre-1946 generation
- Born: Before 1946
- Age range: 74 to 99
- Median age: 81
- Average age: 82
- Share of population aged 15 years and over: 16%
Baby boom generation
- Born: 1946 to 1964
- Age range: 55 to 73
- Median age: 63
- Average age: 63
- Share of population aged 15 years and over: 31%
Generation X
- Born: 1965 to 1980
- Age range: 39 to 54
- Median age: 47
- Average age: 46
- Share of population aged 15 years and over: 27%
Millennials
- Born: After 1980*
- Age range: 16 to 38
- Median age: 31
- Average age: 30
- Share of population aged 15 years and over: 26%
* Millennial households include generation Z, those with a major income earner born after 1996, as their sample size is relatively small.
References
Bank of Canada (2020 07 15). Monetary Policy Report.
C.D. Howe Institute (2020). Education, Skills and Labour Market.
Conference Board of Canada (2020 08). Canadian Outlook Economic Forecast: Household Consumption.
Organisation for Economic Co-operation and Development (2013). OECD Framework for Statistics on the Distribution of Household Income, Consumption and Wealth.
Pettinger, Tejvan (2019 05 24). Life-Cycle Hypothesis.
Pew Research Center (2015 09 03). The Whys and Hows of Generations Research, September 3, 2015.
Statistics Canada (2016 05 31). Methodological Guide: Canadian System of Macroeconomic Accounts. Catalogue no. 13-607-X.
Statistics Canada (2016 05 31). User Guide: Canadian System of Macroeconomic Accounts. Catalogue no. 13-606-G.
Statistics Canada (2019 04 18). Economic Well-being Across Generations of Young Canadians: Are Millennials Better or Worse Off?, Economic Insights. Andrew Heisz and Elizabeth Richards. Catalogue no. 11-626-X, No. 092.
Statistics Canada (2020 01 22). Consumer price index, annual average, not seasonally adjusted. Table 18-10-0005-01.
Statistics Canada (2020 06 26). Distributions of Household Economic Accounts, Satellite Accounts and Special Studies.
Statistics Canada (2020 06 26). Distributions of household economic accounts for income, consumption, saving and wealth of Canadian households, 2019. The Daily.
Statistics Canada (2020 06 26). Distributions of Household Economic Accounts, estimates of asset, liability and net worth distributions, 2010 to 2019: Technical methodology and quality report. Income and Expenditure Accounts Technical Series. Catalogue no. 13-604-M.
Statistics Canada (2020 08 28). Gross Domestic Product, income and expenditure, second quarter 2020, The Daily.
Statistics Canada (2020 09 04). Labour Force Survey, August 2020. The Daily. Catalogue no. 11-001-X.
Statistics Canada (2020 09 04). Labour Force Survey, Public Use Microdata File.
Szenberg, M. and Ramrattan, L. (2008). The Life Cycle Hypothesis, chapter 4 in Franco Modigliani, Great Thinkers in Economics Series, 2008.
- Date modified: