
Economic Insights
Economic Well-being Across Generations of Young Canadians:
Are Millennials Better or Worse Off?

Archived Content
Information identified as archived is provided for reference, research or recordkeeping purposes. It is not subject to the Government of Canada Web Standards and has not been altered or updated since it was archived. Please "contact us" to request a format other than those available.
by Andrew Heisz and Elizabeth Richards,
Income Statistics Division and Analytical Studies Branch,
Statistics Canada
This article in the Economic Insights series examines economic well-being of millennials by comparing their household balance sheets to those of previous generations of young Canadians. Measured at the same point in their life course, millennials were relatively better off than young Gen-Xers in terms of net worth, but also had higher debt levels. Higher values for principal residences and mortgage debt mainly explain these patterns. Financial outcomes varied considerably among millennial households. Home ownership, living in Toronto or Vancouver, and having a higher education were three factors associated with higher net worth.
Introduction
The income distribution of Canadian households has been widening over the past few decades. This means that the distance between top and bottom income groups has grown. For example, incomes for the bottom 10% increased from $10,600 to $14,400 from 1995 to 2017, compared to $81,200 to $123,800 for the top 10%.Note This suggests the possibility of different savings and wealth outcomes for Canadians.Note
Previous work has shown that between 59 and 67 percent of children born between 1970 and 1984 had income as adults that was at least as high as their parents (Ostrovsky 2017). However, less is known about other dimensions of economic well-being across generations. Economic well-being refers to the ability of households to meet their needs, to accumulate assets and build wealth. Millennials, now the largest generation of Canadians, at 27% of the total population, may be facing different challenges in building wealth than previous generations of young Canadians. Despite being the most educated generation, concerns have been raised that millennials have been “slower to launch”.
According to the United States Federal Reserve Board, American millennials have lower incomes and have accumulated fewer assets than previous generations at the same age, reflecting weaker labour and credit market conditions following the global financial crisis (Kurz et al. 2018). While Canadian researchers have studied intergenerational income mobility and the evolution of incomes for young workers in Canada, assessing other economic well-being indicators from a generational lens fills an important knowledge gap in the literature.Note In contrast to patterns observed in the United States, recent work has shown that millennials have higher median incomes, assets and debts than Gen-Xers at the same age, while also showing that millennials are just as financially knowledgeable as young Gen-Xers (Robson and Loucks 2018).
This study uses data from the Canadian Income Survey and the Survey of Financial Security to extend the inter-generational comparison, providing additional insights on net worth, debt and mortgage debt for millennials, while informing on different financial outcomes by education, homeownership or CMA. The study answers these two related questions:
- Are millennial households better or worse off than previous generations at the same age in terms of income levels, debts, assets and net worth?
- Are some millennial households, such as those with lower levels of educational attainment or who did not invest in the housing market, being left behind in terms of building wealth?
Data
Information on the assets, debts, debt to income ratio and net worth of Canadians is drawn from the Survey of Financial Security (SFS) in 1999 and 2016 and the Assets and Debt Survey (ADS) for 1984.Note The Canadian Income Survey (CIS) for these same years is used for estimates of household income. All measures have been adjusted for inflation using the Consumer Price Index.Note Though data on household balance sheets are collected and presented for families, socio-economic characteristics, such as age and educational attainment, are taken to be the characteristics of the major earner in the family.
This study compares the economic well-being of families according to their generational cohort. Table 1 shows the birth years of the cohorts compared in this study. The results focus on the early birth years for Generation-X (or Gen-Xers) and millennials and the middle birth years of the baby boomers. Unless otherwise indicated, “young” refers to families in a given generation where the major earner was between 25 and 34 years old.
Using the data for 1984, 1999 and 2016 allows for the comparison of these generations at different points in their life course. This study uses a “synthetic cohort” approach, whereby data from multiple years of cross sectional surveys are organised to present estimates for generations at different ages. Table 1 also shows which year of data is used in each cohort-by-age combination. For example, Gen-Xers around age 30 in 1999 are compared to Gen-Xers who were in their mid-40s in 2016. Similarly, millennials aged 25-34 in 2016 are compared to Generation-Xers who were this age in 1999 to see how economic well-being for young families has evolved across generations.Note Since generations span more than ten years, a single year’s observation may not be representative of the full cohort at a particular age.Note
| Generational cohorts | ||||
|---|---|---|---|---|
| Millennials | Generation X | Baby boomers | Older generation | |
| Birth cohorts used in this study | 1982 to 1991Table 1 Note 1 | 1965 to 1976Table 1 Note 1 | 1950 to 1961Table 1 Note 2 | 1935 to 1945 |
| Age in 2016 | 25 to 34 | 40 to 49 | 55 to 64 | 70 to 79 |
| Source years for each generation by age group combination | ||||
| 25 to 34 | 2016 | 1999 | 1984 | Note ...: not applicable |
| 40 to 49 | Note ...: not applicable | 2016 | 1999 | 1984 |
| 55 to 64 | Note ...: not applicable | Note ...: not applicable | 2016 | 1999 |
| 70 to 79 | Note ...: not applicable | Note ...: not applicable | Note ...: not applicable | 2016 |
... not applicable
|
||||
Millennials were better off than young Gen-Xers, but were also more indebted
Income growth follows an expected life cycle pattern, increasing until peak earnings age, typically in the late 40s or 50s, then beginning to decline, reaching a low when individuals draw down their savings during retirement. Income differences were observed across generations, higher from one generation to the next when measured at the same point in their life course.
Over the last decade, millennials began to enter the labour market or pursue post-secondary studies. Though early in their life cycle and their prime working years, millennials had higher real median after-tax household incomes than baby boomers or Gen-Xers at the same age. For example, adjusted household income for millennials between 25 and 34 years old reached $44,100 in 2016, compared to $33,300 for Gen-Xers at the same age in 1999 (Chart 1).Note

Data table for Chart 1
| Age group of household head | Millennials | Generation X | Baby Boomers | Older Generation |
|---|---|---|---|---|
| 2016 constant dollars | ||||
| 25 to 34 | 44,093 | 33,276 | 33,350 | Note ...: not applicable |
| 40 to 49 | Note ...: not applicable | 46,106 | 38,125 | 37,062 |
| 55 to 64 | Note ...: not applicable | Note ...: not applicable | 45,667 | 35,797 |
| 70 to 79 | Note ...: not applicable | Note ...: not applicable | Note ...: not applicable | 34,685 |
|
... not applicable Source: Statistics Canada, Canadian Income Survey program. |
||||
Consistent with rising income levels across generations, assets, debts and net worth were also higher for millennials compared to young Gen-Xers. Median net worth, defined as total household assets less debts, was higher for millennials than for young Gen-Xers. By 2016, millennials aged 25 to 34 had accumulated a median net worth of $70,600—over one and half times the levels reached by Gen-Xers at the same age in 1999 ($42,800) (Chart 2). Data from the 1984 ADS do not allow for a comparison of assets between millennials and young boomers. As a result, it is unclear whether the median net worth of millennials is higher than for young boomers. Differences in net worth were more pronounced later in life when comparing generations of Canadians, as wealth is accumulated over time and debts are generally reduced or eliminated.
To accumulate wealth, millennials and young Gen-Xers took on higher levels of both debt and assets. Median debt reached $35,400 for millennials, compared to $19,400 for young Gen-Xers. Similar patterns were observed for assets, as millennials accumulated a median of $154,100 in assets (including housing) compared to $76,700 for young Gen-Xers. While millennials were relatively more indebted, their assets also yielded a stronger outcome in terms of overall net worth.Note
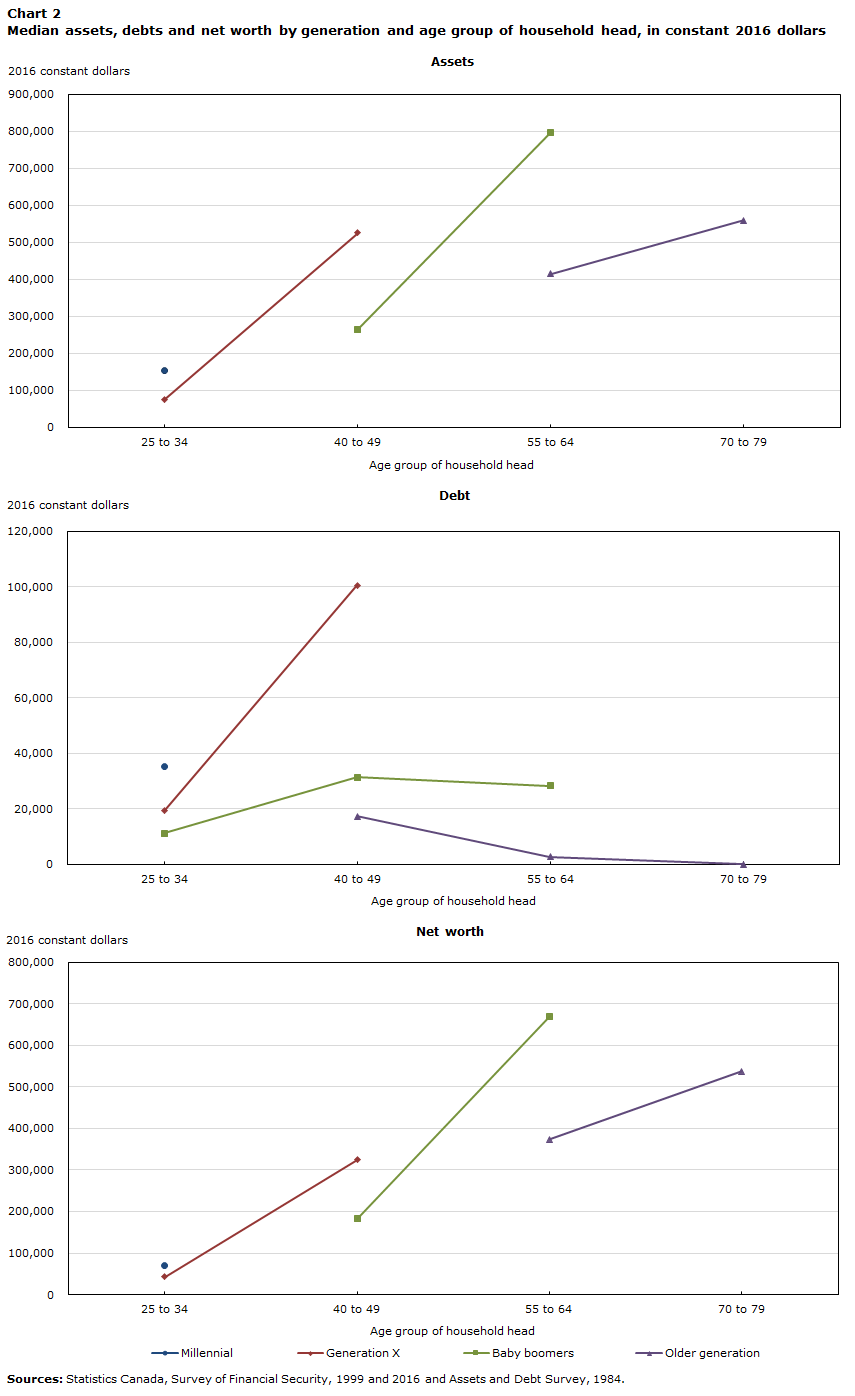
Data table for Chart 2
| Age group of household head | Millennial | Generation X | Baby boomers | Older generation |
|---|---|---|---|---|
| 2016 constant dollars | ||||
| Assets | ||||
| 25 to 34 | 154,139 | 76,708 | Note ...: not applicable | Note ...: not applicable |
| 40 to 49 | Note ...: not applicable | 526,501 | 265,507 | Note ...: not applicable |
| 55 to 64 | Note ...: not applicable | Note ...: not applicable | 797,291 | 415,424 |
| 70 to 79 | Note ...: not applicable | Note ...: not applicable | Note ...: not applicable | 559,825 |
| Debt | ||||
| 25 to 34 | 35,400 | 19,350 | 11,293 | Note ...: not applicable |
| 40 to 49 | Note ...: not applicable | 100,500 | 31,374 | 17,279 |
| 55 to 64 | Note ...: not applicable | Note ...: not applicable | 28,400 | 2,764 |
| 70 to 79 | Note ...: not applicable | Note ...: not applicable | Note ...: not applicable | 0 |
| Net worth | ||||
| 25 to 34 | 70,600 | 42,846 | Note ...: not applicable | Note ...: not applicable |
| 40 to 49 | Note ...: not applicable | 324,554 | 182,441 | Note ...: not applicable |
| 55 to 64 | Note ...: not applicable | Note ...: not applicable | 669,540 | 373,727 |
| 70 to 79 | Note ...: not applicable | Note ...: not applicable | Note ...: not applicable | 537,000 |
|
... not applicable Sources: Statistics Canada, Survey of Financial Security, 1999 and 2016 and Assets and Debt Survey, 1984. |
||||
When assessing household leverage or financial vulnerabilities, considering debt levels relative to income provides some information on indebtedness and the ability of households to service their debt from their current income. Consistent with higher debt levels for millennials, debt to after-tax income levels were increasingly higher for younger generations (Chart 3). Millennials had the highest debt to after-tax ratio among generations measured at any point in their life course, reaching 216%—over 1.7 times more than young Gen-Xers and 2.7 times more than young boomers. Debt-to-income levels for millennials were comparable to Gen-Xers later in their life, when the major earner was between 40 and 49 years old.
Data table for Chart 3
| Age group of household head | Millennial | Generation X | Baby boomers | Older generation |
|---|---|---|---|---|
| debt-to-after-tax income ratios | ||||
| 25 to 34 | 2.162 | 1.254 | 0.804 | Note ...: not applicable |
| 40 to 49 | Note ...: not applicable | 2.146 | 1.081 | 0.685 |
| 55 to 64 | Note ...: not applicable | Note ...: not applicable | 1.347 | 0.686 |
| 70 to 79 | Note ...: not applicable | Note ...: not applicable | Note ...: not applicable | 0.706 |
|
... not applicable Sources: Statistics Canada, Survey of Financial Security, 1999 and 2016 and Assets and Debt Survey, 1984. |
||||
Even during a period of considerable home price inflation, millennials continued to enter the housing market at the same rate as previous generations of young adults. Among millennials where the major household earner was between 30 and 34 years old, typically when households tend to invest in the housing market, 51% had a principal residence as part of their asset portfolio in 2016, comparable to Gen-Xers (51% in 1999) and young boomers (55% in 1984) at the same age.
Though homeownership rates were similar across generations of young Canadians, millennials who entered the housing market took on larger mortgages relative to their incomes than before. Specifically, the median value for mortgage debt on principal residences for millennials reached $218,000, over 2.5 times the value of median after-tax incomes ($83,200) of households with principal residences. To a lesser extent, mortgage debt on principal residences reached 1.8 times the value of median after-tax incomes for young Gen-Xers, while levels for both indicators were comparable for young boomers (Chart 4). Similar patterns were observed in terms of the median asset values for principal residences, higher for millennials at $329,000, compared to $182,400 for Gen-Xers at the same age. Consequently, housing values mainly explain the gains in both debt and net worth for millennials.
Data table for Chart 4
| Millenials | Generation X | Baby boomers | |
|---|---|---|---|
| median values, 2016 dollars | |||
| Value of principal residence | 329,000 | 182,441 | 137,723 |
| Mortgage on principal residence | 218,000 | 117,481 | 67,802 |
| After-tax income | 83,197 | 65,523 | 64,800 |
| Sources: Statistics Canada, Survey of Financial Security, 1999 and 2016 and Assets and Debt Survey, 1984. | |||
Financial outcomes for millennials varied considerably
Corresponding to increases in income differences, disparities in economic well-being have become larger from one generation to the next. This is reflected in the range of financial outcomes for millennials compared to Generation-X. The spread in net worth between millennials in the bottom 25% and those in the top 25%—known as the inter-quartile range—is larger when compared to young Gen-Xers (Chart 5). Millennials in the top 25% had $253,900 or more in median net worth, while those in the bottom 25% had $9,500 or less. However, among young Gen-Xers, the inter-quartile range was between $6,200 and $126,900. The range of financial outcomes was even more pronounced at the top end of the distribution, as net worth for young millennials reached $588,600 for the top 10%. By contrast, millennials in the bottom 10% owed $3,200. Put differently, the top 10% of millennials held about 55% of the total net worth accumulated by all millennials.
Data table for Chart 5
| Selected percentiles | Millennials | Generation X |
|---|---|---|
| 2016 constant dollars | ||
| Bottom 10% | -3,225 | -2,281 |
| Bottom 25% | 9,500 | 6,220 |
| Median | 70,600 | 42,846 |
| Top 25% | 253,850 | 126,881 |
| Top 10% | 588,582 | 287,405 |
| Source: Statistics Canada, Survey of Financial Security, 1999 and 2016. | ||
Disparities in net worth were observed among millennials who had invested in buying a home and those who had not. Among millennials when the major earner was between 30 and 34 years old and had a principal residence (about half of millennial families in this age range in 2016), net worth reached $261,900 (Chart 5). By contrast, net worth for those without a principal residence was $18,400. It could be posited that some millennials who have foregone the housing market, choosing to rent instead, could be accumulating the same wealth as homeowners through other means such as financial investments. Results from the SFS indicate that this is generally not the case. For example, in 2016, just 8% of millennial renters had net worth greater than the median net worth of homeowners in the same age group.Note
Data table for Chart 6
| Financial indicator | With a principal residence asset | Without a principal residence asset |
|---|---|---|
| 2016 constant dollars | ||
| Median assets | 526,544 | 32,800 |
| Median debt | 245,000 | 8,000 |
| Median net worth | 261,916 | 18,400 |
| Median after-tax income | 84,100 | 43,455 |
| Source: Statistics Canada, Survey of Financial Security, 2016. | ||
Millennials had higher education and higher student debt
Millennials are now the most educated generation, as about 70% of those between 30 and 34, years old had a post-secondary certificate, diploma or degree, compared to about 55% of Gen-Xers at the same age. Higher educational attainment was accompanied by higher student debt, as young millennials carried more student debt than previous generations at the same age. For example, 24.4% of young millennial households (age 30-34) carried student debt in 2016, with a median value of $12,000 among student-debt-holding families. This compares to 14.8% and $9,675 respectively for Generation-X families at the same age in 1999. Though student debt rose for millennials compared to previous generations, the share of total debt was relatively small, about 1/25 the size of their average mortgage debt.Note
Although they had higher student debt, millennials with a university education were still in a better financial position as their net worth reached $116,000, compared to $34,100 for millennials this age with a high school degree (or less). Again, housing provides insights on the disparities in net worth for millennials in terms of educational attainment, as those with a university education or a trades or college degree had higher principal residence values and mortgage debt than those with a high school degree.
Millennials in Toronto and Vancouver were relatively better off
Previous work has highlighted the divergence in debt levels and wealth across the country, reflecting higher median wealth in Vancouver and Toronto (Gellatly and Richards 2019). These disparities in wealth across the country were also observed for millennials. Median wealth was considerably higher for millennials living in Toronto or Vancouver, compared to those in Montreal or at the national level. Specifically, median net worth in 2016 reached $145,000 for millennials living in Toronto and $91,000 for those living in Vancouver, considerably lower than for those living in Montreal ($47,100).
At the top end of the net worth distribution, the disparities were even more prominent, as millennials living in Toronto or Vancouver were relatively wealthier. For example, millennials living in Toronto or Vancouver in the top 10% had accrued nearly $1 million in wealth. However, net worth for millennials in the top 10% at the national level reached $589,000 and $353,000 for those living in Montreal. These results indicate a considerably different financial outcomes for millennials across the country, which reflect differences in principal residence values across the country.Note For millennials living in Vancouver and Toronto, principal residence values reached $650,000, over double values at the national level ($320,000) or in Montreal ($275,000) (Chart 7).
Data table for Chart 7
| Canada and regions | Median value of principal residence |
|---|---|
| 2016 constant dollars | |
| Montreal | 275,000 |
| Toronto | 650,000 |
| Vancouver | 650,000 |
| Other CMA/CA | 315,000 |
| Non CMA/CA | 200,000 |
| Canada | 320,000 |
|
Note: CMA: census metropolitan area; CA: census area. Source: Statistics Canada, Survey of Financial Security, 2016. |
|
Summary
This study examined economic well-being across generations of young Canadians, evaluating how millennials have fared compared to previous generations at the same point in their life path. Canadian millennials had higher incomes and assets than young Gen-Xers at the same age. However, they were also more leveraged, as their debt to after-tax income levels surpassed 200%. Higher values for principal residences mainly explain the increases in net worth from one generation to the next, yet these were also coupled with more mortgage debt.
Millennials were relatively better off than young Gen-Xers in terms of median net worth. However, disparities in economic well-being became more exacerbated over time, reflecting a wide range of financial outcomes among this generation, as they begin to accumulate assets, debts and wealth. Those who entered the housing market had much higher levels of wealth, as did those with a university education. At the same time, millennials living in Toronto or Vancouver were in a stronger financial position, reflecting high levels of wealth at the top end of the net worth distribution, associated with higher principle residence values.
References
Gellatly, G. and Richards, E. 2019. “Indebtedness and wealth among Canadian households”. Economic Insights, no. 89. Statistics Canada. Catalogue no. 11-626-X. Ottawa: Statistics Canada.
Heisz, A. 2015. “Trends in Income Inequality and Canada and Elsewhere.” In David Green, W. Craig Riddell and France St-Hilaire (eds), Income Inequality, the Canadian Story: 77-102.
Kurz, Christopher, Geng Li, and Daniel J. Vine (2018). “Are Millennials Different?” Finance and Economics Discussion Series 2018-080. Washington: Board of Governors of the Federal Reserve System.
Morissette, R. 2018. “Wages for Young Workers up to the Age of 40”. Analytical Studies Branch Research Paper Series, no. 405. Statistics Canada. Catalogue no. 11F0019M. Ottawa: Statistics Canada.
Ostrovsky, Y. 2017. “Doing as Well as One’s Parents? Tracking Recent Changes in Absolute Income Mobility in Canada”. Economic Insights, no. 73. Statistics Canada. Catalogue no. 11-626-X. Ottawa: Statistics Canada.
Robson, J., and A. Loucks. 2018. Millennial Money: Financial Independence and Well-being for the Next Generation. Part 2: Research and Recommendations. Public Policy Forum. Available at: https://ppforum.ca/publications/millennial-money-financial-independence-and-well-being/ (accessed April 5, 2019).
Saez, E., and M.R. Veall. 2005. “The Evolution of High Incomes in Northern America: Lessons from Canadian Evidence.” The American Economic Review 95 (3): 831–849.
- Date modified: