
Canada at a Glance, 2022
Immigration
Did you know?
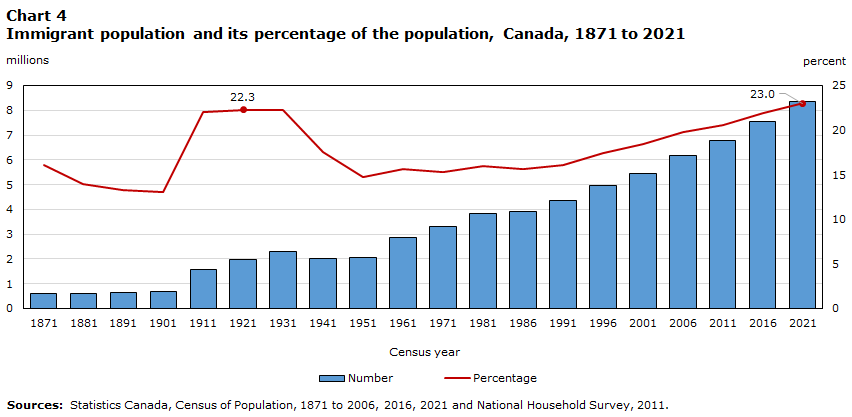
- In 2021, more than 8.3 million people or almost one in four people (23.0%) are or have been a landed immigrant or permanent resident in Canada. This is the highest proportion on record since Confederation, topping the previous record of 22.3% in 1921.
- In the past, the majority of immigrants in Canada came from Europe. In 2021, the majority of immigrants were born in Asia (including the Middle East) and an increasing share were coming from Africa.
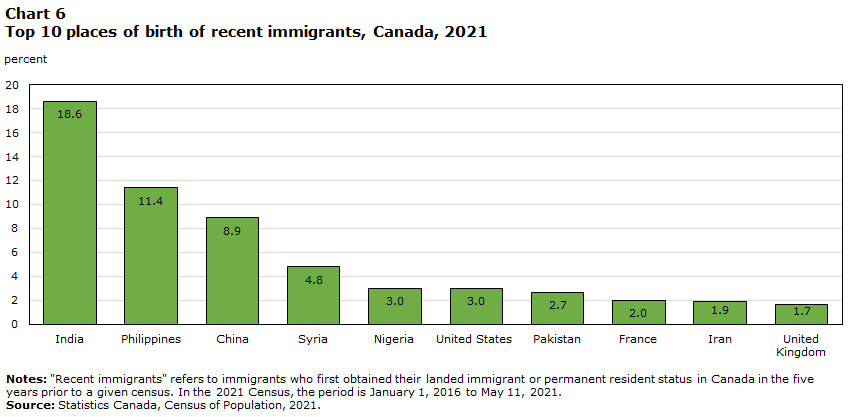
- In 2021, India is the country of birth of close to one in five recent immigrants (18.6%).
Data table for Chart 4
| Census year | Immigrant population | |
|---|---|---|
| number | percentage | |
| 1871 | 594,207 | 16.1 |
| 1881 | 602,984 | 13.9 |
| 1891 | 643,871 | 13.3 |
| 1901 | 699,500 | 13.0 |
| 1911 | 1,586,961 | 22.0 |
| 1921 | 1,955,736 | 22.3 |
| 1931 | 2,307,525 | 22.2 |
| 1941 | 2,018,847 | 17.5 |
| 1951 | 2,059,911 | 14.7 |
| 1961 | 2,844,263 | 15.6 |
| 1971 | 3,295,530 | 15.3 |
| 1981 | 3,843,335 | 16.0 |
| 1986 | 3,908,150 | 15.6 |
| 1991 | 4,342,890 | 16.1 |
| 1996 | 4,971,070 | 17.4 |
| 2001 | 5,448,480 | 18.4 |
| 2006 | 6,186,950 | 19.8 |
| 2011 | 6,775,770 | 20.6 |
| 2016 | 7,540,830 | 21.9 |
| 2021 | 8,361,505 | 23.0 |
| Sources: Statistics Canada, Census of Population, 1871 to 2006, 2016, 2021 and National Household Survey, 2011. | ||

Data table for Chart 5
Census year |
Region of birth | |||||
|---|---|---|---|---|---|---|
| Europe | United States | Caribbean, Bermuda, Central and South America | Africa | Asia (including the Middle East) | Oceania and others | |
| percent | ||||||
| 1871 | 88.4 | 10.9 | 0.0 | 0.0 | 0.0 | 0.7 |
| 1971 | 79.7 | 9.4 | 3.2 | 1.4 | 5.0 | 1.3 |
| 1981 | 66.7 | 7.8 | 7.3 | 2.6 | 14.1 | 1.5 |
| 1986 | 62.6 | 7.2 | 8.7 | 2.9 | 17.5 | 1.1 |
| 1991 | 54.4 | 5.7 | 10.4 | 3.8 | 24.6 | 1.1 |
| 1996 | 46.9 | 4.9 | 11.1 | 4.6 | 31.4 | 1.0 |
| 2001 | 42.0 | 4.4 | 11.0 | 5.2 | 36.5 | 1.0 |
| 2006 | 36.8 | 4.0 | 11.3 | 6.1 | 40.8 | 1.0 |
| 2011 | 31.4 | 3.9 | 11.7 | 7.3 | 44.9 | 0.8 |
| 2016 | 27.7 | 3.4 | 11.6 | 8.5 | 48.1 | 0.8 |
| 2021 | 22.5 | 3.9 | 11.5 | 9.9 | 51.4 | 0.8 |
| Sources: Statistics Canada, Census of Population, 1871 to 2006, 2016, 2021 and National Household Survey, 2011. | ||||||
Data table for Chart 6
| Place of birth | Recent immigrants |
|---|---|
| percentage | |
| India | 18.6 |
| Philippines | 11.4 |
| China | 8.9 |
| Syria | 4.8 |
| Nigeria | 3.0 |
| United States | 3.0 |
| Pakistan | 2.7 |
| France | 2.0 |
| Iran | 1.9 |
| United Kingdom | 1.7 |
|
Notes: "Recent immigrants" refers to immigrants who first obtained their landed immigrant or permanent resident status in Canada in the five years prior to a given census. In the 2021 Census, the period is January 1, 2016 to May 11, 2021. Source: Statistics Canada, Census of Population, 2021. |
|
To learn more
Immigration and ethnocultural diversity statistics (statcan.gc.ca)
- Date modified: