
Canada at a Glance, 2022
Population
| 2011 | 2016 | 2021 | 2011 to 2021 | |
|---|---|---|---|---|
| number | percent change | |||
| Canada | 33,476,688 | 35,151,728 | 36,991,981 | 10.5 |
| Newfoundland and Labrador | 514,536 | 519,716 | 510,550 | -0.8 |
| Prince Edward Island | 140,204 | 142,907 | 154,331 | 10.1 |
| Nova Scotia | 921,727 | 923,598 | 969,383 | 5.2 |
| New Brunswick | 751,171 | 747,101 | 775,610 | 3.3 |
| Quebec | 7,903,001 | 8,164,361 | 8,501,833 | 7.6 |
| Ontario | 12,851,821 | 13,448,494 | 14,223,942 | 10.7 |
| Manitoba | 1,208,268 | 1,278,365 | 1,342,153 | 11.1 |
| Saskatchewan | 1,033,381 | 1,098,352 | 1,132,505 | 9.6 |
| Alberta | 3,645,257 | 4,067,175 | 4,262,635 | 16.9 |
| British Columbia | 4,400,057 | 4,648,055 | 5,000,879 | 13.7 |
| Yukon | 33,897 | 35,874 | 40,232 | 18.7 |
| Northwest Territories | 41,462 | 41,786 | 41,070 | -0.9 |
| Nunavut | 31,906 | 35,944 | 36,858 | 15.5 |
| Source: Statistics Canada, 2011, 2016 and 2021 censuses of population. | ||||
Did you know?
- Out of all the provinces, the largest population changes between 2011 and 2021 were recorded in Alberta (+16.9%), British Columbia (+13.7%) and Manitoba (+11.1%).
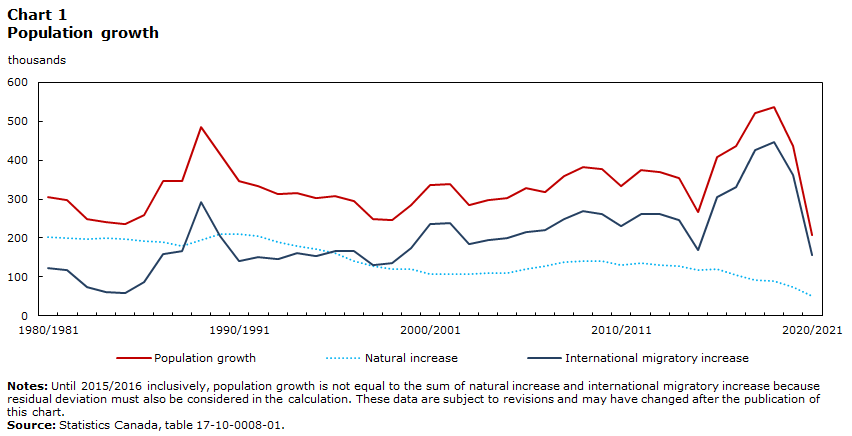
Data table for Chart 1
| Population growth | Natural increase | International migratory increase | |
|---|---|---|---|
| thousands | |||
| 1980/1981 | 304.25 | 201.60 | 122.71 |
| 1981/1982 | 297.03 | 200.12 | 118.53 |
| 1982/1983 | 249.51 | 197.07 | 74.05 |
| 1983/1984 | 240.60 | 200.37 | 61.91 |
| 1984/1985 | 235.06 | 197.18 | 59.50 |
| 1985/1986 | 258.16 | 192.03 | 86.30 |
| 1986/1987 | 346.32 | 190.42 | 158.57 |
| 1987/1988 | 345.15 | 180.12 | 167.70 |
| 1988/1989 | 485.03 | 195.63 | 292.07 |
| 1989/1990 | 414.36 | 210.67 | 206.35 |
| 1990/1991 | 346.28 | 210.49 | 140.05 |
| 1991/1992 | 333.84 | 206.14 | 151.89 |
| 1992/1993 | 313.50 | 190.37 | 147.25 |
| 1993/1994 | 315.90 | 179.70 | 160.32 |
| 1994/1995 | 301.65 | 172.61 | 153.16 |
| 1995/1996 | 307.91 | 162.69 | 167.55 |
| 1996/1997 | 295.73 | 140.09 | 165.62 |
| 1997/1998 | 249.23 | 127.44 | 131.77 |
| 1998/1999 | 246.11 | 120.66 | 135.43 |
| 1999/2000 | 284.44 | 119.68 | 174.77 |
| 2000/2001 | 335.17 | 107.99 | 236.70 |
| 2001/2002 | 339.18 | 107.66 | 237.94 |
| 2002/2003 | 283.95 | 106.62 | 183.75 |
| 2003/2004 | 296.63 | 108.93 | 194.13 |
| 2004/2005 | 303.10 | 109.36 | 200.15 |
| 2005/2006 | 327.42 | 120.59 | 216.09 |
| 2006/2007 | 317.85 | 127.09 | 219.75 |
| 2007/2008 | 358.09 | 137.17 | 249.99 |
| 2008/2009 | 381.78 | 141.58 | 269.18 |
| 2009/2010 | 375.99 | 142.24 | 262.75 |
| 2010/2011 | 334.44 | 131.46 | 230.98 |
| 2011/2012 | 374.89 | 136.43 | 260.56 |
| 2012/2013 | 368.73 | 129.95 | 260.82 |
| 2013/2014 | 354.48 | 129.23 | 247.29 |
| 2014/2015 | 265.47 | 117.15 | 170.35 |
| 2015/2016 | 406.58 | 121.49 | 304.05 |
| 2016/2017 | 435.75 | 105.64 | 330.11 |
| 2017/2018 | 519.85 | 92.99 | 426.86 |
| 2018/2019 | 536.15 | 89.98 | 446.17 |
| 2019/2020 | 435.98 | 73.42 | 362.56 |
| 2020/2021 | 208.90 | 52.40 | 156.50 |
|
Notes: Until 2015/2016 inclusively, population growth is not equal to the sum of natural increase and international migratory increase because residual deviation must also be considered in the calculation. These data are subject to revisions and may have changed after the publication of this chart. Source: Statistics Canada, table 17-10-0008-01. |
|||
Did you know?
- Population growth in 2020/2021 sharply decreased from previous years because of the COVID-19 pandemic and restrictions on international migration. Natural increase (births minus deaths) declined by 28.6% from 2019/2020 to 2020/2021, while international migration dropped by 131.7%.
| 2011 | 2021 | 2011 to 2021 | |
|---|---|---|---|
| number | percent change | ||
| Total population | 33,476,688 | 36,991,981 | 10.5 |
| Toronto | 5,583,064 | 6,202,225 | 11.1 |
| Montréal | 3,824,221 | 4,291,732 | 12.2 |
| Vancouver | 2,313,328 | 2,642,825 | 14.2 |
| Ottawa–Gatineau | 1,236,324 | 1,488,307 | 20.4 |
| Calgary | 1,214,839 | 1,481,806 | 22.0 |
| Edmonton | 1,159,869 | 1,418,118 | 22.3 |
| Québec | 765,706 | 839,311 | 9.6 |
| Winnipeg | 730,018 | 834,678 | 14.3 |
| Hamilton | 721,053 | 785,184 | 8.9 |
| Kitchener–Cambridge–Waterloo | 477,160 | 575,847 | 20.7 |
| Source: Statistics Canada, 2011 and 2021 censuses of population. | |||
Did you know?
- In 2020/2021, Ontario (-17,085) and Alberta (-11,831) experienced the largest net losses to interprovincial migration, with many out-migrants moving to British Columbia. British Columbia had the largest number of in-migrants in 2020/2021 (70,865).
- The Atlantic provinces all recorded a net gain from interprovincial migration in 2020/2021.

Data table for Chart 2
| 2001 | 2021 | |
|---|---|---|
| number | ||
| Territories | 173 | 932 |
| B.C. | 38,484 | 69,326 |
| Alta. | 16,406 | 40,053 |
| Sask. | 1,703 | 10,961 |
| Man. | 4,592 | 16,587 |
| Ont. | 148,654 | 198,530 |
| Que. | 37,604 | 50,301 |
| Atlantic region | 3,022 | 19,060 |
|
Note: These data are subject to revisions and may have changed after the publication of this chart. Source: Statistics Canada, table 17-10-0040-01. |
||
| 2016 | 2021 | 2016 to 2021 | |
|---|---|---|---|
| number | % change | ||
| Total populationTable 3 Note 1 | 34,767,255 | 36,620,955 | 5.3 |
| English | 22,162,870 | 23,376,200 | 5.5 |
| French | 6,943,800 | 7,044,855 | 1.5 |
| Mandarin | 462,890 | 530,945 | 14.7 |
| Punjabi (Panjabi) | 349,140 | 520,390 | 49.0 |
| Yue (Cantonese) | 400,215 | 393,430 | -1.7 |
| Spanish | 263,510 | 317,365 | 20.4 |
| Arabic | 223,540 | 285,915 | 27.9 |
| Tagalog (Pilipino, Filipino) | 213,790 | 275,045 | 28.7 |
| Persian languagesTable 3 Note 2 | 143,020 | 179,745 | 25.7 |
| Urdu | 128,785 | 158,040 | 22.7 |
| Other languagesTable 3 Note 3 | 3,475,695 | 3,539,025 | 1.8 |
|
|||
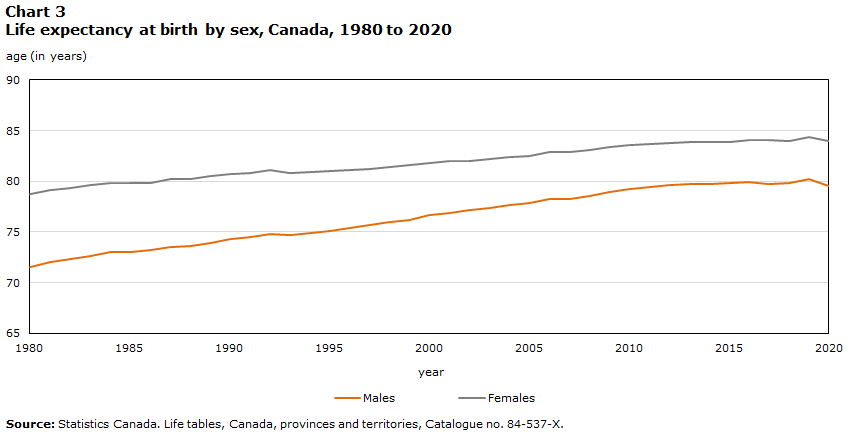
Data table for Chart 3
| year | Males | Females |
|---|---|---|
| age (in years) | ||
| 1980 | 71.59 | 78.79 |
| 1981 | 72.01 | 79.16 |
| 1982 | 72.33 | 79.29 |
| 1983 | 72.68 | 79.61 |
| 1984 | 73.01 | 79.82 |
| 1985 | 73.02 | 79.80 |
| 1986 | 73.22 | 79.87 |
| 1987 | 73.53 | 80.19 |
| 1988 | 73.61 | 80.27 |
| 1989 | 73.92 | 80.49 |
| 1990 | 74.30 | 80.73 |
| 1991 | 74.53 | 80.81 |
| 1992 | 74.76 | 81.07 |
| 1993 | 74.70 | 80.86 |
| 1994 | 74.94 | 80.95 |
| 1995 | 75.07 | 81.03 |
| 1996 | 75.43 | 81.15 |
| 1997 | 75.71 | 81.25 |
| 1998 | 75.97 | 81.41 |
| 1999 | 76.20 | 81.61 |
| 2000 | 76.64 | 81.82 |
| 2001 | 76.92 | 82.00 |
| 2002 | 77.16 | 82.02 |
| 2003 | 77.32 | 82.23 |
| 2004 | 77.68 | 82.42 |
| 2005 | 77.82 | 82.52 |
| 2006 | 78.29 | 82.91 |
| 2007 | 78.29 | 82.91 |
| 2008 | 78.51 | 83.05 |
| 2009 | 78.91 | 83.33 |
| 2010 | 79.21 | 83.54 |
| 2011 | 79.39 | 83.68 |
| 2012 | 79.61 | 83.82 |
| 2013 | 79.74 | 83.85 |
| 2014 | 79.76 | 83.91 |
| 2015 | 79.84 | 83.89 |
| 2016 | 79.92 | 84.03 |
| 2017 | 79.75 | 84.02 |
| 2018 | 79.80 | 83.99 |
| 2019 | 80.18 | 84.38 |
| 2020 | 79.49 | 83.96 |
| Source: Statistics Canada. Life tables, Canada, provinces and territories, Catalogue no. 84-537-X. | ||
Did you know?
- Life expectancy in Canada has increased significantly since 1980, and the gap between men and women has narrowed.
To learn more
Population and demography statistics (statcan.gc.ca)
- Date modified: