
Analysis in Brief
Analysis on small businesses in Canada, first quarter of 2022
by Stephanie Tam, Shivani Sood and Chris Johnston
Skip to text
Text begins
Small- and medium-sized businesses are significant contributors to the Canadian economy. For context, in 2021, small businesses made up 98.1% of all employer businesses in Canada.Note In addition, small businesses employed 10.3 million individuals in Canada – almost two-thirds (63.8%) of the total labour force. By comparison, medium-sized businesses employed 3.4 million individuals (21.1% of the labour force) and large businesses employed 2.4 million individuals (15.1% of the labour force).Note As such, small businesses play an important role in employing Canadians and are a significant driver towards economic recovery.
From the beginning of January to early February 2022, Statistics Canada conducted the Canadian Survey on Business Conditions to better understand the current environment businesses in Canada are operating in and their expectations moving forward. Based on the results of the survey, small businesses were less likely to have a positive future outlook. These businesses were also more likely to expect a decrease in profitability and sales, and were less likely to expect demand for their goods and services to increase over the next three months, compared with larger businesses. Small businesses were less likely to increase employment, be able to take on more debt, and have the liquid assets to operate. This article provides insights on the expectations of small businesses as well as the unique conditions faced by these businesses.
Outlook for smaller businesses less positive than their larger counterparts
Small businesses were more likely to have lower revenues in 2021 compared with 2019. Over half (53.6%) of businesses with 1 to 19 employees reported lower revenues in 2021 compared with 2019. In contrast, over two-fifths (41.4%) of businesses with 20 to 99 employees and over one-third (34.5%) of businesses with 100 or more employees reported lower revenues.
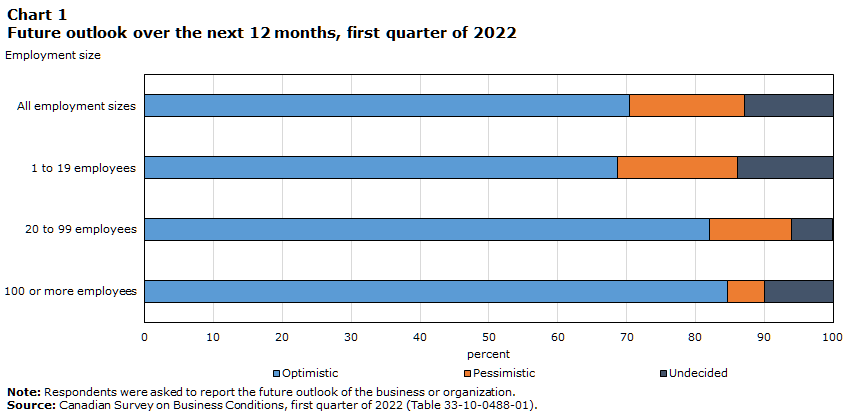
Furthermore, smaller businesses were less likely to have an optimistic future outlook over the next 12 months. Two-thirds (68.7%) of businesses with 1 to 19 employees reported having a positive future outlook over the next 12 months, while over four-fifths of businesses with 20 to 99 employees (82.0%) and 100 or more employees (84.6%) had the same outlook.
Data table for Chart 1
| Employment size | Optimistic | Pessimistic | Undecided |
|---|---|---|---|
| percent | |||
| All employment sizes | 70.4 | 16.7 | 12.9 |
| 1 to 19 employees | 68.7 | 17.4 | 13.9 |
| 20 to 99 employees | 82.0 | 11.9 | 6.0 |
| 100 or more employees | 84.6 | 5.4 | 10.0 |
|
Note: Respondents were asked to report the future outlook of the business or organization. Source: Canadian Survey on Business Conditions, first quarter of 2022 (Table 33-10-0488-01). |
|||
Small business expectations about sales down since last quarter
Small businesses were more likely to expect a decrease in sales in the short term. Nearly one-fifth of businesses with 1 to 19 employees (18.4%) expected to see a decrease in sales over the next three months,Note while less than one in ten businesses with 20 to 99 employees (9.4%) and 100 or more employees (7.8%) expected the same. These figures are similar to last quarter, where one-fifth (19.8%) of businesses with 1 to 19 employees, 13.4% of businesses with 20 to 99 employees, and 9.7% of businesses with 100 or more employees expected a decrease in sales over the next three months.
| Increase | Stay about the same |
Decrease |
Not applicable |
|
|---|---|---|---|---|
| (% of businesses) | ||||
| All employment sizes | 19.8 | 59.6 | 17.2 | 3.5 |
| 1 to 19 employees | 18.0 | 60.4 | 18.4 | 3.2 |
| 20 to 99 employees | 31.5 | 53.5 | 9.4 | 5.5 |
| 100 or more employees | 31.7 | 55.7 | 7.8 | 4.8 |
|
Note: Respondents were asked between January 4 to February 7, 2022 how their sales were expected to change over the next three months. Therefore, the three month period could range from January 4 to May 7, 2022, depending on when the business responded.
Source: Canadian Survey on Business Conditions, first quarter of 2022 (Table 33-10-0468-01). |
||||
Small businesses were less likely to expect demand for their goods and services to increase over the next three months. Nearly one-quarter (24.5%) of businesses with 1 to 19 employees expected an increase in demand for their goods and services over the next three months, while close to one-fifth (38.3%) of businesses with 20 to 99 employees and over one-third (34.4%) of businesses with 100 or more employees expected the same.
Over one-third (35.6%) of businesses with 1 to 19 employees and over one-quarter (28.9%) of businesses with 20 to 99 employees expected to see a decrease in profitability, compared with just under one-fifth (19.6%) of businesses with 100 or more employees. These numbers have increased from last quarter, when the numbers were 34.8%, 26.3%, and 19.0%, respectively.
| Increase | Stay about the same |
Decrease |
Not applicable |
|
|---|---|---|---|---|
| (% of businesses) | ||||
| All employment sizes | 12.9 | 49.6 | 34.6 | 2.9 |
| 1 to 19 employees | 12.1 | 49.6 | 35.6 | 2.7 |
| 20 to 99 employees | 18.1 | 48.7 | 28.9 | 4.4 |
| 100 or more employees | 18.4 | 56.7 | 19.6 | 5.3 |
|
Note: Respondents were asked between January 4 to February 7, 2022 how their profitability was expected to change over the next three months. Therefore, the three month period could range from January 4 to May 7, 2022, depending on when the business responded. Source: Canadian Survey on Business Conditions, first quarter of 2022 (Table 33-10-0468-01). |
||||
Small businesses more likely to have financial constraints than their larger counterparts
As the current business environment continues to evolve, businesses sought external financing in order to survive. As a result, some businesses have now reached a point where they do not have the ability to take on more debt. Smaller businesses were more likely to report this being the case. At the same time, smaller businesses were more likely to expect maintaining sufficient cash flow to be an obstacle and less likely to have the cash or liquid assets required to operate.
Over one-quarter (26.9%) of businesses with 1 to 19 employees reported that they did not have the ability to take on more debt. In contrast, 16.7% of businesses with 20 to 99 employees and 6.2% of businesses with 100 or more employees reported the same. These figures are slightly higher than last quarter, where one-fifth (20.6%) of businesses with 1 to 19 employees, 11.9% of businesses with 20 to 99 employees, and 5.5% of businesses with 100 or more employees reported they could not take on more debt.

Data table for Chart 2
| Employment size | Business can take on more debt | Business cannot take on more debt | Ability of business to take on more debt is unknown |
|---|---|---|---|
| percent | |||
| All employment sizes | 53.1 | 25.4 | 21.5 |
| 1 to 19 employees | 51.4 | 26.9 | 21.6 |
| 20 to 99 employees | 64.2 | 16.7 | 19.1 |
| 100 or more employees | 63.8 | 6.2 | 30.1 |
|
Note: Respondents were asked if the business or organization had the ability to take on more debt. Source: Canadian Survey on Business Conditions, first quarter of 2022 (Table 33-10-0483-01). |
|||
Around one-fifth of businesses with 1 to 19 employees (22.9%) and 20 to 99 employees (18.3%) expected maintaining sufficient cash flow to be an obstacle over the next three months. Conversely, 8.7% of businesses with 100 or more employees reported similar concerns.
Three-quarters (75.8%) of businesses with 1 to 19 employees reported that they had the cash or liquid assets required to operate, while over four-fifths of businesses with 20 to 99 employees (82.3%) and 100 or more employees (82.5%) said the same.
Small businesses less likely to increase employment
While 11.9% of businesses with 1 to 19 employees expected an increase in the number of employees over the next three months, over one-quarter (27.8%) of businesses with 20 to 99 employees and over one-third (34.4%) of businesses with 100 or more employees said the same. Additionally, 7.5% of businesses with 1 to 19 employees expected the number of vacant positions to increase, in comparison with one-fifth (20.6%) of businesses with 20 to 99 employees and over one-quarter (27.8%) of businesses with 100 or more employees.
Smaller businesses were less likely to expect labour challenges over the next three months. Nearly one-third (32.9%) of businesses with 1 to 19 employees expected the shortage of labour force to be an obstacle over the next three months, while around two-thirds of businesses with 20 to 99 employees (64.0%) and 100 or more employees (69.1%) said the same. Around three in ten businesses with 1 to 19 employees expected recruiting (34.9%) and retaining (27.3%) skilled employees to be an obstacle over the next three months. In contrast, a larger proportion of businesses with 20 to 99 employees (61.1% and 49.8% respectively) and 100 or more employees (69.4% and 58.7% respectively) had the same expectations.

Data table for Chart 3
| Employment size | Shortage of labour force | Recruiting skilled employees | Retaining skilled employees |
|---|---|---|---|
| percent | |||
| All employment sizes | 37.0 | 38.5 | 30.4 |
| 1 to 19 employees | 32.9 | 34.9 | 27.3 |
| 20 to 99 employees | 64.0 | 61.1 | 49.8 |
| 100 or more employees | 69.1 | 69.4 | 58.7 |
|
Note: Respondents were asked if the business or organization expected various obstacles over the next three months. Source: Canadian Survey on Business Conditions, first quarter of 2022 (Table 33-10-0469-01). |
|||
Smaller businesses were less likely to have various recruitment, retention and training plans over the next 12 months in comparison with larger businesses. Over two-fifths (42.1%) of businesses with 1 to 19 employees plan to increase wages offered to existing employees over the next 12 months, while a larger proportion of businesses with 20 to 99 employees (65.3%) and 100 or more employees (56.0%) said the same. Furthermore, 5.0% of businesses with 1 to 19 employees plan to offer signing bonuses or incentives to new employees, in contrast with 13.3% of businesses with 20 to 99 employees and 17.0% of businesses with 100 or more employees. Additionally, one in ten (11.2%) businesses with 1 to 19 employees and 15.5% of businesses with 20 to 99 employees plan to offer employees the option to work remotely, compared with over one-quarter (28.2%) of businesses with 100 or more employees. Lastly, 8.3% of businesses with 1 to 19 employees plan to provide tuition support to employees to take courses or programs, in comparison with 14.7% of businesses with 20 to 99 employees and 23.5% of businesses with 100 or more employees.
Methodology
From January 4 to February 7, 2022, representatives from businesses across Canada were invited to take part in an online questionnaire about business conditions and business expectations moving forward. The Canadian Survey on Business Conditions uses a stratified random sample of business establishments with employees classified by geography, industry sector, and size. An estimation of proportions is done using calibrated weights to calculate the population totals in the domains of interest. The total sample size for this iteration of the survey is 35,026 and results are based on responses from a total of 17,695 businesses and organizations.
References
Statistics Canada. (2022). Canadian Survey on Business Conditions, first quarter of 2022.
- Date modified: