
Gross domestic product by industry, March 2026
Released: 2026-05-29
March 2026
-0.1% 
(monthly change)
Real gross domestic product (GDP) edged down 0.1% in March, partially offsetting February's increase (+0.2%) and driven by contractions in goods-producing industries.
Chart 1

Real gross domestic product edges down in March
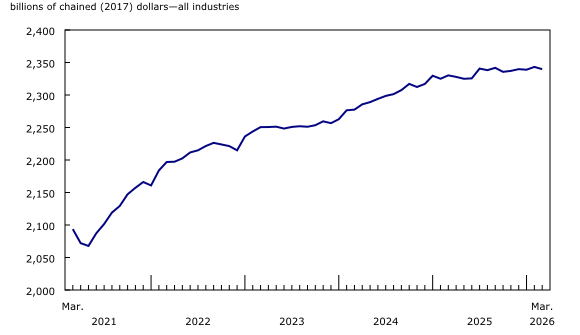
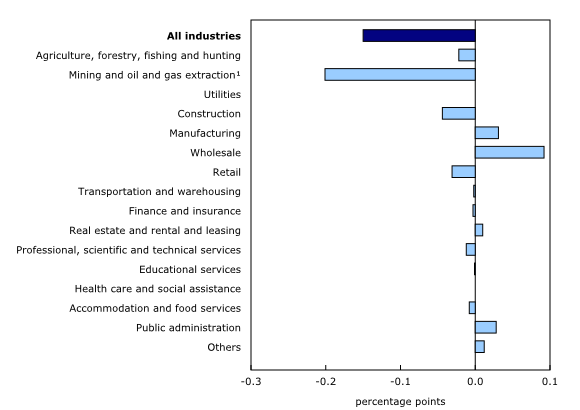
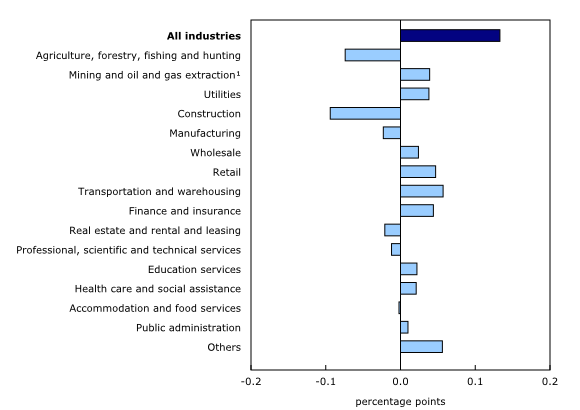
Goods-producing industries contracted 0.8% in March, more than offsetting February's expansion. This was the fifth decline in the last six months. The decrease in March was in large part a reflection of lower activity in the mining, quarrying, and oil and gas extraction sector and in the construction sector. Services-producing industries tempered the decline, edging up 0.1% in March, led by an increase in wholesale trade. Overall, 8 of the 20 industrial sectors contracted in March.
Mining, quarrying, and oil and gas extraction contracts in March
Mining, quarrying, and oil and gas extraction decreased 2.1% in March, driven by contractions in most comprising subsectors.
Chart 2
Mining, quarrying, and oil and gas extraction sector contracts in March
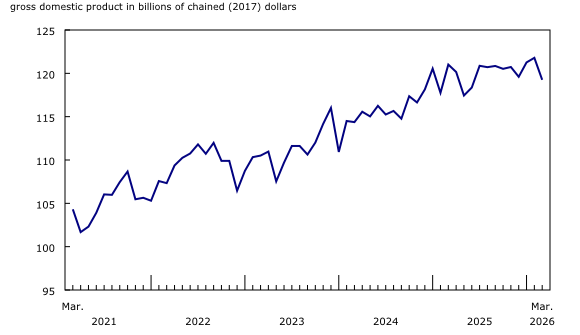
Oil and gas extraction decreased 2.0% in March on a broad-based decline across industries. Oil and gas extraction (except oil sands) was down 2.3%, the largest drop in over a year, as lower crude petroleum extraction in the Western provinces and Atlantic Canada contributed to the decline. Lower natural gas extraction further contributed to the decrease in March.
Oil sands extraction was down 1.6% in March, reflecting lower synthetic crude production in Alberta. This was the third decrease in oil sands extraction in four months. Several factors weighed on the overall output in March, including longer than anticipated maintenance and repairs at some upgrading facilities, natural gas supply disruptions to these facilities, along with inclement weather across the Prairies. Pipeline transportation contracted 1.2% in March, down for the fourth month in a row. Lower pipeline transportation of natural gas (-2.8%) led the decline due to lower deliveries to the oil extraction facilities in northern Alberta and lower overall natural gas distribution (-2.2%). Crude oil and other pipeline transportation rose 0.4% in March.
Mining and quarrying (except oil and gas) decreased 3.9% in March on widespread contractions across all comprising industry groups. Coal mining (-13.9%) led the decline, as extraction of coal dropped in Alberta and British Columbia, coinciding with lower train carloadings and exports of the product.
Metal ore mining (-3.0%) contracted for the fourth consecutive month in March, driven by decreased copper, nickel, lead and zinc ore mining (-9.5%), coinciding with lower exports of copper ores and concentrates in the month. Decreased activity in gold and silver ore mining (-1.9%) further contributed to the decline, coinciding with falling gold market prices in March.
Construction down for the second month in a row
The construction sector decreased 0.6% in March on weaknesses in most comprising subsectors, following a sharp decline in February (-1.5%).
Engineering and other construction activities (-0.9%) and residential building construction activity (-0.8%) contributed the most to the decline in the construction sector in March. Construction activity in most residential building types fell in the month, with alteration and improvement activities and construction of single occupancy and apartment-type buildings contributing the most to the decline.
Retail trade down in March
The retail trade sector contracted 0.6% in March, partially offsetting the back-to-back monthly expansions in January and February.
General merchandise retailers (-2.7%) contributed the most to the decline in the sector in March, the first contraction in six months. Retailing activity at building material and garden equipment and supplies dealers (-3.0%) was another large contributor to the decline. Gasoline stations and fuel vendors (-1.9%) further added to the decline in the retail trade sector, coinciding with a jump in gas prices, arising from the supply shock caused by the conflict in the Persian Gulf.
Wholesale trade up on the largest back-to-back monthly growth rates in over four years
Following a 1.4% expansion in February, the wholesale trade sector rose 1.8% in March as most activities expanded in the month. This marked the sector's largest single-month growth since May 2023.
Chart 3
Wholesale trade grows in March
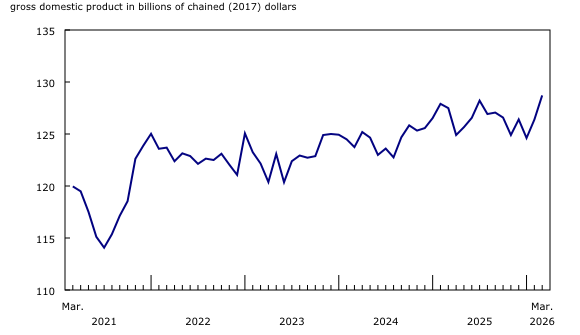
Increased wholesaling activity in machinery, equipment and supplies (+6.4%) led the growth in March, coinciding with new product releases and deliveries to government clients.
Public sector rises in March
The public sector aggregate (comprising educational services, health care and social assistance, and public administration) edged up 0.1% in March, driven by an increase in public administration.
Following back-to-back monthly declines, public administration increased 0.4% in March, led by expansion in local, municipal and regional public administration (+0.6%) and provincial and territorial public administration (+0.5%). The federal government public administration was essentially unchanged in the month, as a decrease in public administration (except defence) (-0.3%) was offset by higher activity in defence services (+1.0%).
Arts, entertainment and recreation grows following Olympic break while special events viewership contracts
Performing arts, spectator sports and related industries, and heritage institutions rose 6.9% in March, led by a rebound in spectator sports as the National Hockey League (NHL) resumed its regular schedule following the suspension of play in February to allow some of its players to compete for their countries in the Olympic games.
At the same time, information and cultural industries contracted 0.2% in March. Lower activity in the month at radio and television broadcasting stations (-13.4%) followed a spike in February, which coincided with the airing of the 2026 Winter Olympics.
Chart 4
Main industrial sectors' contribution to the percent change in gross domestic product in March
Advance estimate for real gross domestic product by industry for April 2026
Advance information indicates that real GDP increased 0.4% in April. Increases in mining, quarrying, and oil and gas extraction, manufacturing and transportation and warehousing were partially offset by decreases in agriculture, forestry, fishing and hunting. Owing to its preliminary nature, this estimate will be updated on June 30, 2026, with the release of the official GDP by industry data for April.
First quarter of 2026
GDP by industry edged up 0.1% in the first quarter of 2026, as increases in services-producing industries (+0.3%) more than offset declines in goods-producing industries (-0.4%). This follows a decline of 0.1% in the fourth quarter of 2025.
Transportation and warehousing (+1.2%) was one of the largest positive contributors to the quarterly increase in the first quarter of 2026. This was the largest quarterly increase in transportation and warehousing since the third quarter of 2023. Most subsectors posted increases in the first quarter of 2026, with postal service, couriers and messengers (+7.3%) contributing the most to the expansion, as postal service (+16.2%) rebounded from the Canada Post strike that occurred at the end of 2025.
Information and cultural industries rose 1.6% in the first quarter of 2026, driven up by computing infrastructure providers, data processing, web hosting, and related services (+4.4%), its second consecutive quarterly expansion. Software publishers (+2.5%) further contributed to the sector's growth.
Retail trade rose 1.0% in the first quarter, with health and personal care retailers (+3.5%) and general merchandise stores (+3.2%) contributing the most to the sector's quarterly growth.
The mining, quarrying and oil and gas extraction sector expanded 0.4% in the first quarter of 2026, offsetting most of the 0.4% contraction in the fourth quarter of 2025. Leading the growth in the first quarter of 2026 was higher oil and gas extraction (except oil sands) in Saskatchewan and off Canada's Atlantic Coast. An increase in natural gas extraction across the country further added to the growth. Tempering the growth was a 1.5% contraction in oil sands extraction due to longer than anticipated maintenance and repairs at some upgrading facilities in Northern Alberta, along with a frigid start to the year across the Prairies.
The utilities sector increased 1.9% in the first quarter with electric power generation, transmission and distribution (+2.6%) leading the growth. Improving drought conditions in certain parts of the country and the restart of a nuclear generating station in Ontario, following a period of refurbishment, contributed to the increase.
The construction sector (-1.3%) was the largest detractor to growth in the first quarter. Engineering and other construction activities (-4.2%) and residential building construction (-0.4%) both contributed to the decline for a second consecutive quarter. The decline in engineering and other construction activities brought this subsector to its lowest level since the first quarter of 2025, while residential building construction fell to its lowest level since the third quarter of 2024.
Agriculture, forestry, fishing and hunting fell 3.5% in the first quarter of 2026, the sector's first contraction since the third quarter of 2023. Crop production (-4.7%) was the main driver behind the decrease in the first quarter of 2026, reflecting lower expected yields for the year.
The manufacturing sector edged down 0.3% in the first quarter of 2026, representing its second consecutive quarterly decline and the fourth decline in the last six quarters. Decreases in non-durable goods manufacturing (-0.4%) and durable goods manufacturing (-0.2%) drove the decline in the first quarter. Several major auto assembly plants in Ontario extended their winter shutdowns in the early parts of the quarter, resulting in reduced auto production and contributing to the decline in motor vehicles and parts manufacturing (-5.8%). Petroleum and coal product manufacturing (-3.3%) contributed the most to the decrease in non-durable goods manufacturing, as maintenance work at some refineries resulted in lower production.
Chart 5
Main industrial sectors' contribution to the percent change in gross domestic product in the first quarter
Sustainable development goals
On January 1, 2016, the world officially began implementing the 2030 Agenda for Sustainable Development—the United Nations' transformative plan of action that addresses urgent global challenges over the following 15 years. The plan is based on 17 specific sustainable development goals.
The release on gross domestic product by industry is an example of how Statistics Canada supports monitoring the progress of global sustainable development goals. This release will be used to help measure the following goal:

Note to readers
General information
Monthly data on gross domestic product (GDP) by industry at basic prices are chained volume estimates with 2017 as the reference year. This means that the data for each industry and each aggregate are obtained from a chained volume index multiplied by the industry's value added in 2017. The monthly data are benchmarked to annually chained Fisher volume indexes of GDP obtained from the constant-price supply and use tables (SUTs) up to the latest SUTs year (2022).
For the period starting in January 2023, data are derived by chaining a fixed-weight Laspeyres volume index to the prior period. The fixed weights are 2022 industry current price estimates.
Statistics Canada also produces expenditure-based GDP estimates at market prices, which are chained quarterly based on a Fisher volume index. Due to conceptual and statistical differences, GDP by industry and GDP by expenditure percent change estimates can diverge slightly.
All data in this release are seasonally adjusted. For information on seasonal adjustment, see Seasonal adjustment: Concepts and interpretation, 2026.
An advance estimate of industrial production for April 2026 is available upon request.
For more information on GDP, see the video "What is Gross Domestic Product (GDP)?."
For more information on the impact of tariffs on key economic statistics, please consult: "How tariffs are conceptually reflected in key economic statistics."
Revisions
Each month, newly available administrative and survey data from various industries in the economy are integrated, resulting in statistical revisions. Updated and revised administrative data (including taxation statistics), new information provided by respondents to industry surveys, and standard changes to seasonal adjustment calculations are incorporated with each release.
With this release of monthly GDP by industry, revisions have been made back to January 2025.
To satisfy the opposing goals for both timeliness and accuracy, Statistics Canada regularly updates (revises) its estimates of GDP. For more information about GDP revision cycles, please consult the "Revisions to Canada's GDP" article in the Latest Developments in the Canadian Economic Accounts (13-605-X).
Real-time table
Real-time table 36-10-0491-01 will be updated on June 8, 2026.
Next release
Data on real GDP by industry for April 2026 will be released on June 30, including an advance estimate for the May 2026 reference month.
Products
The User Guide: Canadian System of Macroeconomic Accounts (13-606-G) is available.
The Methodological Guide: Canadian System of Macroeconomic Accounts (13-607-X) is also available.
The Economic accounts statistics portal, accessible from the Subjects module of the Statistics Canada website, features an up-to-date portrait of national and provincial economies and their structure.
Contact information
For more information, or to enquire about the concepts, methods or data quality of this release, contact us (toll-free 1-800-263-1136; 514-283-8300; infostats@statcan.gc.ca) or Media Relations (statcan.mediahotline-ligneinfomedias.statcan@statcan.gc.ca).
- Date modified: