
Railway carloadings, March 2026
Released: 2026-05-25
32.5 million metric tonnes
March 2026
-2.5% 
(12-month change)
Highlights
In March, Canadian railways transported 32.5 million tonnes of freight, down 2.5% compared with March 2025, driven by declines in coal and wheat.
Freight traffic volume in March 2026 was just below the five-year average of 32.9 million tonnes for the month of March. During the first quarter of 2026, the cumulative volume reached 93.0 million tonnes, slightly higher (+0.7%) than the same three-month period in 2025.
Consult the Rail Data Visualization Hub to explore monthly and annual rail statistics in an interactive format.
Chart 1

Railway carloadings, total tonnage
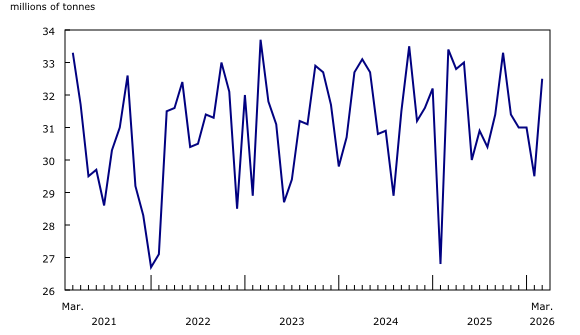
The decline in total freight carried in March 2026 reflected a lower volume of domestic traffic, both non-intermodal loadings (mainly commodities) and intermodal loadings (mainly containers).
Carloadings of coal down sharply
In March 2026, non-intermodal freight loadings in Canada were down 2.8% year over year to 25.8 million tonnes, led by a sharp decline in carloadings of coal.
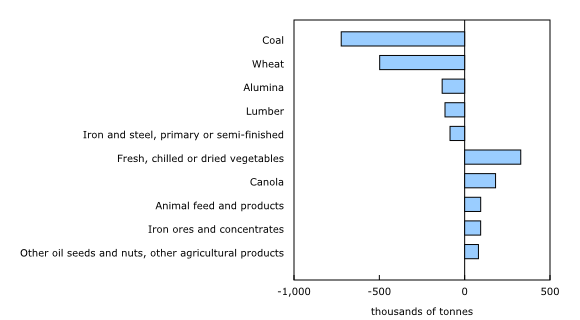
Loadings of coal dropped by 20.7% (-723 000 tonnes) in March 2026 compared with the same month in 2025. This was the largest monthly drop in tonnage in more than four years.
Wheat shipments by rail followed suit, down 17.1% (-498 000 tonnes) from March 2025 to March 2026, following a year-over-year gain of 16.1% in February.
In addition, loadings of alumina have declined year over year for five straight months, falling 32.3% (-132 000 tonnes) in March 2026, the largest such decrease since May 2020.
Chart 2
Railway carloadings, largest commodity differences, March 2025 to March 2026
Carloadings of some agricultural products temper declines
The tonnage declines in March 2026 were partly offset by increases in two agricultural products.
Carloadings of fresh chilled or dried vegetables posted a year-over-year increase for the fourth consecutive month, rising by 329 000 tonnes in March, almost twice the volume recorded in March 2025.
Rail shipments of canola were up by 18.8% (+181 000 tonnes) in March 2026 compared with March 2025, following a substantial year-over-year increase in February (+59.1%).
Intermodal traffic lagging
Following a year-over-year increase of 15.8% in February, intermodal shipments—mainly containers—originating in Canada fell 4.4% to 3.2 million tonnes in March 2026.
This decline coincided with year-over-year declines in both exports and imports of consumer goods.
American freight up
In March 2026, freight traffic received from connections with US railways saw a year-over-year increase for the second straight month. It rose 2.3% to 3.5 million tonnes, although it remained below the five-year average of 3.9 million tonnes for the month.
Focus on Canada and the United States
Over 2023 and 2024, freight loadings from US rail connections into Canada represented an average of 12.0% of total rail tonnage each month. In 2025, this share averaged 10.4% of total monthly rail tonnage. This proportion edged up to a monthly average of 10.9% during the first quarter of 2026.
Statistics Canada continues to monitor potential impacts of tariffs on railway carloading statistics.
For more data and insights on areas touched by the socio-economic relationship between Canada and the United States, see the Focus on Canada and the United States web page.
Note to readers
The Monthly Railway Carloadings Survey collects data on the number of rail cars, tonnage, units and 20-feet equivalent units from railway transporters operating in Canada that provide for-hire freight services.
Cargo loadings from Armstrong, Ontario, to the Atlantic Coast are classified to the eastern division (Eastern Canada), while loadings from Thunder Bay, Ontario, to the Pacific Coast are classified to the western division (Western Canada).
Survey data are revised on a monthly basis to reflect new information.
The data in this release are not seasonally adjusted.
The Transportation Data and Information Hub, featuring data from Statistics Canada, Transport Canada and partners, provides Canadians with online access to comprehensive statistics and indicators for the country's transportation sector.
Contact information
For more information, or to enquire about the concepts, methods or data quality of this release, contact us (toll-free 1-800-263-1136; 514-283-8300; infostats@statcan.gc.ca) or Media Relations (statcan.mediahotline-ligneinfomedias.statcan@statcan.gc.ca).
- Date modified: