Non-profit institutions and volunteering: Economic contribution, first quarter to fourth quarter 2023
Released: 2024-03-28
Real gross domestic product of non-profit institutions edges up
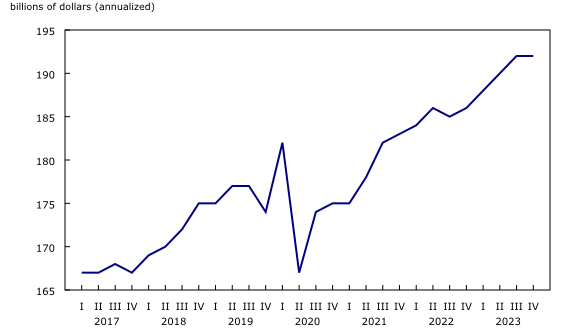
Real gross domestic product (GDP) of non-profit institutions edged up 0.1% in the fourth quarter, after rising 0.8% in the third quarter. Increases in real GDP of non-profits serving households and businesses was largely offset by a decline in real GDP of non-profits serving governments. In comparison, economy-wide real GDP edged up 0.2% in the fourth quarter.
Real gross domestic product of non-profits serving households and businesses lead the rise
Real GDP of non-profits serving households grew 1.1% in the fourth quarter, as reliance on non-profit services by families and individuals increased, partly owing to a faster rise in cost-of-living compared with income gains of the lowest-income households. This was apparent in the Distributions of household economic accounts for the third quarter, which showed a decline in the net savings of the lowest-income households. Households in this category tend to rely more on non-profit services, including food banks.
In the fourth quarter, real GDP of non-profit institutions serving businesses rose 0.9%, the fourth consecutive quarterly increase.
These increases in real GDP of non-profit institutions serving households and businesses were largely offset by a 0.2% decline in real GDP of non-profits serving governments. Real GDP of non-profit institutions, excluding those serving governments, grew 1.0% in the fourth quarter, increasing for the fourth consecutive quarter.
In 2023, the real GDP of non-profit institutions rose 2.7%, with non-profits serving governments (+3.1%), households (+1.6%), and businesses (+2.0%) all increasing.
Jobs in non-profit institutions continue to rise
Driven by jobs increased in health care and social services, jobs in non-profit institutions rose 0.8% in the fourth quarter, the fifth consecutive quarterly increase. The number of jobs in health care rose 1.4% in the fourth quarter following a 1.9% increase in the third quarter. On an annual basis, jobs in health care rose 5.9% in 2023 compared with 2022, one of the highest yearly increases among all activities in the non-profit sector.
Jobs in social services rose by 2.6% in the fourth quarter of 2023. Although the number of jobs increased, job vacancies remained unchanged in social services and health care activities.
Nominal gross domestic product rises owing to higher prices
The nominal GDP of non-profit institutions rose by 0.8% in the fourth quarter, largely driven by higher post-secondary tuition fees and rising health care costs.
For non-profits excluding those serving governments, nominal GDP recorded a similar increase to the third quarter, up 1.4% in the fourth quarter. Overall, non-profit institutions represented 8.3% of the economy-wide nominal GDP in the fourth quarter, while non-profits excluding government represented 2.2%.
On an annual basis, nominal GDP of non-profits rose 6.6% in 2023, compared with a 2.7% increase in real GDP, owing to significantly higher prices. Health care (+7.3%) recorded the largest increase in nominal GDP in 2023.
Did you know we have a mobile app?
Get timely access to data right at your fingertips by downloading the StatsCAN app, available for free on the App Store and on Google Play.
Note to readers
In this release, new benchmark values from the supply-use tables for the 2020 reference year have been incorporated. As a result, non-profit indicators have been revised from the first quarter of 2020 to the fourth quarter of 2022, and new data for the first quarter to the fourth quarter of 2023 were provided.
Volume and price estimates for the quarterly and annual non-profit gross domestic product have been updated to 2017 (2017=100) reference year. All data are directly comparable with the estimates in the Canadian System of Macroeconomic Accounts.
For the purposes of these estimates, the definition of the non-profit sector adheres to international standards published in the United Nations' Satellite Account on Non-profit and Related Institutions and Volunteer Work. Canada's overall non-profit sector is divided into the following three broad categories:
Community non-profit institutions primarily provide goods and services to households and communities for free or at prices that are substantially lower than the production costs. Common examples include various social and religious organizations, including food banks and churches. These organizations are classified as non-profit institutions serving households in the core economic accounts.
Business non-profit institutions primarily sell goods and services to households and businesses at a price that usually covers the production cost. Common examples include business associations, chambers of commerce and condominium associations. These organizations are combined with the business sector in the core economic accounts.
Government non-profit institutions are funded and monitored by government, though they are institutionally independent. They provide goods and services to households, or to the society as a whole and usually collect some fees that are well below their production costs. Common examples include hospitals, some residential care facilities, universities, and colleges. These are classified as government institutions in the core economic accounts.
Products
The data visualization product "Quarterly Non-Profit Institutions Economic Account: Interactive tool," which is part of Statistics Canada – Data Visualization Products (71-607-X), is available.
As a complement to this release, the data visualization product "Annual Non-Profit Institutions Human Resource Module: Interactive tool," which is part of Statistics Canada – Data Visualization Products (71-607-X), is available.
The document "An overview of the Non-Profit Sector in Canada: 2010 to 2020," which is part of Latest Developments in the Canadian Economic Accounts (13-605-X), is available.
The Economic accounts statistics portal, accessible from the Subjects module of the Statistics Canada website, features an up-to-date portrait of national and provincial economies and their structure.
The Latest Developments in the Canadian Economic Accounts (13-605-X) is available.
The User Guide: Canadian System of Macroeconomic Accounts (13-606-G) is available.
The Methodological Guide: Canadian System of Macroeconomic Accounts (13-607-X) is available.
Contact information
For more information, or to enquire about the concepts, methods or data quality of this release, contact us (toll-free 1-800-263-1136; 514-283-8300; infostats@statcan.gc.ca) or Media Relations (statcan.mediahotline-ligneinfomedias.statcan@statcan.gc.ca).
- Date modified:


