Farm cash receipts, January to December 2023
Released: 2024-02-29
$98.6 billion
January to December 2023
3.6% 
(year-over-year change)
Farm cash receipts totalled $98.6 billion in 2023, up 3.6% (+$3.4 billion) compared with 2022.
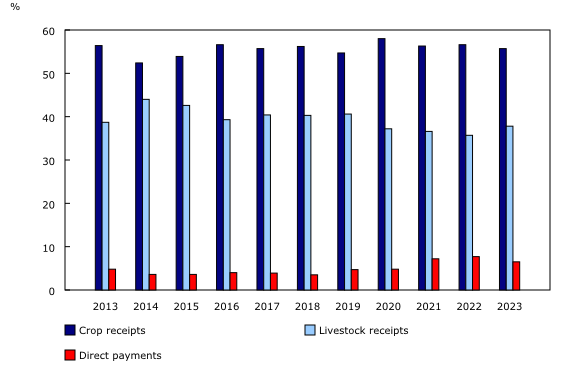
Livestock receipts and crop receipts increased, while program payments fell. Livestock receipts were up primarily because of gains for cattle, while crop receipts had mixed results. A drop in crop insurance payments led to the decrease in total program payments.
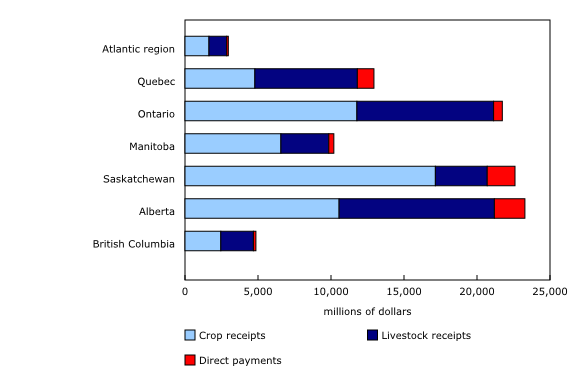
All provinces posted increases in farm cash receipts in 2023, compared with 2022, except Ontario, where receipts were flat. Saskatchewan (+$1.5 billion) and Alberta (+$1.0 billion) led the gains.
Livestock up on higher cattle receipts
Livestock receipts rose 9.8% to $37.3 billion in 2023 because of increases in the cattle and supply managed sectors.
The gain in cattle receipts (+$2.7 billion) represented just over 80% of the total increase in livestock receipts. Total cattle receipts ($13.5 billion) were up because of a rise in cattle prices for both slaughter and exports. This may have been caused by strong demand in the Canadian and US markets and higher input costs for producers.
Supply managed receipts grew 5.7% to $14.9 billion and accounted for 40% of total livestock receipts. This growth may have been caused by price increases, reflecting higher production costs. Dairy receipts rose 3.9% to $8.6 billion and were the main driver of the increase in supply managed receipts. At the same time, both marketings and prices pushed up receipts for chickens for meat by $292.9 million to $4.1 billion.
Meanwhile, hog receipts declined 10.3% from 2022 to $5.9 billion in 2023. Reduced domestic and international demand for Canadian pork may have contributed to the price drop of 11.5%.
Mixed results for crop receipts
Total crop receipts in 2023 were up 2.0% to $54.9 billion, compared with 2022. Receipts for wheat (excluding durum), durum wheat and potatoes led the way in 2023, while receipts for corn and soybeans showed the largest decreases.
Receipts for wheat (excluding durum) increased $922.4 million, while durum wheat receipts were up $194.8 million. Higher marketings for wheat (excluding durum) (+24.1%) and durum wheat (+21.5%) drove up crop receipts. The gain in marketings was caused by a return to normal production levels in the 2022 crop year, following the severe drought in Western Canada in 2021. In 2023, prices fell 11.4% for wheat (excluding durum) and 9.4% for durum wheat, although they were still higher than their five-year average.
Total potato receipts rose 12.4% to $1.9 billion because of higher prices (+12.0%), while marketings were flat. The notable price increase was a result of contract settlements between producers and processors, as well as short supply in Western Canada and the United States.
Receipts for corn (-$469.4 million) and soybeans (-$308.7 million) both fell as a result of drops in marketings and prices. Increased supply of corn and soybeans from the US market put downward pressure on both prices and marketings in Canada.
Crop insurance falls from previous year's record high
Total direct payments dropped by $983.0 million (-13.4%) to $6.4 billion in 2023, compared with 2022. Although crop insurance payments fell in 2023, compared with the previous year's record high, crop insurance levels were nevertheless higher than the five-year average.
Did you know we have a mobile app?
Get timely access to data right at your fingertips by downloading the StatsCAN app, available for free on the App Store and on Google Play.
Note to readers
The next quarterly release of Farm Cash Receipts will occur on May 29, 2024, and will include data for January to March 2024.
Preliminary estimates of net farm income for 2023 will also be available on May 29, 2024.
All data in this release are in current dollars. Farm cash receipts measure the gross revenue of farm businesses. They include sales of crops and livestock products (except sales between farms in the same province) and program payments. Receipts are recorded when the money is paid to farmers. These do not represent their bottom line, as farmers have to pay their expenses and loans and cover depreciation.
Farm cash receipts are, for the most part, based on monthly marketings and the monthly prices of various commodities. Marketings are quantities sold, using various units of measure.
Data are extracted from administrative files and derived from other Statistics Canada surveys and/or other sources. These data are subject to revision.
For the latest information on the Census of Agriculture, visit the Census of Agriculture portal.
For more information on agriculture and food, visit the Agriculture and food statistics portal.
Contact information
For more information, or to enquire about the concepts, methods or data quality of this release, contact us (toll-free 1-800-263-1136; 514-283-8300; infostats@statcan.gc.ca) or Media Relations (statcan.mediahotline-ligneinfomedias.statcan@statcan.gc.ca).
- Date modified:


