Census of Environment: Measuring settled area expansion, 2010 to 2020
Released: 2023-10-27
Settled areas are a type of intensively used ecosystem that represent the places where people live and work. While they make up a small percentage of the total land area in Canada, the expansion of settled areas onto adjacent landscapes greatly affects the surrounding environment.
Contiguously settled areas (CSAs) are a new geography that represent the physical footprint of settled areas on the landscape and can be used to measure the expansion of these areas over time, contributing to a better understanding of urban sprawl. In 2020, contiguously settled areas covered roughly 18,000 km2 of Canada.
The permanent conversion of land to settled areas generates many benefits for humans by providing spaces to live, work, and engage in recreational activities, but it comes at a cost. Environmental trade-offs include the loss of agricultural land, forests and wetlands, as well as the associated implications for habitat, biodiversity and ecosystem services, such as local climate regulation and water flow regulation.
Over one-third of built-up area growth occurred in Ontario
Built-up area within two kilometres outside the boundary of all CSAs in Canada grew by over 370 km2 from 2010 to 2020, a 2% increase over the 2010 CSA footprints. This area is comparable to the size of 45,000 Canadian football fields.
Over one-third (36%) of the land converted to built-up area on the outskirts of CSAs from 2010 to 2020 was in Ontario. Quebec had the next highest proportion (21%), followed by Alberta (16%) and British Columbia (13%).
Largest amount of built-up area growth took place in more highly populated areas
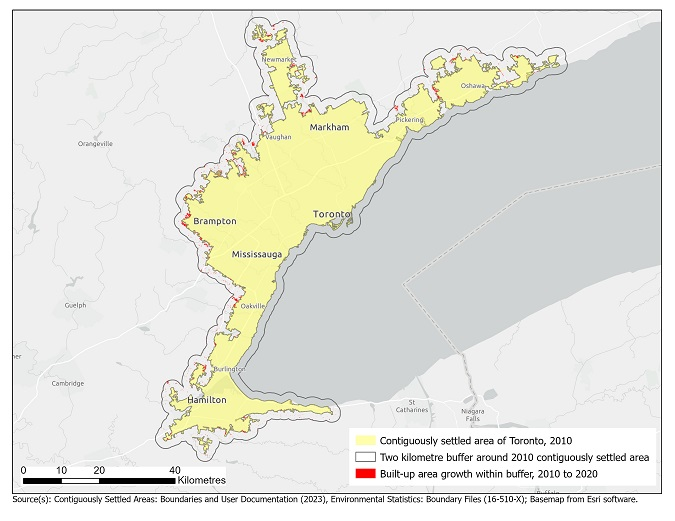
From 2010 to 2020, built-up area growth was highest in the agglomerated CSAs of Toronto (+29 km2), Calgary (+21 km2) and Montréal (+16 km2). In addition, Edmonton (+12 km2), Winnipeg (+10 km2) and Vancouver (+10 km2) had more than 9 km2 of built-up growth on their outskirts. These six CSAs all fell within the top 10 most populated municipalities in 2021.
Mid-sized settled areas also saw growth in their built-up areas
Some CSAs associated with a medium population centre also saw their built-up areas grow significantly from 2010 to 2020. In British Columbia, Kamloops had 4 km2 of built-up growth in 2020, a 4% increase over its 2010 footprint, while Prince George had 3 km2, representing a 3% increase.
Rounding out the top five medium population centres with the largest area of built-up growth are Welland-Pelham, in Ontario; Shawinigan, in Quebec; and Red Deer, in Alberta, all with 2 km2 of land converted to built-up area on their outskirts.
Note to readers
Statistics Canada's Census of Environment program reports on ecosystems in Canada to help Canadians make evidence-based decisions to protect, rehabilitate, enhance and sustain our environment. It follows the internationally accepted environmental-economic accounting standard for producing information on ecosystems' extent, their condition and the services they provide.
A new table, 38-10-0163-01, tracks settled area expansion in two ways. Variables in the table include the extent of contiguously settled areas (CSAs) at different time periods and the growth of built-up and artificial surfaces within one and two kilometres around CSAs over time.
CSAs are a new geography developed by Statistics Canada that represent the physical footprint of settled areas on the landscape. These areas include both built-up areas, as well as agriculture and natural and semi-natural land cover classes that are enclosed by built-up areas. They are based on Earth observation-derived land use data produced by Agriculture and Agri-Food Canada.
Built-up area includes residential, commercial, industrial or transportation areas; bare pavement; vegetated areas associated with settlements, including parks, lawns, and golf courses; and settlement areas mostly covered by tree canopy.
CSAs were produced for population centres with a 2021 population greater than 5,000 persons or those located within a census metropolitan area or census agglomeration. A total of 494 CSAs were created representing 540 population centres.
The CSAs complement other spatial representations of settled areas that are based on administrative and statistical boundaries. These existing boundaries have limitations for urban ecosystem analysis as they do not represent the footprint of settled areas or change in their physical form over time. This release does not analyze built-up growth occurring within CSAs.
For more information, see Canadian System of Environmental-Economic Accounting – Ecosystem Accounts (5331).
Products
Contiguously settled area spatial files (ArcGIS®, file extension: .shp) and metadata can be downloaded from "Contiguously Settled Areas: Boundaries and User Documentation" which is part of the publication Environmental Statistics: Boundary Files (16-510-X).
Contact information
For more information, or to enquire about the concepts, methods or data quality of this release, contact us (toll-free 1-800-263-1136; 514-283-8300; infostats@statcan.gc.ca) or Media Relations (statcan.mediahotline-ligneinfomedias.statcan@statcan.gc.ca).
- Date modified:

