Labour market characteristics of persons with and without disabilities in 2022: Results from the Labour Force Survey
Released: 2023-08-30
Highlights
In 2022, the employment rate for those aged 16 to 64 with disabilities was 65.1%, compared with 80.1% for those without disabilities. The employment rate for persons with disabilities varied by the severity of the disability. Those with a severe disability were employed at a rate of 50.4% and those with a very severe disability were employed at a rate of 26.8%.
In 2022, the unemployment rate for persons aged 16 to 64 with disabilities was 6.9%. The rate was nearly twice as high as for persons in the same age group without disabilities (3.8%). The unemployment rate for persons with disabilities was higher than for persons without disabilities among both women and men.
Persons with disabilities were more likely to work in the public sector than those without disabilities (24.2% of employed persons with disabilities were employed in the public sector, compared with 21.0% of those without disabilities) and to be self-employed (13.0% of those with disabilities, compared with 11.4% of those without disabilities).
Median hourly wages for persons with disabilities ($26.00) were 5.5% less than for those without disabilities ($27.50) in 2022.
These findings are from the Labour Force Survey (LFS) and its supplement program, which for the first time in 2022, collected information for the 12 months of the year on persons with disabilities (see Text box).
Persons with disabilities less likely to be employed
Persons with disabilities represent a diverse and significant portion of the Canadian labour force. According to the 2017 Canadian Survey on Disability, 15.6% of employed Canadians aged 25 to 64 had disabilities―or about 2.2 million people. However, disabilities still represent a barrier for many Canadians in terms of acquiring and maintaining meaningful employment. Recently, the legal and policy landscape has changed in Canada on matters related to disability and inclusion. These policies, such as the Accessible Canada Act and the Disability Benefit Act, are meant to remove barriers and enable more equitable access to employment for those with disabilities.
Persons with disabilities have consistently been employed at lower rates than those without disabilities. This has been attributed to several factors, including unmet workplace accommodation needs and workplace discrimination. In 2022, the employment rate among those aged 16 to 64 with disabilities (65.1%) was 15 percentage points lower than the rate for those without disabilities (80.1%). These rates were recorded against the backdrop of strong employment and a tight labour market. As of the second quarter of 2022, employers were seeking to fill nearly one million vacant positions, the highest on record.
Information on persons with disabilities in the Labour Force Survey
The Disability Screening Questions (DSQ) serve to identify persons with disabilities, thus allowing comparisons of measured survey characteristics between them and persons without disabilities. The DSQ is based on the social model of disability. This model defines disability as the relationship between body function and structure, daily activities, and social participation, while recognizing the role of environmental factors. In keeping with this model, the DSQ identify persons with disabilities as those who not only have a difficulty or impairment due to a long-term condition or health problem, but also experience a limitation in their daily activities. The definition of disability refers to difficulties or limitations that have lasted for or are expected to last for six months or more.
The Labour Force Survey program includes the Labour Force Survey (LFS) as the main questionnaire, as well as supplemental questionnaires on specialized topics each month, asked on a rotating basis. From 2014 to 2021, the DSQ were asked as part of the Canadian Income Survey (CIS), a supplemental survey to the LFS, for a partial period of each year. For the first time in 2022, the LFS program collected 12 months of data using the DSQ, through a combination of supplemental questionnaires, including the CIS.
Because employment follows seasonal patterns, previous 4-month-based estimates should not be directly compared to the 12-month-based estimates for 2022.
Nonetheless, main findings from the 2022 data (adjusted to methodology of past years) are consistent with previous trends. Previous years show that rates of employment for those with disabilities have been increasing over time, from 55.0% in 2017 to 65.5% in 2022.
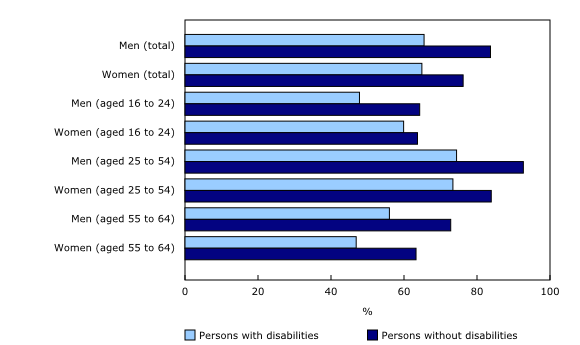
Gaps in the employment rate between persons with and without disabilities existed across all age groups in 2022. For those in the core working age (25 to 54 years), the employment rate for persons with disabilities (73.9%) was 14.5 percentage points lower than for those without disabilities (88.4%).
The employment rate gap was more pronounced among those in the older age group. The employment rate for persons aged 55 to 64 with disabilities (51.1%) was 17.0 percentage points lower than for their counterparts without disabilities (68.1%). In this age group, these differences were observed for both men (56.0% employment rate for those with disabilities vs. 72.8% for those without) and women (46.9% vs. 63.3%). This can be explained by lower labour force participation rates among people with disabilities in the older age group (54.6%, compared with 70.6% for those without disabilities), who were more likely to leave their last job due to their own illness or disability (18.0%, compared with 2.3% of those without disabilities).
An employment rate gap between youth (aged 16 to 24) with and without disabilities was also observed, but it was smaller (54.4% of those with disabilities were employed, compared with 64.0% of those without disabilities).
The employment rate among those with disabilities varied by age and sex. Among those aged 25 to 64, men with disabilities (68.6%) were more likely to be employed than their female counterparts (65.7%), consistent with findings from the 2017 Canadian Survey on Disability (CSD). However, among those in the core working age (25 to 54 years), men and women were employed at similar rates (74.4% for men and 73.4% for women).
Men of older ages (55 to 64) with disabilities were more likely to be employed than their female counterparts by a difference of 9.1 percentage points (56.0% for men, compared with 46.9% for women). The gap in the employment rate between men and women without disabilities in this age group was similar (72.8% for men, compared with 63.3% for women).
Conversely, in the younger age group, the employment rate among females with disabilities surpassed the rate for young men by 12.1 percentage points. Among youth aged 16 to 24, the employment rate for women was 59.9%, compared with 47.8% for men. Among those in this age group without disabilities, the employment rates of young women and young men were similar (64.3% for young men and 63.7% for young women).
Employment rates decrease for those with more severe disabilities
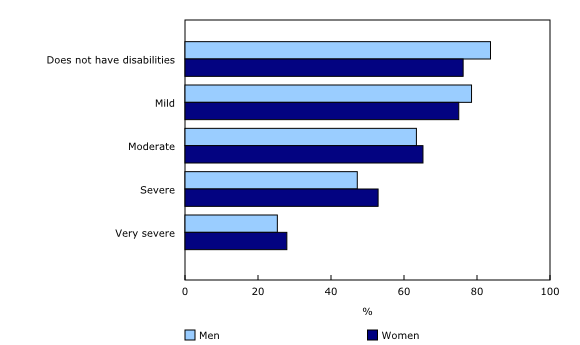
Previous data indicate that employment patterns differ according to severity of disability. Severity scores increase with the number of disabilities a person has, and the level of difficulty and frequency of limitation associated with disabilities.
This continued to be the case in 2022, as just over three-quarters (76.6%) of those with mild disabilities were employed, compared with 64.5% of those with moderate disabilities, one-half (50.4%) of those with severe disabilities, and just over one-quarter (26.8%) of those with very severe disabilities.
Higher unemployment rates for women and men with disabilities
In 2022, the unemployment rate for persons aged 16 to 64 with disabilities was 6.9%. The rate was nearly twice as high as for persons in the same age group without disabilities (3.8%). The unemployment rate for persons with disabilities was higher than for persons without disabilities among both women and men.
Close to 1 in 4 (22.8%) unemployed persons with disabilities had been unemployed for 27 weeks or more, compared with 14.7% for those without disabilities.
Persons with disabilities more likely to work part-time
Among those with disabilities who were employed, one in five (20.3%) worked part-time in 2022, compared with 16.2% among those without disabilities.
While many workers in Canada work fewer than 30 hours per week as a matter of choice, others do so involuntarily. This may be a result of economic or business conditions, or because they could not find full-time work. In 2022, persons with and without disabilities were equally likely to work part-time involuntarily (6.5% among persons with disabilities, compared with 6.7% among those without disabilities).
Persons with disabilities more likely to work in the public sector and be self-employed
In 2022, persons with disabilities were more likely to work in the public sector (24.2%, compared with 21.0% for those without disabilities) and to be self-employed (13.0%, compared with 11.4% for those without disabilities).
Persons with disabilities were more likely to be employed in health care and social assistance (15.1% vs. 12.6% for those without disabilities), educational services (8.6% vs. 7.4%), public administration (6.8% vs. 5.5%) and business, building and other support services (4.7% vs. 3.2%). Conversely, persons with disabilities had lower proportions of employment in the professional, scientific and technical services industry (8.2% vs. 9.6% for those without disabilities).
Persons with disabilities have lower wages
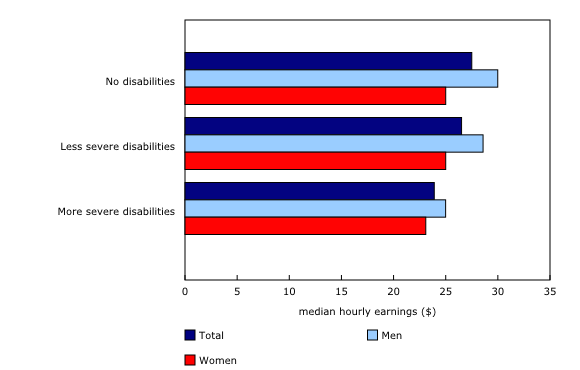
In 2022, median hourly wages for employees with disabilities ($26.00) were 5.5% less than for those without disabilities ($27.50). However, the severity of the disability played an important role, especially for men. The median hourly wage of men with more severe disabilities was $24.99, which was 16.7% lower than their counterparts without disabilities ($29.99). Among women with more severe disabilities, the median hourly wage ($23.09) was 7.6% lower than for their counterparts without disabilities ($25.00).
Looking ahead
In the coming months, Statistics Canada will release results from the 2022 CSD, providing more comprehensive and detailed insights on the labour market experiences of persons with disabilities, including unmet needs related to workplace accommodations. The CSD is collected every five years and is specifically designed to provide comprehensive data on persons with disabilities, by province and territory and age group and sex, as well as disability types and severity of the disability. The CSD is the official source of information on the prevalence of persons with disabilities in Canada and is essential for the effective development and operation of the Employment Equity Program.
Note to readers
For the first time in 2022, information based on the Disability Screening Questions (DSQ) was collected for the 12 months of the year through the Labour Force Survey (LFS) and its supplemental questionnaires. Previously, labour force characteristics from 2014 to 2021 on persons with disabilities had been available for the months of January to April only, based on combined information from the LFS main questionnaire and the supplemental Canadian Income Survey (CIS).
In 2022, the DSQ were asked each month through supplemental questionnaires to the main LFS. These supplemental surveys form part of additional non-mandatory questions on diverse aspects of employment collected via a sub-sample of LFS respondents. The sub-sample is selected by drawing one random respondent per household from households rotating out of the LFS sample. Data collected via the DSQ are combined with data from the main LFS. For the first six months of the year, the DSQ data are also combined with data from the CIS. The 12-month-based estimates on characteristics of persons in the labour force with disabilities will be made available on an annual basis.
Results from the 2022 Canadian Survey on Disability (CSD) will be released in the coming months. The CSD is a national survey of Canadians aged 15 and older whose everyday activities are limited because of a long-term condition or health-related problem. It provides information on disability-specific issues, such as type and severity, use of aids and assistive devices, as well as help received and required. The CSD is carried out by Statistics Canada with funding provided by Employment and Social Development Canada (ESDC) and by Veterans Affairs Canada (VAC) for a targeted sample of veterans. The CSD is conducted every five years, a few months after the census which is used to create the survey frame by including people who are most likely to have disabilities based on a set of filter questions available on the long-form census; the CSD should be considered the official source of information on the prevalence of persons with disabilities in Canada.
Indicators from the LFS complement those from the CSD and provide more frequent estimates on the labour force characteristics of persons with and without disabilities. LFS-based indicators for persons with disabilities also complement labour market information available for other population groups.
The LFS and CSD both collect data using the DSQ, which allows these surveys to identify 11 disability types and their severity. For more information on how the severity of disabilities is derived, please see A New Survey Measure of Disability: the Disability Screening Questions (DSQ).
Contact information
For more information, or to enquire about the concepts, methods or data quality of this release, contact us (toll-free 1-800-263-1136; 514-283-8300; infostats@statcan.gc.ca) or Media Relations (statcan.mediahotline-ligneinfomedias.statcan@statcan.gc.ca).
- Date modified:


