Industrial research and development, 2021 (actual), 2022 (preliminary) and 2023 (intentions)
Released: 2023-08-02
Research and development (R&D) plays a vital role in fostering innovation and technological advancement, driving economic growth and Canadian competitiveness in a global economy. R&D can lead to the development of new or improved products and processes that enhance our quality of life in areas such as healthcare and technology.
According to the most recent release of the Gross domestic expenditures on R&D, Canada's business sector has consistently performed over half of the R&D activities since 2016.
In-house research and development rose over the COVID-19 pandemic
Total in-house R&D expenditures by the Canadian business sector have shown a consistent upward trend over a five-year period, rising from $18.7 billion in 2016 to $27.3 billion in 2021. This represents a compounded annual growth rate of approximately 7.9%.
Preliminary data for 2022 show a projected expenditure of $28.2 billion, 3.3% above 2021. Intentions data for 2023 suggest a further growth of 2.5%. The rise in spending levels over the 2021-to-2023 period highlights the role that Canada's business sector plays in driving R&D in Canada.
Research and development growth in the business sector driven by large performers
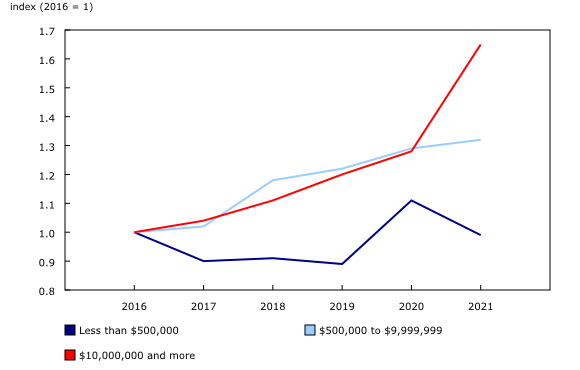
R&D spending, disaggregated by the amount businesses spend on R&D, tends to be clustered around the very largest performers (those spending $10 million or more). This group reported higher growth in 2021 than in 2020, with intentions data indicating that this higher level of spending will continue into at least 2023.
By contrast, small R&D performers (those spending under $500,000) experienced a noticeable decline in 2021, following a year of high expenditures in 2020. This decline could be attributed to a range of factors including increased competition from larger corporations, market disruptions caused by the COVID-19 pandemic and limited financial resources or personnel.
Rising expenditures on software behind the growth in research and development capital
While capital expenditures for R&D make up a small share of total R&D spending (6.1%), it is noteworthy to see a recent uptick in capital expenditures. Despite declining 16.7% from 2016 ($1.2 billion) to 2019 ($1.0 billion), it climbed back to $1.3 billion in 2020 then rose to $1.7 billion in 2021. This marks the highest expenditures on capital R&D since 2014 ($1.3 billion).
Most of the rise is the result of higher spending on software, which grew 57.9% from 2019 to 2020 and 59.5% from 2020 to 2021. These growths reflect the increasing use of digital tools for R&D, possibly accelerated by lockdowns put in place in 2020 and 2021 to curb the spread of COVID-19.
Preliminary data for 2022 and intentions data for 2023 suggest that capital spending will continue the increases seen in 2021, rising to $2.0 billion in both 2022 and 2023.
Business sector spends $18.7 billion in wages and salaries
Current in-house expenditures, which include wages and salaries, services to support R&D, materials and other costs, comprise the majority of total in-house R&D expenditures. In 2021, out of the $27.3 billion in total expenditures, $25.6 billion (93.8%) was allocated to current in-house expenditures. Of this, $18.7 billion (73.0%) was spent on wages and salaries.
The magnitude of expenditures on R&D personnel is not surprising given that R&D is predominantly knowledge-based and that such employees tend to be well-educated and highly qualified experts. Their roles include designing and conducting experiments, managing projects, providing technical and scientific advice and supporting operations. Their work also drives innovation, generates knowledge and helps to translate ideas into practical solutions.
Over the five-year period from 2016 to 2021, R&D personnel in the business sector rose from 146,964 full-time equivalents (FTEs) to 197,461 FTEs (up 34.4%). The increase in R&D personnel underscores the business sector's commitment to R&D and their response to market and consumer dynamics.
Research and development spending leads to social transformation
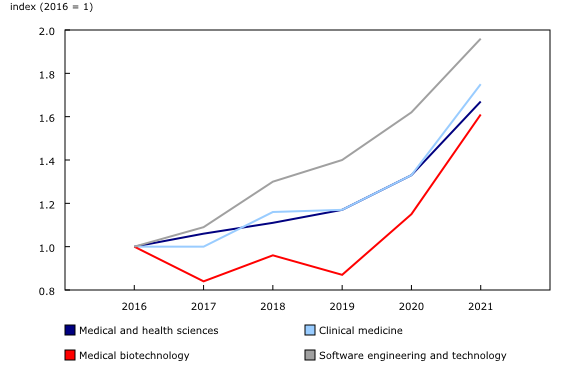
Investments to in-house R&D can be categorized into multiple disciplines, depending on the type of problems that businesses aim to address. These disciplines encompass critical fields of R&D, including medical and health sciences and software engineering and technology, which play a significant role in addressing societal challenges facing Canadians.
The field of medical and health sciences has been of increased importance, especially during the pandemic. From 2016 to 2019, its compounded annual growth rate of R&D spending was 5.3%, with spending rising from $1.8 billion in 2016 to $2.1 billion in 2019. In 2020, the growth in spending nearly tripled (+14.3%) as it reached $2.4 billion, and 2021 experienced even higher growth, increasing 25.0% to $3.0 billion.
Most of the growth in 2021 was attributable to strong R&D spending in medical biotechnology, up 40.2% to $1.0 billion, and clinical medicine, up 31.0% to $726.0 million. The heightened spending within these two fields of R&D likely played a pivotal role in the response to the pandemic by facilitating the development of diagnostic tools, therapeutic interventions and vaccines.
Software R&D has also gained prominence as it becomes more embedded into products and services that Canadians rely upon across various industries, ranging from healthcare and finance to transportation and entertainment.
Software engineering and technology has exhibited steady and significant growth over the years. From 2016 to 2021, spending on software had a compound annual growth rate of 14.4%, resulting in increased spending from $5.3 billion in 2016 to $10.4 billion in 2021.
Outsourced research and development rebounds after two-year decline
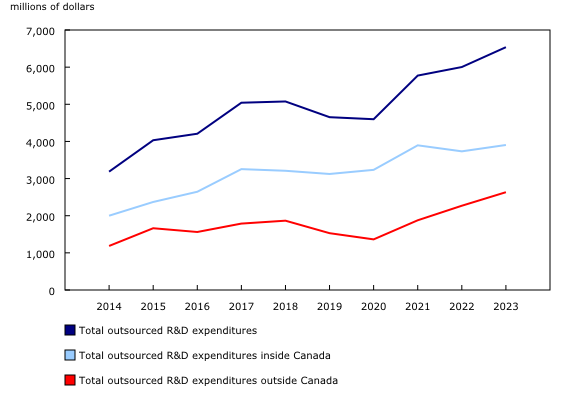
In addition to the in-house R&D performed by the business sector, businesses also outsource R&D work to organizations in Canada, such as universities, hospitals and businesses, as well as to organizations outside of Canada.
Outsourced R&D funded by the Canadian business sector experienced a notable increase for the first time in two years in 2021 (up 26.1% to $5.8 billion). Outsourcing to recipients outside of Canada was up 35.7% to $1.9 billion, and outsourcing to Canadian recipients was up 21.9% to $3.9 billion.
Preliminary data for 2022 and intentions for 2023 suggest that, for these two years, outsourcing to Canadian recipients will hold steady at the 2021 levels ($3.7 billion in 2022 and $3.9 billion in 2023), while outsourcing to foreign recipients is expected to continue to grow (up to $2.3 billion in 2022 and up to $2.6 billion in 2023).
Sustainable development goals
On January 1, 2016, the world officially began implementing the 2030 Agenda for Sustainable Development—the United Nations' transformative plan of action that addresses urgent global challenges over the following 15 years. The plan is based on 17 specific sustainable development goals.
Data on the characteristics of research and development in Canadian industry are an example of how Statistics Canada supports the reporting on the global sustainable development goals. This release will be used to help measure the following goal:

Note to readers
The data in this release are subject to revision.
Research and experimental development comprises creative and systematic work carried out to increase the stock of knowledge—including knowledge of humankind, culture and society—and to devise new applications from the available knowledge.
In-house research and development (R&D) expenditures refer to expenditures within Canada for R&D performed within the company by employees (permanent, temporary or casual) and self-employed individuals working on site on the company's R&D projects.
Onsite R&D contractors are onsite personnel hired to perform specialized project-based R&D work under the supervision and direction of the contracting organizations. They are considered separate from industrial R&D employees.
Random tabular adjustment
The random tabular adjustment (RTA) technique, which aims to increase the amount of data made available to users, while protecting the confidentiality of respondents, was applied to the estimates from the Annual Survey of Research and Development in Canadian Industry.
Statistics Canada typically uses suppression techniques to protect sensitive statistical information. These techniques involve suppressing data points that can directly or indirectly reveal information about a respondent. This can often lead to the suppression of a large number of data points and significantly reduce the amount of available data.
Using RTA, Statistics Canada can identify sensitive estimates and randomly adjust their value rather than suppress them. The size of the adjustment is calculated to protect respondent confidentiality. After adjusting the value, the agency assigns a quality measure (A, B, C, D or E) to the estimate to indicate the degree of confidence that users can have in its accuracy. Quality measures account for uncertainty related to sampling, non-response and RTA, when applied.
For more information on RTA, please refer to the blog article "Random Tabular Adjustment is here!," now available as part of the StatCan Blog.
Products
The interactive dashboard "Characteristics of research and development in Canadian industry" (71-607-X) is available.
Contact information
For more information, or to enquire about the concepts, methods or data quality of this release, contact us (toll-free 1-800-263-1136; 514-283-8300; infostats@statcan.gc.ca) or Media Relations (statcan.mediahotline-ligneinfomedias.statcan@statcan.gc.ca).
- Date modified:


