Non-profit organizations in rural and small town of Canada, 2020
Released: 2023-03-03
In 2020, non-profit organizations (NPOs) contributed up to 8.9% of Canada's gross domestic product. Over 134,000 Canadian NPOs were active in 2020, a 2.1% increase from the previous year. Nearly one-quarter (22.6%) of NPOs were in rural and small town Canada, employing over 428,000 people (+4.2% from 2019) and generating nearly $23.4 billion in total revenue (+3.3% from 2019).
These results are derived from the Rural Canada Non-Profits Metadata and User Guide, 2020, which provides details on the activities of NPOs in rural and small town Canada in 2020. The first release of the Rural Canada Non-Profits (RCNP) Database covered the 2019 reference year. Rural and small town areas are considered to be areas outside of census metropolitan areas/census agglomerations (CMAs/CAs), while those areas inside CMAs/CAs are considered urban.
The RCNP Database is created from data obtained from the Statistics Canada Business Register which includes information such as business address, non-profit/for-profit status, industry, and Canada Revenue Agency filings and tax return data. The RCNP database defines NPOs as organizations that operate for a purpose other than profit. These include social, recreational or hobby groups; certain amateur sports organizations; certain festival organizations; and charities. NPOs retained for the RCNP Database were active during the 2020 reference year and reported revenues or employment.
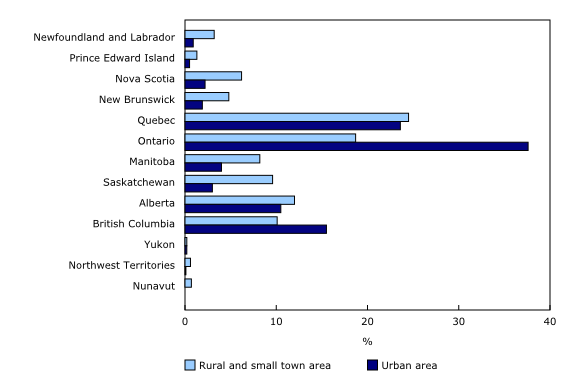
Over three-fifths of all non-profit organizations in rural and small town Canada are in Quebec, Ontario, Alberta, and British Columbia
In 2020, more than 30,000 NPOs were active in rural and small town Canada (+2.7% from 2019). Of these NPOs, those in Quebec (24.5%), Ontario (18.7%), Alberta (12.0%) and British Columbia (10.1%) accounted for over three-fifths (65.3%) of all NPOs in rural and small town Canada. Over 104,000 NPOs were active in urban areas of Canada (+2.0% from 2019). Of these, 37.6% were in Ontario, 23.6% in Quebec, 15.5% in British Columbia and 10.5% in Alberta, accounting for 87.2% of the total share of urban NPOs.
The Atlantic region collectively represented 15.5% of all NPOs in rural and small town Canada in 2020, 10 percentage points above their urban counterparts (5.5%). The three territories accounted for 1.4% of the share of NPOs in rural and small town Canada.
Rural and small town non-profit organizations increase total revenues from 2019 to 2020
In 2020, NPOs in rural and small town Canada generated nearly $23.4 billion in revenue (+3.3% from 2019), representing 7.7% of the total revenue earned by NPOs ($303.1 billion). Meanwhile, NPOs in urban Canada reported revenues of over $279.7 billion in 2020 (92.3% of total NPO revenues), down 3.0% from 2019.
Together, NPOs in rural and small town Quebec (26.0%), Ontario (19.5%), Alberta (12.7%) and British Columbia (11.0%) accounted for over two-thirds (69.2%) of the total revenues generated by NPOs in rural and small town Canada in 2020.
Over half (52.5%) of the total revenue earned by NPOs in the Northwest Territories was generated by rural and small town NPOs, followed by those in New Brunswick (26.3%), Newfoundland and Labrador (26.0%), and Nova Scotia (25.6%). For Ontario, which had the highest number of NPOs and overall revenues compared with other provinces or territories, rural and small town NPOs contributed the smallest share of the total revenue earned by all NPOs in that province (3.7%).
Number of non-profit employees in rural and small town Canada increases, while those in urban Canada decrease from 2019 to 2020
In 2020, NPOs in rural and small town Canada employed over 428,000 people (12.0% of all non-profit employees), increasing 4.2% from 2019. In comparison, NPOs in urban Canada employed 3,136,450 people (88.0% of all non-profit employees), declining 0.1% over the same period. Quebec reported the highest number of rural and small town non-profit employees compared with the other provinces or territories, with 123,638 employees in 2020.
The Northwest Territories had the largest share of non-profit employees in rural and small town areas in 2020, at 42.4% of all NPO staff in that territory, followed by Nova Scotia (31.9%) and Saskatchewan (23.8%). In contrast, Ontario (5.7%) had the smallest share of rural and small town non-profit employees within a province or territory, followed by British Columbia (9.7%) and Yukon (11.6%).
The number of rural and small town non-profit employees increased in Prince Edward Island (+28.7%) and British Columbia (+30.4%) from 2019 to 2020, while the number of employees decreased in the Northwest Territories (-27.0%) and Nunavut (-30.3%) over the same period.
Religion remains the most common non-profit organization activity in rural and small town Canada
NPOs with activities in religion remained predominant in rural and small town Canada (23.7%) in 2020, followed by sports, recreation and social clubs (17.6%) and social services (12.4%). The top three activity groups in urban Canada were also sports, recreation and social clubs (26.3%), religion (17.1%), and social services (13.1%). These three activity groups accounted for over half of the rural and small town (53.7%) and urban (56.5%) NPOs in Canada.
Rural and small town non-profit organizations in health activities observe the greatest increase in revenue from 2019 to 2020
In 2020, rural and small town NPOs in health (39.4%), education and research (25.4%), and social services (9.9%) had the largest shares of the total revenues of all NPOs in rural and small town areas. Education and research activity contributed 34.4% of the total revenues of NPOs in urban areas, followed by health (25.5%) and development and housing (11.0%).
Perhaps owing to challenges related to the COVID-19 pandemic, rural and small town NPOs in health activities saw the greatest increase in revenues from 2019 to 2020, rising 28.3%, followed by those involved in law, advocacy and politics (+11.0%). In contrast, revenues decreased for rural and small town NPOs in philanthropic intermediaries and voluntarism promotion (-40.6%) and culture and recreation (-17.1%) over the same period.
From 2019 to 2020, the revenue of rural and small town organizations involved in religious activities declined by 3.4%, while those in urban areas saw their revenue increase by 3.5% over the same period.
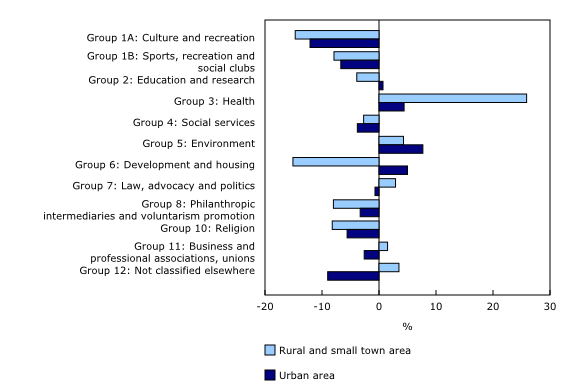
Rural and small town non-profit organizations in development and housing activities experience the greatest decrease in the number of employees from 2019 to 2020
In 2020, nearly four-fifths of non-profit employees in rural and small town Canada were working in health (35.6%), education and research (28.0%), and social services (14.9%). Like their rural and small town counterparts, nearly four-fifths of non-profit employees in urban Canada were employed in the same International Classification of Non-Profit Organizations activity groups—education and research (41.9%), health (25.6%), and social services (10.5%).
From 2019 to 2020, alongside the evolving challenges of the pandemic, some NPOs activity groups were observed to have experienced greater impacts in employment than others. The number of rural and small town non-profit employees in health activities increased by 25.9%, over 20 percentage points above their urban equivalents. In contrast, the number of rural and small town non-profit employees participating in development and housing activities including but not limited to those involved in construction (North American Industry Classification System [NAICS], 23); accommodation (NAICS, 721); transportation and warehousing (NAICS, 48-49); and real estate and rental and leasing services (NAICS, 53) industries decreased by 15.1%, while the number of employees for their urban counterparts increased by 5.0%. The largest increase in non-profit employees in urban areas was for those NPOs engaged in environment activities (+7.7%), while the largest decrease was for those engaged in culture and recreation activities (-12.1%).
Note to readers
Rural Canada Non-Profits (RCNP) database is based on data obtained from Statistics Canada's Business Register (BR) database. The BR is a comprehensive list of businesses in Canada. It contains such information for businesses as address, non-profit/for-profit status, industry, as well as their Canada Revenue Agency filings and tax returns data, including revenues and employment. BR data are updated on a monthly basis. NPOs retained for the RCNP database were active during the considered reference year and reported revenues or employment.
Data are available by geographical level, International Classification of Non-Profit Organizations activity group and North American Industry Classification System code.
Rural and small town area and urban area flags are based on Statistics Canada's Standard Geographical Classification 2016 using the postal code of the business address. All census subdivisions and their regional aggregates outside census metropolitan areas/census agglomerations (CMAs/CAs) are classified as "Rural and small town areas," regional aggregates inside CMAs/CAs are classified as "Urban areas," and "All areas" is for rural and small town and urban areas combined.
For further details, please see Rural Canada Non-Profits Metadata and User Guide, 2020.
Products
The "Rural Canada Non-Profits Metadata and User Guide, 2020" is now available.
Rural Canada Non-Profits: Interactive Dashboard, which is part of Statistics Canada – Data Visualization Products (71-607-X), is now available.
Contact information
For more information, or to enquire about the concepts, methods or data quality of this release, contact us (toll-free 1-800-263-1136; 514-283-8300; infostats@statcan.gc.ca) or Media Relations (statcan.mediahotline-ligneinfomedias.statcan@statcan.gc.ca).
- Date modified:


