Hours worked and labour productivity in the provinces and territories (preliminary), 2021
Archived Content
Information identified as archived is provided for reference, research or recordkeeping purposes. It is not subject to the Government of Canada Web Standards and has not been altered or updated since it was archived. Please "contact us" to request a format other than those available.
Released: 2022-05-20
$58.40 per hour
2021
-5.8% 
(annual change)
$87.20 per hour
2021
-10.7% 
(annual change)
$42.00 per hour
2021
0.5% 
(annual change)
$44.00 per hour
2021
-3.9% 
(annual change)
$45.70 per hour
2021
0.7% 
(annual change)
$52.40 per hour
2021
-3.9% 
(annual change)
$54.80 per hour
2021
-6.3% 
(annual change)
$51.00 per hour
2021
-7.8% 
(annual change)
$83.40 per hour
2021
-7.1% 
(annual change)
$80.50 per hour
2021
-6.7% 
(annual change)
$53.10 per hour
2021
-6.3% 
(annual change)
$79.30 per hour
2021
7.9% 
(annual change)
$106.60 per hour
2021
-0.1% 
(annual change)
$114.30 per hour
2021
2.4% 
(annual change)
In 2021, business productivity decreased in eight provinces as well as in the Northwest Territories. Productivity increased in New Brunswick (+0.7%) and Prince Edward Island (+0.5%); however, this represents a marked slowdown from 2020 for both provinces. In the Yukon and Nunavut, productivity growth continued in 2021, but at a much slower pace than the previous year. Nationally, business productivity fell by 5.8%, following a record 7.8% increase in 2020.
For most provinces, the strong declines in labour productivity in 2021 were in sharp contrast to 2020, when productivity rose significantly.
While 2020 was a pandemic year marked by restrictive health measures in most provinces and territories, 2021 saw a marked recovery in economic activity and the labour market, thanks to high rates of vaccination against COVID-19 and the sporadic easing of health restrictions during the year. In addition, in 2021, many sectors of the Canadian economy continued to recover from the sharp declines in business output in 2020 that resulted from the pandemic.
The impact of the COVID-19 pandemic on productivity varied across the country in 2021, reflecting differences in the extent of restrictions. These restrictions have been gradually relaxed, but with varying degrees and timelines from one province or territory to another.
In eight provinces, hours worked rebound faster than business output
In 2021, for a second straight year, productivity moved in the opposite direction of gross domestic product (GDP) of businesses and hours worked in most provinces. Moreover, the movements of these three indicators throughout 2020 and 2021 were more volatile than in the previous years.
In 2021, public health restrictions were increasingly eased in most provinces and territories throughout the year, which contributed to a rebound in GDP of businesses and hours worked. Given that hours worked had fallen to a very low level in 2020, hours worked rebounded much more strongly in 2021 than business output, resulting in exceptional declines in productivity in all provinces, except Prince Edward Island and New Brunswick.
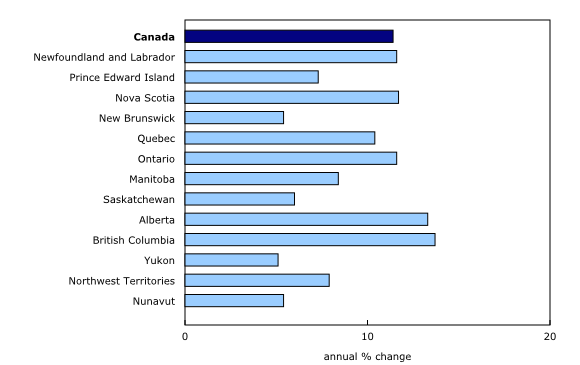
Nationally, hours worked in the business sector posted a historic increase of 11.4% in 2021. They also rose considerably in all the provinces and territories—in sharp contrast to the results observed in 2020.
Impacts of the COVID-19 pandemic on hours worked by province and territory in the business sector, 2021
Annual estimates of hours worked in the business sector by province and territory are essentially based on monthly data from the Labour Force Survey (LFS). It should be noted that for hours worked (used to measure productivity), both main and secondary jobs are considered—not only the main job as in the LFS. The main survey for the LFS for the reference period that includes the months of January to December 2021 does not capture losses of work hours outside the reference weeks. To account for the hours lost by province and territory because of the pandemic, the estimates were adjusted using a compilation of supplementary questions added to the LFS questionnaire between February 2021 and January 2022 for the respective reference months of January to December of 2021. These adjustments are reflected in the annual data on hours worked and related measures (including labour productivity) for 2021.
Losses of work hours due to the COVID-19 pandemic by province are much lower in 2021
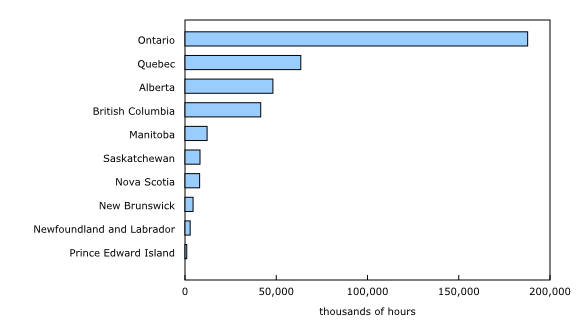
At the national level, when only individuals in the labour force or on paid leave are taken into account, the net effect of the COVID-19 pandemic on hours worked in the business sector was a loss of 377.4 million hours in 2021. This is a much smaller loss than in 2020 (-835.8 million hours).
For all provinces, the economic impact of the COVID-19 pandemic in 2021 was much less pronounced than in 2020. In general, businesses in most regions benefited from the learning effect—particularly with the use of teleworking—as well as from adapting to new health restrictions in 2021.
For a second consecutive year, Ontario posted the largest loss among the provinces, with a net loss of 187.8 million hours in 2021. Almost 50% of all hours lost in the country were in Ontario.
As in 2020, the three territories were least affected in 2021, with a net loss of 38,000 hours worked.
Hourly compensation in the business sector is down in six provinces
In 2021, average compensation per hour worked in the business sector declined in six provinces, while it increased in Saskatchewan (+1.4%), Quebec (+0.6%), New Brunswick (+0.5%) and Manitoba (+0.1%).
The largest decreases were recorded in two provinces with resource-based economies: Alberta (-5.1%) and Newfoundland and Labrador (-3.2%). In the three territories, hourly compensation continued to grow in 2021, but at a much slower pace than the year before. In 2020, hourly compensation rose strongly in all the provinces and territories.
Nationally, hourly compensation fell 1.1% in 2021, after posting a record increase of 11.6% in 2020.
Average hourly wage for full-time paid workers varies unevenly across the provinces and territories
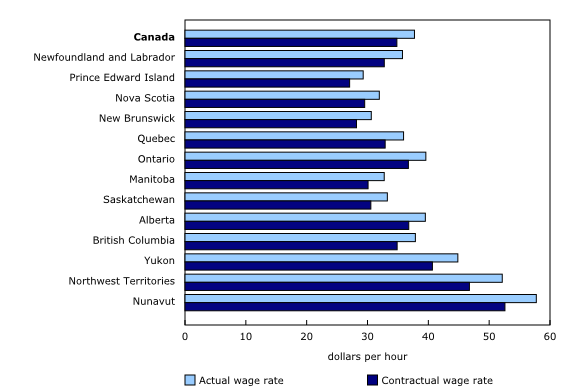
In 2021, the actual wage rate—that is, the wages and salaries per hour worked—for full-time paid workers in the total economy varied differently across the provinces and territories. On average, the lowest wage rate was registered in Prince Edward Island ($29.29 per hour worked), and the highest in Nunavut ($57.75 per hour worked). Nationally, average wage rate in the total economy was $37.72 per hour worked.
On the other hand, the contractual wage rate—that is, the wages and salaries per hour paid—is lower than the actual wage rate. This is explained by the fact that the hours paid differ from the hours worked because of paid leave and unpaid overtime for paid workers.
The wage gap between the actual and contractual rate can be used as an indicator of paid workers' paid leaves. In 2021, this gap is largest in all three territories, while it is smallest in Alberta.
For part-time paid workers, the situation is somewhat different: their wage rate is generally lower than that of full-time paid workers. In addition, on average for each hour worked, part-time paid workers have a lower proportion of paid leaves.
The economic regions of Montréal, Toronto and Montérégie have the largest number of labour exchanges with other regions in 2021
Some economic regions depend on workers from other regions of the country, either to meet their labour needs or to alleviate labour shortages. As a result, many paid workers leave their home economic region to work outside of it. They may commute daily or make one or more round trips each month. These exchanges of workers between regions result either in a positive net flow when the region receives more external workers than it provides to other regions, or in a negative net flow in the opposite situation.
In 2021, Quebec and Ontario include the economic regions highlighted as the largest sources or destinations of workers. All economic regions in other provinces posted a much lower net job flow (fluctuating between a gain of 10,000 jobs and a loss of 10,000 jobs), with the exception of Wood Buffalo–Cold Lake in Alberta and Winnipeg in Manitoba. Almost all of the economic regions in the Atlantic provinces had relatively more workers leaving than entering. In contrast, the three territories, central and northern British Columbia and most northern economic regions in other provinces attracted more workers from other regions.
Each economic region that receives a large number of workers is surrounded by a cluster of economic regions that send a considerable workforce to different destinations. Quebec and Ontario have formed such clusters around Montréal with a positive net flow of about 333,000 jobs, Toronto with 145,000 jobs, as well as Ottawa (positive net flow of about 40,000 jobs) and Capitale-Nationale (around Québec City) (positive net flow of about 21,000 jobs). Within these clusters, the main sources of labour are Montérégie (with a negative net flow of 144,000 jobs), Lanaudière (with a negative net flow of 79,000 jobs), Laurentides (with a negative net flow of 66,000 jobs) and Hamilton–Niagara Peninsula (with a negative net flow of 61,000 jobs).
Note to readers
This release incorporates an update to 2021 data on provincial and territorial labour productivity and related measures. No revisions have been made to data for previous years.
These data are consistent with those incorporated in the provincial and territorial gross domestic product (GDP) by industry for 2021, released on May 2, 2022. They are also consistent with those incorporated in the national GDP by industry, released on April 30, 2022.
Preliminary estimates also take into account revised data of the Survey of Employment, Payrolls and Hours for 2021 (released on March 29, 2022). They also incorporate revised data of Labour Force Survey (released on January 24, 2022).
In an effort to increase the relevance of provincial and territorial data, two new tables—which contain a series of experimental labour statistics data by economic region and work schedule—are released today for the first time. More precisely, these new tables represent an expansion to the table 36-10-0489-01. The first new table (36-10-0675-01) contains labour statistics by economic region and job category. The data in this table also include the mobility of workers between Canada and the United States (international flows) and between economic regions of Canada (interregional flows). The second new table (36-10-0676-01) contains labour statistics by work schedule (full-time or part-time). For employees, this new table also contains estimates of hours paid compared with hours worked.
Productivity measures
The term productivity in this release refers to labour productivity. For the purposes of this analysis, as in the national labour productivity releases, productivity and related measures cover the business sector only. However, average hourly wages for full-time and part-time paid workers and the net flows of jobs by economic region in this analysis are focused on the total economy.
Labour productivity is a measure of real gross domestic product per hour worked. Productivity gains occur when the production of goods and services grows faster than the volume of work dedicated to their production.
Economic performance, as measured by labour productivity, must be interpreted carefully, as these data reflect changes in other inputs, in particular capital, in addition to the efficiency growth of production processes. As well, growth in labour productivity is often influenced by the degree of diversity in the industrial structure. As a result, labour productivity tends to be more volatile in the smaller provinces.
It is important to note that real output (used to measure productivity) is based on the value added measured at basic prices, not market prices, which is consistent with the detailed framework by industry.
As well, the real estate, rental and leasing industry, part of the service-producing business sector, excludes the imputed rent for owner-occupied dwellings as there are no data on the number of hours that homeowners spend on dwelling maintenance services.
Next release
Revised estimates of hours worked and labour productivity in the provinces and territories for 2019 to 2021 will be published on February 10, 2023, with the incorporation of the new benchmark data from the provincial and territorial supply and use tables for reference year 2019.
Products
The Economic accounts statistics portal, accessible from the Subjects module of our website, features an up-to-date portrait of national and provincial economies and their structure.
The Latest Developments in the Canadian Economic Accounts (13-605-X) is available.
The User Guide: Canadian System of Macroeconomic Accounts (13-606-G) is also available.
The Methodological Guide: Canadian System of Macroeconomic Accounts (13-607-X) is also available.
Contact information
For more information, or to enquire about the concepts, methods or data quality of this release, contact us (toll-free 1-800-263-1136; 514-283-8300; infostats@statcan.gc.ca) or Media Relations (statcan.mediahotline-ligneinfomedias.statcan@statcan.gc.ca).
- Date modified:


