Urban public transit, December 2021
Archived Content
Information identified as archived is provided for reference, research or recordkeeping purposes. It is not subject to the Government of Canada Web Standards and has not been altered or updated since it was archived. Please "contact us" to request a format other than those available.
Released: 2022-02-28
Highlights
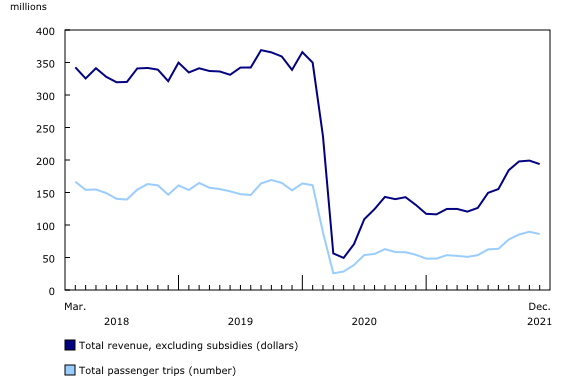
Canada's urban transit networks carried an estimated 86.0 million riders in December 2021, 4% fewer than the pandemic-era high posted in November. The transit industry has recovered nearly three-fifths (56.1%) of the pre-pandemic ridership from December 2019.
With an increasing vaccination rate, provincial re-openings and the resumption of in-class learning, transit ridership continued to recover in 2021. For the year, 771.8 million passenger trips were made, down 9.1%, or 77.3 million fewer rides from 2020 levels.
Ridership up but remains low
In December 2021, an estimated 86.0 million passenger trips were made on Canada's urban transit networks, up 31.8 million trips or 58.7% from December 2020 levels. This was the second-highest month of passenger trips since the onset of the pandemic in March 2020. However, there were 67.3 million fewer riders in December 2021 compared with the same month in 2019.
On a monthly basis, transit ridership decreased by 4.0% from November 2021, somewhat less than the seasonal drop observed pre-pandemic. The extent to which rising COVID-19 cases attributed to the Omicron variant affected December ridership was not clear, but should become more apparent in January.
Financial situation continues to improve
In December 2021, transit agency operating revenues (excluding subsidies) were $193.7 million—an increase of 48.0%, or $62.8 million, from December 2020 levels. While this total revenue was the second highest level recorded since March 2020, it was 42.8% lower than the operating revenues earned in December 2019, prior to the pandemic.
A look at 2021
In 2021, transit ridership began to gradually recover. For the year as a whole, there were about 771.8 million passenger trips made on Canada's urban transit networks, 77.3 million or 9.1% fewer rides than in 2020. However, it should be noted that almost half (48.7%) of the 2020 total ridership was from the first quarter, essentially before the pandemic.
Ridership has gradually recovered from the low of April 2020, when transit agencies carried roughly 25.7 million passengers or about 16.3% of the April 2019 level (157.3 million). Many people were working from home while students learned remotely, amid widespread lockdowns. Ridership gradually began to recover during the summer, reaching a pandemic high of 62.9 million riders in September 2020—essentially 38.4% of pre-pandemic 2019 ridership.
As 2021 progressed, transit ridership further recovered as vaccination rates increased and restrictions were eased. As more people returned to workplaces, students attended in-person classes and consumers resumed shopping, dining out and attending entertainment venues, passenger volumes hit a new pandemic-era high of 89.6 million rides in November 2021, exceeding more than half (54.4%) of the pre-COVID-19 volume for the first time.
Overall, transit was on a steady path to recovery in 2021, with ridership as a percentage of the pre-pandemic 2019 levels increasing steadily from 27.1% in January to 56.1% in December. Despite this progress, there were 1.1 billion fewer riders in 2021 than in 2019, with agencies in Quebec and Ontario accounting for more than two-thirds (70.7%) of this drop.
Low ridership continued to impact transit agency finances. In 2021, total operating revenues (excluding subsidies) reached $1.8 billion, down 5.7%, or $108.8 million from 2020 levels, but still $2.3 billion lower than the operating revenues earned in 2019, prior to the pandemic.
Note to readers
Data for the most recent quarter are subject to revision. The data in this release are not seasonally adjusted.
This survey collects data on operating revenue (excluding subsidies) and the number of passenger trips from a panel of urban transit companies that represents at least 75% of revenues in each province and territory. Note that the panel is adjusted annually to maintain the 75% coverage and could differ slightly from what it was in the same month a year earlier.
Data prior to January 2017 can be found in table 23-10-0078-01.
The Transportation Data and Information Hub, a web portal developed jointly by Statistics Canada and Transport Canada, provides Canadians with online access to comprehensive statistics and measures on the country's transportation sector.
Contact information
For more information, or to enquire about the concepts, methods or data quality of this release, contact us (toll-free 1-800-263-1136; 514-283-8300; infostats@statcan.gc.ca) or Media Relations (statcan.mediahotline-ligneinfomedias.statcan@statcan.gc.ca).
- Date modified:


