
 StatCan COVID-19: Data to Insights for a Better Canada Public transit in a post-COVID-19 Canada
Text begins
Labour Force Survey points to ridership challenge
In late January of 2020, the first case of the new coronavirus (COVID-19) was documented in Canada. Less than two months later, public health measures including business and school closures as well as physical distancing prompted a massive shift to remote work and learning, contributing to historic declines in transit ridership during the months that followed. Since that time, Statistics Canada's Labour Force Survey (LFS) has been tracking the proportion of non-absent workers who worked from home.
Earlier, the agency examined two specific aspects of working from home during the pandemic. In the first case, questions were added to the February LFS as to the productivity and preference of Canadians working from home.Note 1 The second focused on the potential impact of reduced commuting times and traffic congestion on greenhouse gas (GHG) emissions.Note 2 Our study traces the impact of working from home on the number of public transit passengers and points to factors that may be key in shaping a new normal for the public transit industry.
Working from home reduces transit trips
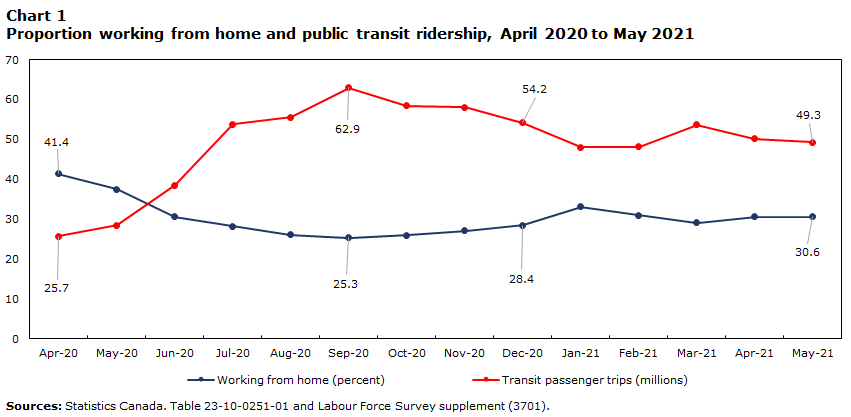
In May 2021, the number of Canadians who worked from home was at 5.1 million or 30.6% of the employed labour force, similar to that observed in June 2020.Note 3 After declining over last summer from the high of 41.4% in April 2020, the proportion of Canadians working from home dropped to 25.3% during September. However, the proportion slowly increased to the end of 2020, largely as a result of tighter public health measures to combat a second wave of the virus.
In May of 2021, there were 49.3 million transit passenger trips, much higher than trips taken in the grips of the initial lockdown last May. As restrictions eased, the number of passengers steadily grew last summer and reached almost 63 million by September. As more restrictions followed towards the end of the year, ridership dipped back under 50 million in early 2021. While ridership reached almost 54 million in March of 2021, the spring saw fewer commuters in Quebec, Ontario and British Columbia as a result of stricter measures to combat a third wave.
Data table for Chart 1
| Working from home (percent) | Transit passenger trips (millions) | |
|---|---|---|
| Apr-20 | 41.4 | 25.7 |
| May-20 | 37.5 | 28.4 |
| Jun-20 | 30.6 | 38.5 |
| Jul-20 | 28.2 | 53.8 |
| Aug-20 | 26.1 | 55.5 |
| Sep-20 | 25.3 | 62.9 |
| Oct-20 | 25.9 | 58.4 |
| Nov-20 | 27.1 | 58.1 |
| Dec-20 | 28.4 | 54.2 |
| Jan-21 | 33.1 | 48.0 |
| Feb-21 | 30.9 | 48.2 |
| Mar-21 | 29.1 | 53.7 |
| Apr-21 | 30.6 | 50.2 |
| May-21 | 30.6 | 49.3 |
| Sources: Statistics Canada. Table 23-10-0251-01 and Labour Force Survey supplement (3701). | ||
Monthly data recorded since last April clearly reflect the strong and negative relationship between the proportion of the employed labour force working from home and transit ridership; with the series moving in opposite directions (Chart 1). For instance, the lowest proportion of working from home was recorded in September 2020 (25.3%), which coincided with the highest monthly passenger trips (62.9 million) since the pandemic.
A Pearson correlation coefficientNote 4 was calculated based on April 2020 to May 2021 data and the r value of -0.94 confirms a strong, inverse relationship overall. In other words, on average each 10% increase in the percentage of Canadians working from home during the pandemic has translated into an almost equivalent decline (i.e., 9.4%) in the number of transit passengers. Of course, the strength of this relationship varies depending on where you live and the type of work.
Regional and industrial variations
While the pandemic resulted in steep declines in demand for public transit nationally, there were regional differences. From April 2020 to May 2021, transit passengers as a proportion of the same pre-pandemic month averaged just under one-third (30.9%) nationally. In Atlantic Canada, transit agencies in the four provinces maintained more than 40% of their 2019 monthly ridership through the pandemic (Chart 2).Note 5 Likewise Manitoba and Saskatchewan were close to maintaining 40% of their pre-pandemic ridership levels. All of these provinces averaged just above or just below 20% of their workers working from home over this same pandemic period.

Data table for Chart 2
| Monthly average from April 2020 to May 2021 | ||||||||||
|---|---|---|---|---|---|---|---|---|---|---|
| N.L. | P.E.I. | N.S. | N.B. | Que. | Ont. | Man. | Sask. | Alta. | B.C. | |
| percent | ||||||||||
| Proportion of workers working from home | 17.9 | 20.0 | 23.2 | 20.5 | 29.5 | 36.0 | 21.6 | 19.6 | 26.7 | 27.7 |
| Proportion of pre-pandemic transit passengers | 47.5 | 47.5 | 47.5 | 41.7 | 32.8 | 25.6 | 38.3 | 38.3 | 30.7 | 37.7 |
| Sources: Statistics Canada. Table 23-10-0251-01 and Labour Force Survey supplement (3701). | ||||||||||
In contrast, Quebec, Ontario and Alberta had, on average, more of their workers working from home during April 2020 to May 2021 (29.5%, 36.0% and 26.7% respectively). These three provinces experienced lower proportions of pandemic to pre-pandemic ridership levels during this period, closer to 30% or lower. British Columbia is in-between these two groups of provinces, with a relatively high proportion of working from home (27.7%) on average, but still maintaining well over one-third (37.7%) of pre-pandemic ridership over the period. To some extent these provincial variations reflect underlying differences in urban and economic structure.
The proportion of Canadians working from home varies by sector. At the April 2020 peak, three-quarters (75.6%) of workers in the Professional, scientific and technical services industry worked from home; this declined to two-thirds (68.2%) by the end of 2020 and has remained there into May (Chart 3). While over four-fifths (82.1%) of workers in Education services worked from home in April 2020, it fell to one-third (33.3%) by December and went back up to almost half (47.4%) in May, reflecting public health measures vis-à-vis in-class learning.

Data table for Chart 3
| April 2020 | December 2020 | May 2021 | |
|---|---|---|---|
| percent | |||
| Professional, scientific & technical services | 75.6 | 68.2 | 67.9 |
| Finance, insurance, real estate, rental & leasing | 67.5 | 64.4 | 66.2 |
| Public administration | 62.6 | 55.6 | 58.4 |
| Educational services | 82.1 | 33.3 | 47.4 |
| Manufacturing | 23.1 | 14.6 | 15.9 |
| Accommodation & food servicesData table Note 1 | 8.3 | 3.0 | 6.3 |
|
|||
In contrast, less than one quarter (23.1%) of workers in Manufacturing worked from home in April of 2020 and has since declined to around 15%. In Accommodation and food services, where work generally requires close physical proximity to others, there has been just a fraction of employees working from home during the pandemic. Other sectors are somewhere in-between. These differences by industry may impact some groups of workers more than others depending on socio-economic characteristics such as age, education, race and immigration status for example.
The road ahead for transit
As working from home and other measures are now extended into a second year, the key question may not be when but rather if public transit ridership will fully recover to pre-pandemic levels. In an earlier study (see Endnote 2), Statistics Canada estimated that a transition to full telework capacity could reduce the total number of commutes in a given year by workers who were previously using public transit by roughly one half (52%), greatly reducing demand for public transit.Note 6 Any reduction in public transit use would of course vary geographically.
For instance, the study estimates that the annual number of public transit commutes—at full telework capacity—could fall by as little as 26% in Windsor, Ontario to as much as 62% in Ottawa–Gatineau. This difference illustrates the importance of where you live and the type of employment. Windsor is a more decentralized urban area without rapid transit and a heavier reliance on manufacturing jobs. In contrast, Ottawa-Gatineau has more workers in public administration that are based in denser employment hubs served by rapid transit.
This earlier analysis assumes that the Canadian economy can transition to fully utilize telework capacity. While such a transition seems unlikely, some form of working from home may continue to be an option post-pandemic. To address this and related matters, the Statistics Canada cross-economy Canadian Survey on Business Conditions (second quarter of 2021) included questions regarding the specific measures adopted by businesses during the pandemic and the likelihood of continuing with them permanently.Note 7
Of those businesses that adopted working from home during the pandemic, just over half (57.7%) are likely to require employees to come back to work on-site; ranging from one-third (33.8%) of businesses in the Professional, scientific and technical services industries to two-thirds (67.8%) of those in Accommodations and food services. However, among these businesses, over one-quarter intend to offer more employees the possibility of teleworking (27.1%) and increase IT infrastructure to support teleworking (29.8%) as a permanent measure.
It appears there are several possible roads to take and, for each transit agency, it will depend on several factors such as city size as well as the underlying urban and economic structure, provincial and local government policy, health restrictions, and vaccination rates. Technology will cut both ways by, on the one hand, enhancing telework solutions that encourage working from home and, on the other, by providing options such as touch-less fare payment and other assurances to alleviate passenger health concerns. Regardless, there will be a new normal for urban transit.
Data and definitions
Statistics Canada’ Monthly Passenger Bus and Urban Transit Survey (MBUS) collects data on total operating revenues (excluding subsidies) and on total number of passengers (i.e., trips). The survey covers a panel of establishments which have urban transit operations and collectively account for at least 75% of transit operating revenue in each province.
At the onset of the pandemic, supplementary questions were added to the Monthly Labour Force Survey, which provides estimates on employment, hours and work arrangements by industry, occupation and sector. Working from home is defined as the proportion of non-absent workers, who worked at least half of their usual hours, working from home.
- Date modified: