Gross domestic product, income and expenditure, third quarter 2021
Archived Content
Information identified as archived is provided for reference, research or recordkeeping purposes. It is not subject to the Government of Canada Web Standards and has not been altered or updated since it was archived. Please "contact us" to request a format other than those available.
Released: 2021-11-30
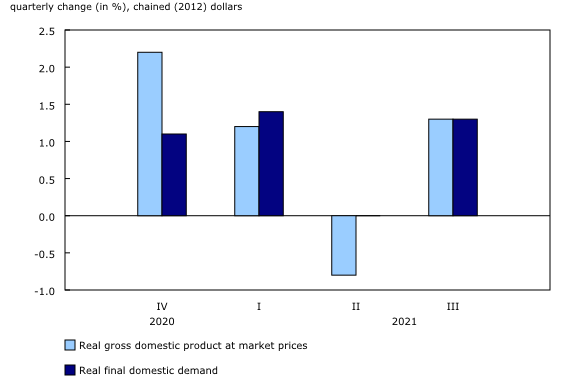
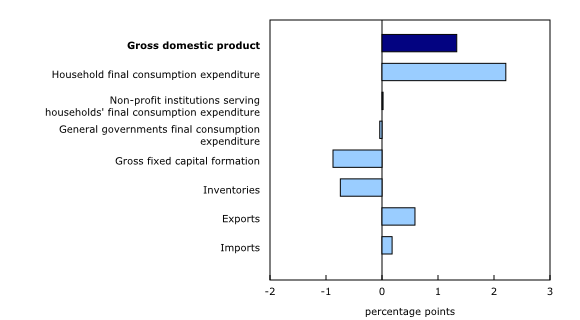
Real gross domestic product (GDP) rose 1.3% in the third quarter, driven by household spending and exports. As pandemic restrictions were phased out, households and businesses, in Canada and elsewhere resumed normal operations. This raised household spending and created a greater demand for exports.
These increases were softened by a substantial decline in housing investments and increased withdrawals of inventories in the quarter.
Household spending rises
Driven by higher income and greater demand, household spending on semi-durable goods (+14.0%) and services (+6.3%) sharply increased.
As restrictions eased, increased spending on semi-durable goods and services reflected the increase in activities outside the home. Expenditures on clothing (+26.8%) and footwear (+30.3%) surpassed pre-pandemic spending. Outlays for services rose sharply. Transport services (+40.3%), recreation and culture services (+26.1%), food, beverages and accommodation services (+29.0%), and personal grooming services (+35.8%) all showed significant increases.
Real expenditures on durable goods (-1.4%) fell in the quarter. Higher prices, resulting partly from supply chain disruptions, constrained demand and spending.
Exports rebound
After declining in the second quarter, exports (+1.9%) increased in the third quarter, led by crude oil exports. Imports decreased, with lower imports of pharmaceutical products and toys, games and small appliances leading the decline. The terms of trade fell, as higher growth in import prices outpaced export prices, reversing the marked increases in the previous four quarters.
Housing investment declines
After four consecutive quarters of strong growth, new construction and renovations fell in the third quarter. The 5.2% drop in new construction was the largest drop since the second quarter of 2009. The decrease in investments for the new construction of detached and multiple-unit dwellings was substantial, especially in Newfoundland and Labrador and Prince Edward Island. Nationally, there were $96.3 billion additions to the stock of dwellings in the third quarter.
Ownership transfer costs (-10.0%) fell for the second consecutive quarter, as activity in the resale market slowed. The decrease was widespread, and only Newfoundland and Labrador and Yukon posted increased ownership transfer costs.
Remarkable accumulation of residential mortgage liabilities in the previous quarter continued, with households adding $38 billion in the third quarter, more than double that of two years earlier.
Compensation of employees rises
Growth in nominal GDP (+2.1%) was led by compensation of employees.
Compensation of employees rose 2.9%, the largest increase since the second quarter of 2000, excluding the large rebound recorded in the third quarter of 2020. Growth in professional and personal services accounted for almost half the overall increase in wages and was driven by accommodation and food services. Other major contributors to the increase were trade, health and education. The estimates of compensation of employees also reflect wages associated with the federal election and the census, and the implementation of various collective bargaining agreements.
Wage growth was highest in British Columbia (+3.8%), followed by Alberta (+3.2%), Ontario (+3.1%) and Quebec (+2.2%).
Double-digit household savings rate continues
Growth in household spending (+5.4% in nominal terms) exceeded growth in household disposable income (+1.7%). Consequently, the household saving rate fell from 14.0% in the second quarter to 11.0% in the third quarter. Although spending surpassed income this quarter, this was the sixth consecutive quarter with a double-digit savings rate. The rate also remained higher than in the pre-pandemic period. The household savings rate is aggregated across all income brackets. In general, savings rates are greater in higher income brackets.
Sustainable development goals
On January 1, 2016, the world officially began implementing the 2030 Agenda for Sustainable Development—the United Nations' transformative plan of action that addresses urgent global challenges over the following 15 years. The plan is based on 17 specific sustainable development goals.
Data on gross domestic product, income and expenditure are an example of how Statistics Canada supports the reporting on global sustainable development goals. This release will be used to measure the following goals:


Note to readers
Revisions to GDP
In this release, new benchmark values from the supply and use tables for the 2018 reference year have been incorporated into the gross domestic product (GDP) by the Income and Expenditure Accounts. Revisions for the 2019 and 2020 reference years incorporated up-to-date information from the Annual Survey of Manufacturing and Logging, the Annual Survey of Research and Development in Canadian Industry, the Annual Census of Mines, Quarries and Sand Pits, government public accounts, administrative data, and farm crop data. These revisions also reflect incorporation of T4 data for 2019 and preliminary T4 data for 2020. Revisions also occurred due to seasonal adjustment.
As a result, Canada's real GDP growth rate was revised up from 2.43% to 2.78% for 2018, from 1.86% to 1.88% for 2019, and from -5.31% to -5.23% for 2020. This release also provides revised data for the first and second quarter of 2021, and new data for the third quarter of 2021.
Estimates for the first and second quarters of 2021 were revised to incorporate revisions from sub-annual surveys. Revisions from programs such as the Quarterly Financial Statements Survey, the Monthly Survey of Manufacturing, the Survey of Employment, Payroll and Hours, and the Monthly Retail Trade affected the data that feed into these estimates. Updated data on government revenue and expense components (including those on government support measures related to the COVID-19 pandemic), international trade as well as updated crop yield projections were also incorporated.
With the estimation of the third quarter, the seasonal adjustment pattern will change the previous quarters. Given the volatility in some series over the course of the pandemic and ongoing recovery, larger-than-normal revisions due to seasonal adjustment are expected in those series.
Real GDP growth was revised down from 1.4% to 1.2% for the first quarter of 2021, and from -0.3% to -0.8% for the second quarter of 2021.
GDP estimates by income and by expenditure are subject to various types of revisions that take place with each quarterly release depending on the availability of data and the practicality of implementation. The 2018 to 2020 revisions of the Income and Expenditure Accounts summarizes them and tracks revisions from one cycle to another. For information on the GDP revision cycle, see GDP revision cycle.
Support measures by governments
To alleviate the economic impact of the pandemic, governments implemented programs, such as the Canada Emergency Wage Subsidy, and the recently ended Canada Emergency Rent Subsidy and the Canada Recovery Benefit. A comprehensive explanation of how government support measures were treated in the compilation of the estimates is available in "Recording COVID-19 measures in the national accounts" and "Recording new COVID measures in the national accounts."
Details of some of the more significant government measures can be found on the page Federal government expenditures on COVID-19 response measures.
For information on seasonal adjustment, see Seasonally adjusted data – Frequently asked questions.
For more information on GDP, see the video "What is Gross Domestic Product (GDP)?"
General
Percentage changes for expenditure-based statistics (such as household spending, investment, and exports) are calculated from volume measures that are adjusted for price variations. Percentage changes for income-based statistics (such as compensation of employees and operating surplus) are calculated from nominal values; that is, they are not adjusted for price variations.
Unless otherwise stated, growth rates represent the percentage change in the series from one quarter to the next; for instance, from the second quarter of 2021 to the third quarter of 2021.
With this release, data for the first quarter of 1961 to the fourth quarter of 1980 have been re-estimated to fully align with the expenditure categories and sector detail of government final consumption expenditures thereby producing a consistent time series back to 1961.
Real-time tables
Real-time tables 36-10-0430-01 and 36-10-0431-01 will be updated on December 6.
Next release
Data on GDP by income and expenditure for the fourth quarter of 2021 will be released on March 1, 2022.
Products
The data visualization product "Gross Domestic Product by Income and Expenditure: Interactive tool," which is part of Statistics Canada – Data Visualization Products (71-607-X), is now available.
The document, "The 2018 to 2020 revisions of the Income and Expenditure Accounts," which is part of Latest Developments in the Canadian Economic Accounts (13-605-X), is now available.
The data visualization product "Infrastructure Statistics Hub," which is part of Statistics Canada – Data Visualization Products (71-607-X), is now available.
The data visualization product "Overview of the stock and consumption of fixed capital program: Interactive tool," which is part of Statistics Canada – Data Visualization Products (71-607-X), is now available.
The document, "Recording new COVID measures in the national accounts," which is part of Latest Developments in the Canadian Economic Accounts (13-605-X), is available.
The Economic accounts statistics portal, accessible from the Subjects module of our website, features an up-to-date portrait of national and provincial economies and their structure.
The User Guide: Canadian System of Macroeconomic Accounts (13-606-G) is available.
The Methodological Guide: Canadian System of Macroeconomic Accounts (13-607-X) is available.
Contact information
For more information, or to enquire about the concepts, methods or data quality of this release, contact us (toll-free 1-800-263-1136; 514-283-8300; STATCAN.infostats-infostats.STATCAN@statcan.gc.ca) or Media Relations (STATCAN.mediahotline-ligneinfomedias.STATCAN@statcan.gc.ca).
- Date modified:


