Consolidated Canadian Government Finance Statistics, 2020
Archived Content
Information identified as archived is provided for reference, research or recordkeeping purposes. It is not subject to the Government of Canada Web Standards and has not been altered or updated since it was archived. Please "contact us" to request a format other than those available.
Released: 2021-11-22
COVID-19: Historic deficit for the Canadian general government
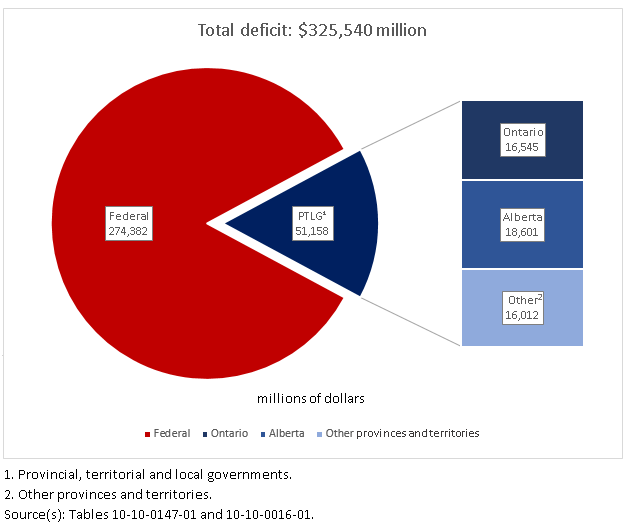
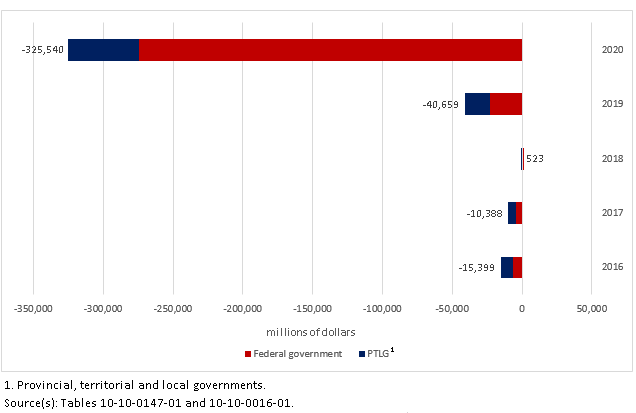
In 2020, the consolidated Canadian general government (CGG), which includes all federal, provincial, territorial and local governments, posted a historic deficit in the order of $325.5 billion. Increased expenses (+30.7%), particularly in health care and social protection, and, to a lesser extent, decreased revenues (-1.9%) related to the COVID-19 pandemic, simultaneously worsened the deficit. By comparison, the deficit was $40.7 billion in 2019, whereas the consolidated government finances were balanced in 2018. As a percentage of nominal gross domestic product (GDP), the deficit amounted to 14.8% in 2020, compared with 1.8% in 2019.
The federal government accounted for the majority ($274.4 billion) of the CGG deficit in 2020, while the consolidated provincial, territorial and local governments (PTLGs) recorded a deficit of $51.2 billion. Compared with 2019, the federal government deficit increased almost twelvefold (+1,095.8%), while the deficit of the PTLGs nearly tripled (+188.8%).
Impacts of COVID-19 pandemic on the 2020 reference year
The 2020 reference year corresponds to the fiscal year ending March 31, 2021, for the federal, provincial and territorial governments. The current estimates include most support measures for businesses, such as the Canada Emergency Wage Subsidy (CEWS), and those for individuals, such as the Canada Emergency Response Benefit (CERB).
However, some governments have not finished tabulating their program expenditures and published their public accounts. Although these measures were taken into account in this release, revisions are to be expected when the final data become available.
The net operating balance, also referred to as surplus or deficit, is calculated as revenues minus expenses over a given reference period. It constitutes a summary measure of the sustainability of government operations.
Federal government revenues decreased by 0.8% compared with 2019, a $2.6 billion decline. Compared with 2019, federal personal income tax was down $4.4 billion in 2020, while the goods and services tax (GST) was down almost $1 billion. Because travel was more limited in 2020, the gasoline and motive fuel taxes generated $749 million less than in 2019.
Federal government budget initiatives in response to the COVID-19 pandemic result in a historic deficit in 2020
Nationwide, the federal government assumed a large share of the COVID-19 pandemic costs in 2020. As such, federal government expenses increased significantly compared with 2019, rising from $361.1 billion to $610.0 billion in 2020—an increase of $248.9 billion (+68.9%). This increase was primarily attributable to the transfer expenses in response to the COVID-19 pandemic. Business subsidies, including CEWS, jumped 896.5% to $86.3 billion in 2020. Transfers to households in the form of social benefits, including CERB, more than doubled (+107.6%) to $225.0 billion. Finally, grants totalled $148.3 billion, up 27.0% compared with 2019. These grants were primarily transfers to the provincial, territorial, local and Indigenous governments ($142.4 billion).
Unlike with the federal government, PTLG revenues increased 2.2% in 2020 to reach $617.4 billion, despite a decrease in tax revenues (-1.1%). This was caused by a 25.9% increase in federal government grants, which peaked at $125.4 billion.
Meanwhile, PTLG expenses grew by 7.5% in 2020, following an increase of 4.5% in 2019.The PTLGs also implemented significant support measures in response to the pandemic—though more modest in terms of the amounts—as evidenced by the 24.7% increase in business subsidies (+$6.5 billion) and the 10.3% increase in social benefit payments (+$5.5 billion). The main expense items, namely compensation of employees (+6.1%) and the use of goods and services (+10.3%), also grew.
At the PTLG level, only Prince Edward Island ($84 million or 1.1% of the GDP) and Nunavut ($59 million or 1.4% of the GDP) recorded a surplus in 2020. By contrast, the biggest deficits expressed as a percentage of GDP were seen in Newfoundland and Labrador (6.4%), Alberta (6.3%), the Northwest Territories (4.0%) and Saskatchewan (3.5%). In Quebec, a deficit (1.0% of GDP) was recorded for the first time since 2013, and in British Columbia (1.3% of GDP), for the first time since 2012.
The drop in nominal gross domestic product, bigger than the decrease in government tax revenues, increases the fiscal burden
Fiscal burden measures the taxes and social contributions (compulsory transfers) paid to governments by individuals, businesses and non-residents, expressed as a percentage of GDP.
CGG revenues in the form of taxes and social contributions (-1.1%) decreased for the first time since the financial crisis of 2008, following the weakest growth (+0.4%) recorded since 2008.
Taxes and social contributions totalled $684.0 billion in 2020, making up 83.3% of total revenues generated by the CGG in 2020. This amounted to $17,928 per capita, compared with $18,209 per capita in 2019.
Using the nominal GDP as a tax base measure, the CGG collected 31.0% in taxes and compulsory social contributions in 2020, an increase of 1.1 percentage points compared with 2019. This is explained by the marked drop of the nominal GDP in 2020 (-4.5%). The federal government and the PTLGs contributed almost equally to the increased fiscal burden in 2020.
At the provincial level, the fiscal burden as a percentage of GDP ranged from 11.2% in Alberta to 22.0% in Quebec, and amounted to 16.9% for all provinces and territories. The territories recorded a significantly lower fiscal burden than the provincial average, with Nunavut posting the lowest in 2020, at 4.1%. The territories rely heavily on federal transfers to deliver essential goods and services to the population. In 2020, taxes and social contributions accounted for 11.8% of total revenues in the territories, compared with 76.0% of total revenues tied to transfers from the federal government. These transfers represented $52,446 per capita in Nunavut, $40,654 in the Northwest Territories and $31,583 in Yukon.
Marked increase in federal transfers to the provinces and territories for support during the pandemic
The federal government extends different types of grants to provinces and territories to help them provide essential programs and services to all Canadians, such as health care, education, social assistance and childhood development. The largest transfers are the Canada Health Transfer, the Canada Social Transfer, equalization payments and territorial formula financing.
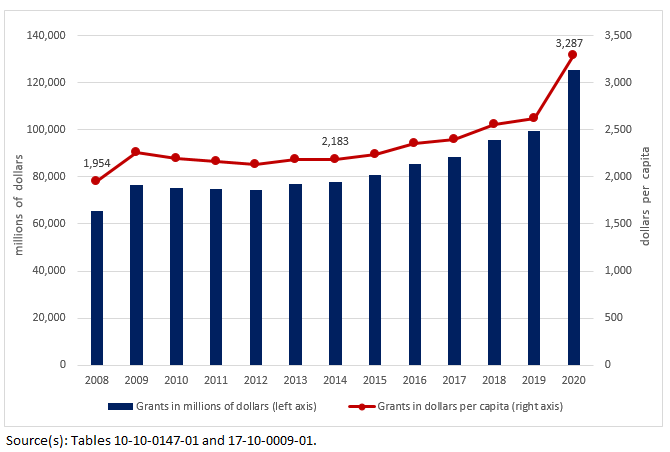
In 2020, the federal government transferred additional amounts to the provinces and territories to address the significant increase in health expenditures in particular, related to the COVID-19 pandemic. The provinces and territories received $125.4 billion in the form of grants (current transfers), up 25.9% compared with 2019. This amount excludes what was paid to households under income support programs, such as the CERB, as well as the amounts paid directly to businesses, such as the CEWS.
Federal grants received by the PTLGs reached a record $3,287 per capita in 2020, compared with $2,621 in 2019. Grants received by Quebec ($32.8 billion) and Ontario ($39.7 billion) represented 57.8% of the total federal government grants to the PTLGs. These two provinces had 61.3% of the Canadian population in 2020.
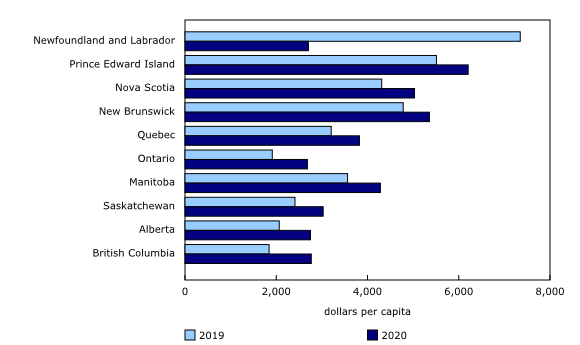
Among all the provinces, Prince Edward Island received the highest grants per capita ($6,206) in 2020, followed by New Brunswick ($5,357) and Nova Scotia ($5,031). By contrast, Ontario received the lowest grants per capita ($2,683), closely followed by Newfoundland and Labrador ($2,705), Alberta ($2,750) and British Columbia ($2,768).
Debt charges remain historically low despite record debt levels
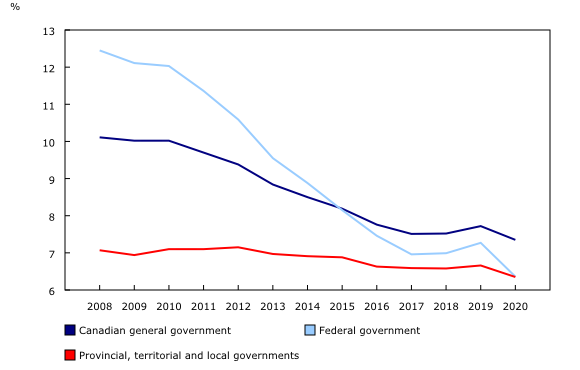
In 2020, the CGG paid 7.4 cents in interest charges for every dollar of revenue received, down from 7.7 cents in 2019. Interest expenses accrued on debt liabilities totalled $60.4 billion (or $1,583 per capita), compared with $64.7 billion in 2019. The interest expense to revenue ratio declined despite an increase of 23.0% or $405.9 billion in new borrowings in the form of debt securities (treasury bills, other short-term papers, and bonds).
This phenomenon is mostly explained by monetary policy during the pandemic aimed at increasing money supply, encouraging lending and investment (quantitative easing) and keeping short-term interest rates close to zero. This policy had the effect of lowering interest rates on long-term debt. This has enabled governments to finance the unprecedented deficits generated during the pandemic at low cost and to refinance maturing debt at lower rates.
The federal government paid 6.4 cents in interest for every dollar of revenue received in 2020, significantly down from 7.3 cents in 2019. By comparison, when gross debt as a percentage of GDP at the start of the 1990s was around 65% (66.4% in 2020), the federal government paid more than 35 cents in interest for every dollar of revenue received.
At the Canada level for PTLG, the interest expense to revenue ratio also declined, from 6.7% in 2019 to 6.3% in 2020. Amid a steep decline in revenue (-24.9%), Newfoundland and Labrador spent the most on interest per dollar of revenue in 2020 (9.6 cents), closely followed by Quebec (9.3 cents) and Manitoba (9.2 cents).
Gross debt reaches highest level ever recorded, a consequence of historic pandemic
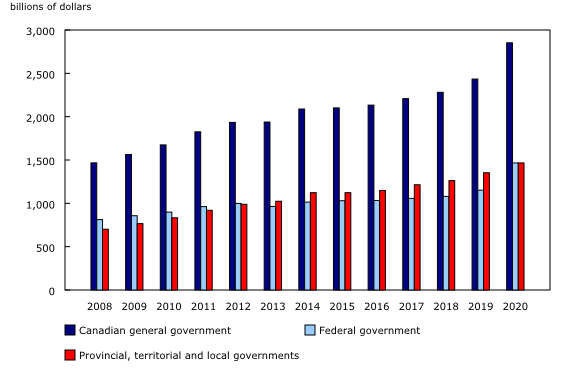
Gross debt of the CGG jumped to 129.2% of GDP in 2020 from 105.3% in 2019, the highest level ever recorded. The sum of all liabilities reached $2,852 billion or $74,747 per capita in 2020, an increase of $10,685 in debt for every Canadian in just one year.
This increase in debt (+$417.5 billion) is primarily driven by massive deficits ($325.5 billion) generated to finance numerous relief measures, notably in the form of transfers to households and subsidies to businesses during the pandemic. The increase was also caused by unprecedented liquidity support measures to stabilize the economy and preserve the financial system, such as funding for emergency loans and purchase of assets, notably mortgages.
For the first time since 2012, the federal gross debt ($1,466.0 billion or 66.4% of GDP) surpassed that of PTLG ($1,465.6 billion or 66.4% of GDP), albeit very slightly. The federal government contributed three-quarters of the increase of CGG's gross debt in 2020, including issuing $321.8 billion in new debt securities. The Bank of Canada has played an important role in supporting the federal government's debt operations, which exceptionally held about 33% of federal treasury bills and bonds outstanding at the end of the period.
Net debt surges too, but remains well below the level of the mid-1990s
Net liability of the CGG ($1,560.0 billion) jumped to 70.7% of GDP in 2020, compared with 55.1% in 2019. By comparison, the peak was reached in the mid-1990s when net liability stood at over 100% of GDP. Net liability corresponds to total liabilities less total financial assets and is referred to as net debt in public accounts. Net debt is a key indicator to assess the sustainability of fiscal policy.
The increase in CGG's net debt is mainly attributable to the federal government. The federal net debt rose by $253.4 billion in 2020 to reach $942.5 billion or 42.7% of GDP, compared with 29.8% in 2019. Financial assets for the federal government grew 13.2% to $523.5 billion, while liabilities increased by 27.3% to $1,466.0 billion. Debt securities ($1,165 billion) and federal employees' pension plans liabilities ($167.7 billion) represented 90.9% of total liabilities in 2020.
Despite this exceptional jump in the federal net debt-to-GDP ratio during the pandemic, the ratio (42.7%) remains well below the record levels observed in the mid-1990s (around 70%), when the country was facing one of the worst budget crises in its history.
For its part, PTLG's net debt rose by $34.0 billion in 2020 to reach $617.5 billion or 28.0% of GDP, compared with 25.2% in 2019. Among the provinces, the largest increases were recorded in Alberta (+33.1%), Saskatchewan (+22.3%) and British Columbia (+17.1%). In absolute terms, net liability grew by $31.7 billion in Ontario and Alberta alone ($21.5 billion and $10.2 billion, respectively), contributing to 93.4% of the total PTLG increase in net debt. Prince Edward Island (-8.6%), New Brunswick (-6.8%) and Quebec (-1.8%) were the only jurisdictions to record a decrease in net debt, compared with 2019.
Newfoundland and Labrador recorded the highest PTLG net debt per capita in 2020, at $21,580, followed by Ontario ($21,282) and Manitoba ($20,641). Expressed as a percentage of GDP, the highest net debt was recorded in Manitoba (39.2%), followed by Quebec (37.5%), Ontario (36.3%) and Newfoundland and Labrador (35.5%). Among the provinces, British Columbia posted the lowest net debt per capita ($2,932 or 4.9% of GDP) in 2020, well below the Canada level total for PTLG ($16,185 or 28.0% of GDP).
Yukon and Nunavut were the only jurisdictions to post a positive net financial worth (total financial assets minus total liabilities) in 2020, although net financial worth had declined slightly in both territories compared with 2019. Debt in the territories is low compared with the provinces, since their borrowing capacity is restricted to limits set by the federal government.
One of the best years on record for Canada Pension Plan and Quebec Pension Plan investments
The Canada Pension Plan (CPP) and Quebec Pension Plan (QPP) are the largest social security funds in the country. Along with Old Age Security (OAS), they are the foundation of Canada's public retirement income system. In 2020, Canadian workers and employers paid $72.8 billion (+1.5%) in contributions to CPP and QPP. In turn, beneficiaries received $66.9 billion (+4.4%) in pensions and benefits.
For the year, the Canadians' nest eggs grew by a substantial 21.5% amid a significant rise in the value of most assets on the markets during the pandemic—primarily fuelled by very low interest rates, abundant liquidity and high savings rates. The fund's net financial worth reached $592.9 billion or 26.9% of GDP. Since 2008, the CPP fund size has grown more than 4.5-fold, while QPP fund grew by 3.5-fold.
The net financial worth of the CPP and QPP measures the current assets (net financial assets) available for the payment of future social security benefits. At the end of the reference period, net financial worth was $15,541 per capita, up 21.0% from $12,840 in 2019.
Note to readers
This release includes revisions to both unconsolidated and consolidated Canadian Government Finance Statistics (CGFS) data for the 2018 and 2019 reference periods as well as the addition of the 2020 reference period.
Annual data correspond to the end of the fiscal year closest to December 31. For example, data for the federal government fiscal year ending on March 31, 2021 (fiscal year 2020/2021), are reported for the 2020 reference year.
Preliminary CGFS data are published eight months after the end of the fiscal year; therefore, estimates were prepared before several public accounts and financial statements were audited and published by government entities.
CGFS data differ from reports published by governments due to differences in institutional coverage, accounting rules, timing and integration with the Canadian macroeconomic accounts.
Consolidation is a method of presenting one overarching statistic for a set of units. It involves eliminating all transactions and debtor–creditor relationships among the units being consolidated. In other words, the transaction of one unit is paired with the same transaction as recorded for the second unit and both transactions are eliminated.
In 2020, the consolidation method removed $384.2 billion in internal revenues and expenses, as well as $266.2 billion related to internal debtor–creditor relationships for the Canadian General Government (CGG).
Consolidated data are released for the CGG, which combines federal government data with provincial–territorial and local government (PTLG) data but excludes data for the Canada Pension Plan and Quebec Pension Plan.
Consolidated data are also released for the PTLGs, which include provincial and territorial governments, health and social service institutions, universities and colleges, municipalities and other local public administrations, and school boards.
The constitutional framework of PTLGs in the territories differs from that in the provinces, leading to differences in the roles and financial authorities of government. These differences, as well as other geographic, demographic and socioeconomic dissimilarities between the North and the rest of Canada, give rise to marked disparities in government finance statistics.
PTLG data can be compared across provinces and territories because consolidation takes into account differences in administrative structure and government service delivery by removing the effects of internal public sector transactions within each jurisdiction.
Because PTLG finance statistics vary significantly across jurisdictions in Canada due to size differences, per capita data are used to facilitate comparisons. Per capita data are based on population estimates as of April 1 for Canada, the provinces and the territories, available in Table 17-10-0009-01.
Calculations as a percentage of GDP are based on the nominal gross domestic product (GDP) at market prices, expenditure-based, estimates for Canada, the provinces and the territories, available in Table 36-10-0222-01.
In this release, revenues, expenses, assets and liabilities are reported in nominal terms.
Net financial worth is defined as the total value of financial assets minus the total value of liabilities. When financial assets are greater than liabilities the measure is referred to as net financial assets. When liabilities are greater than financial assets the measure is referred to as net liabilities or net debt as per public accounts.
Products
The Canadian Government Finance Statistics 2014 classification structure is now available in the Definitions, data sources and methods module of our website.
Additional information can be found in the Latest Developments in the Canadian Economic Accounts (13-605-X). The User Guide: Canadian System of Macroeconomic Accounts (13-606-G) is also available. This publication has been updated with Chapter 9. Government sector accounts in the Canadian System of Macroeconomic Accounts.
Contact information
For more information, or to enquire about the concepts, methods or data quality of this release, contact us (toll-free 1-800-263-1136; 514-283-8300; STATCAN.infostats-infostats.STATCAN@canada.ca) or Media Relations (613-951-4636; STATCAN.mediahotline-ligneinfomedias.STATCAN@canada.ca).
- Date modified:


