Infographic 2
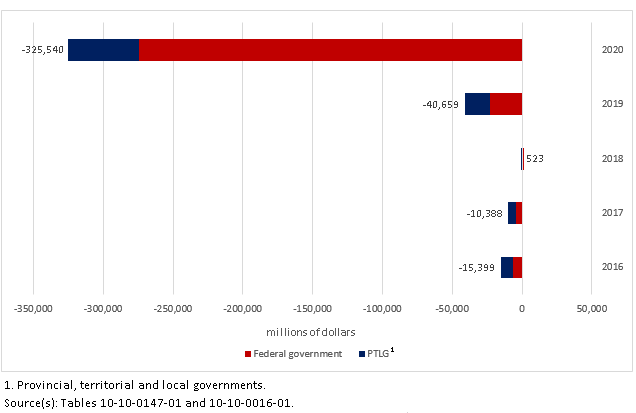
Net operating balance, Canadian General Government, federal government and provincial-territorial and local governments, 2016 to 2020

Infographic description
The title of the infographic is "Net operating balance, Canadian General Government, federal government and provincial-territorial and local governments, 2016 to 2020"
This graph is a stacked bar table.
This graph represents the net operating balance of the Canadian general government, the federal government and the provincial, territorial and local governments in millions of dollars, for 2016 to 2020.
In 2016 the net operating balance was -$6,817 million for the federal government, -$8,581 million for provincial, territorial and local governments and -$15,399 million for the Canadian general government.
In 2017 the net operating balance was -$4,344 million for the federal government, -$6,044 million for provincial, territorial and local governments and -$10,388 million or the Canadian general government.
In 2018 the net operating balance was $1,243 million for the federal government, -$720 million for provincial, territorial and local governments and $523 million for the Canadian general government.
In 2019 the net operating balance was -$22,946 million for the federal government, -$17,714 million for provincial, territorial and local governments and -$40,659 million for the Canadian general government.
In 2020 the net operating balance was -$274,382 million for the federal government, -$51,158 million for provincial, territorial and local governments and -$325,540 million for the Canadian general government.
1. Provincial, territorial and local governments.
Source(s): Tables 10-10-0147-01 and 10-10-0016-01.
- Date modified: