
Household actual final consumption, 2020

Archived Content
Information identified as archived is provided for reference, research or recordkeeping purposes. It is not subject to the Government of Canada Web Standards and has not been altered or updated since it was archived. Please "contact us" to request a format other than those available.
Released: 2021-03-31
Household actual final consumption (HAFC) decreased by 3.2% (-$52.8 billion) in 2020, the first decrease since 2008. The decline was driven by the decrease in household final consumption expenditure, as shutdowns implemented to curb the spread of COVID-19 limited household spending.
HAFC expands on traditional measures of household final consumption expenditures by including the value of social transfers in kind (STiK). STiK measures the value of goods and services provided to households in kind by governments and non-profit institutions serving households (NPISH). The COVID-19 pandemic has had tremendous impacts on the lives of Canadians and also on the services that governments and NPISH provide to households in kind.
Decline in household actual final consumption driven by decline in household final consumption expenditure
In 2020, HAFC decreased to a total value of $1.6 trillion, close to the 2018 level, because of a 5.2% decline in household final consumption expenditure. Household consumption contracted in 2020 as the COVID-19 pandemic and the restrictions put in place to curb its spread limited spending, especially in the first half of the year. However, the decline in household final consumption expenditure was offset by a 4.4% increase in STiK, rising to $365.8 billion in 2020 where it represented 22.9% of HAFC, compared with 21.2% in 2019.
While STiK increased on an annual basis in 2020, there was a 5.8% decline in the second quarter as many services provided by governments and non-profit institutions were limited. As the economy began to reopen, STiK rebounded, increasing by 2.0% in the third quarter and by 7.6% in the fourth quarter.
Chart 1

Components of household actual final consumption, Canada
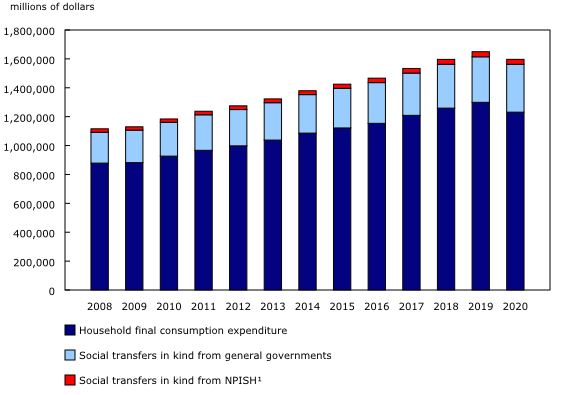
Government social transfers in kind increase the most since 2009
The changes in STiK in 2020 followed a similar pattern to those in 2009, where STiK from governments increased while STiK from non-profit institutions declined. In 2020, STiK provided by governments increased by 5.1%, the largest increase since the 2009 financial crisis (+5.5%). By contrast, social transfers in kind provided by non-profit institutions declined by 2.5%, the largest decline since 2009 (-4.0%).
Chart 2
Change in household actual final consumption components, Canada
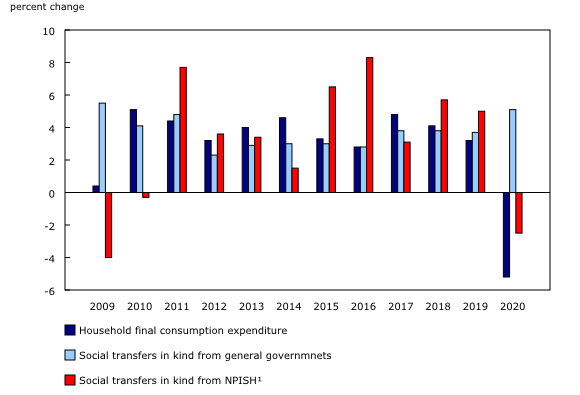
Health leads the increase in social transfers in kind
In 2020, health-related STiK increased by $9.4 billion to a total of $182.1 billion and contributed 2.7 percentage points to the gain in total STiK. This was the largest contribution to change in the past decade, driven by increases in non-wage expenses related to healthcare in response to the pandemic.
Chart 3
Contributions to percentage change in social transfers in kind, Canada, 2009 to 2020

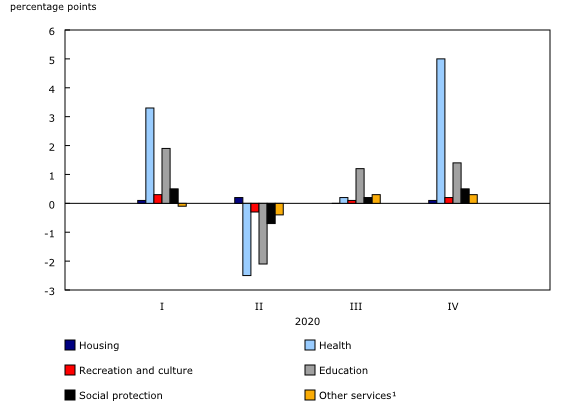
On a sub-annual basis, health related STiK declined by 5.1% in the second quarter of 2020, as hospitals and outpatient clinics cancelled and postponed many services in reaction to the spread of COVID-19. According to data from the Canadian Institute for Health Information, visits to emergency departments across the country in April 2020 were about half of the typical volume for the month. By the fourth quarter of 2020, health-related STiK rebounded to $48.4 billion, led by increases in hospital services, outpatient services, and medical products, appliances and equipment.
Housing-related STiK increased by 15.5% to a total of $7.8 billion in 2020. While this was a record increase for housing STiK it had a minimal 0.3 percentage point contribution to the change in total STiK. Housing-related STiK includes benefits for social protection schemes, such as low-cost or social housing and housing programs that transition people experiencing homelessness into permanent housing through a combination of housing allowances and rent-geared-to-income units.
Chart 4
Contributions to percentage change in social transfers in kind, Canada, first to fourth quarter 2020
Increase in adjusted household disposable income driven by unprecedented increase in household disposable income
In addition to supplementing household consumption expenditures, STiK can be considered as income in kind used to finance the cost of goods and services that households consume free of charge. This parallel income concept, which adds STiK to household disposable income, is known as the adjusted household disposable income. Adjusted household disposable income increased by 8.8% to $1.8 trillion and was driven by the unprecedented increase in household disposable income in 2020. As a share of adjusted household disposable income, STiK represented 20.7% in 2020—a decline from previous years, as the increase in household disposable income exceeded the increase in STiK.
Households aged 65 and over received the most from social transfer in kind
Different households consume goods and services that are financed by governments and NPISH in varying degrees. The distributions of household economic accounts (DHEA) allocates STiK to various household groupings. Using the DHEA, it is evident that households aged 65 and older received the most STiK in 2020 because of their higher share of health STiK (43.3%) than that of other households. Core working age households (35 to 54 years) received the largest share of STiK related to education (63.5%), as these households tend to include a larger share of school-aged children.
On a per capita basis, STiK increased by 3.2% in 2020, totaling $9,624 per person. Health ($4,792) and education ($2,975) represented over 80% of the STiK that each person received in 2020.
Chart 5
Household distributions of social transfers in kind by age, Canada, 2020

Sustainable Development Goals
On January 1, 2016, the world officially began implementation of the 2030 Agenda for Sustainable Development—the United Nations' transformative plan of action that addresses urgent global challenges over the next 15 years. The plan is based on 17 specific sustainable development goals.
Data on household actual final consumption are an example of how Statistics Canada supports reporting on the Global Goals for Sustainable Development. This release will be used in helping to measure the following goal:

Note to readers
Household actual final consumption (HAFC) consists of the consumption of goods and services by households. The value of HAFC is given by summing the following three components:
- The value of household expenditures on consumption of goods or services including expenditures on non-market good or services sold at prices that are not economically significant
- The value of the expenditures incurred by government units on individual consumption of goods or services provided to households as social transfers in kind
- The value of the expenditures incurred by non-profit institutions serving households on individual consumption of goods or services provided to households as social transfers in kind.
With this release, annual data have been revised for 2017 to 2019 to include revisions to the source data and benchmarks from the Income and Expenditures Accounts. Estimates for 2020 were compiled on a sub-annual frequency using the quarterly government finance statistics, quarterly wages and salaries, and quarterly benchmarks from the Income and Expenditure Accounts. The quarterly values are summed to estimate the annual value for 2020. All estimates included in this release are reported in current dollars.
The distributions of household economic accounts (DHEA) provide additional granularity to address questions such as vulnerabilities of specific groups and the resulting implications for economic wellbeing. The DHEA release on March 1, 2021, Household economic well-being during the COVID-19 pandemic, experimental estimates, included estimates of STiK up to the third quarter of 2020. The release today expanded these estimates to include STiK for the fourth quarter and extrapolated the distributions in order to allocate STiK for the entire year.
Products
Details on the sources and methods behind these estimates can be found in the publication Methodological Guide: Canadian System of Macroeconomic Accounts (13-607-X). See the section "Household Actual Final Consumption'' under Satellite Accounts and Special Studies.
The Economic accounts statistics portal, accessible from the Subjects module of our website, features an up-to-date portrait of national and provincial economies and their structure.
The Latest Developments in the Canadian Economic Accounts (13-605-X) is available.
The User Guide: Canadian System of Macroeconomic Accounts (13-606-G) is available.
Contact information
For more information, or to enquire about the concepts, methods or data quality of this release, contact us (toll-free 1-800-263-1136; 514-283-8300; STATCAN.infostats-infostats.STATCAN@canada.ca) or Media Relations (613-951-4636; STATCAN.mediahotline-ligneinfomedias.STATCAN@canada.ca).
- Date modified: