Canadian Housing Statistics Program, 2019
Archived Content
Information identified as archived is provided for reference, research or recordkeeping purposes. It is not subject to the Government of Canada Web Standards and has not been altered or updated since it was archived. Please "contact us" to request a format other than those available.
Released: 2021-03-18
Today, as part of the Canadian Housing Statistics Program (CHSP), data on residential property owners in Nova Scotia, New Brunswick, Ontario and British Columbia are being released for the 2019 reference year. The data released today contribute to a better understanding of homeownership in these provinces by providing information on the characteristics of individual resident homeowners, including age, sex, family type, immigration status and income. Property characteristics are also provided for these homeowners, including assessment values, the number of properties they owned and the type of properties they occupied.
These new data reveal that owners who claimed the federal tax credit for first-time home buyers in 2019 reported a higher family income than those who claimed the same credit a year earlier. They also show the extent to which young people and lone-parent families were both underrepresented among homeowners in 2019, relative to their share of the Canadian population. Finally, these data add detail to the portrait of homeowners by shedding light on multiple-property owners and immigrant homeowners in Canada.
First-time home buyers report higher income in 2019
New homeowners can claim the home buyers' amount (HBA), a federal tax incentive program for first-time home buyers. New data from the CHSP show that HBA claimants represented less than 1% of homeowners in each of the four provinces in 2019.
The Residential Property Price Index indicated that housing prices have been rising in several key housing markets in Canada, reinforcing the challenges to homeownership for Canadians, especially those with low income. CHSP data for the 2019 reference year support this view, as the median family income of homeowners who claimed the HBA was higher than that of homeowners who claimed it a year earlier in three provinces. This trend was most pronounced in British Columbia and Ontario, where owners who claimed the HBA in 2019 had a median nominal family income over 10% higher compared with those who claimed it in 2018 (+$10,000 in both provinces). The income of homeowners who did not claim the HBA in 2019 was also higher in British Columbia (+$5,000, or +5.3%) and Ontario (+$5,000, or +5.0%) than that of homeowners who did not claim the HBA a year earlier.
New data also show that those who claimed the HBA owned lower-valued properties than those who did not in the largest census metropolitan area (CMA) of each province. This gap was largest in Vancouver, where the median assessment value of properties bought by HBA claimants was almost half (-$528,000, or -48.0%) that of non-claimants. The gap was smaller in Halifax (-$29,000, or -10.7%) and Moncton (-$28,000, or -16.3%).
Canadians younger than 35 are the least likely to be homeowners
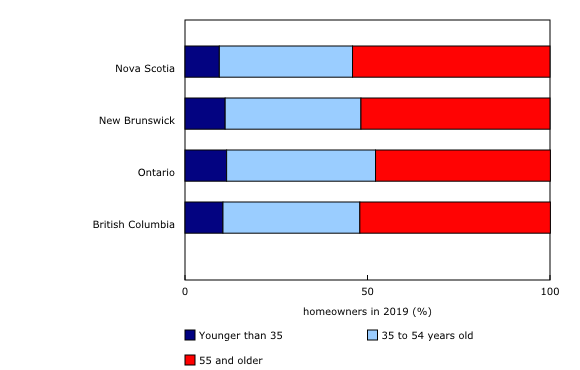
Canadians younger than 35 accounted for the smallest share of property owners by age group, ranging from 9.4% in Nova Scotia to 11.4% in Ontario in 2019. This was well below their share in the total Canadian population in 2019.
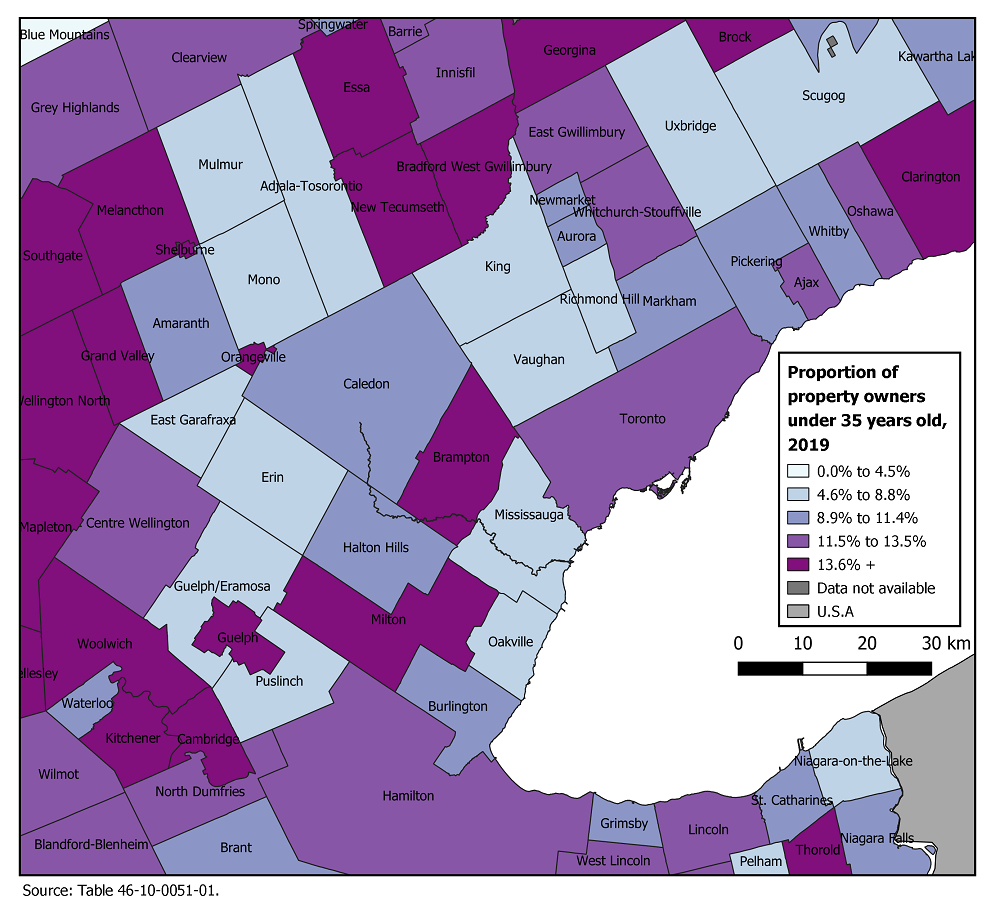
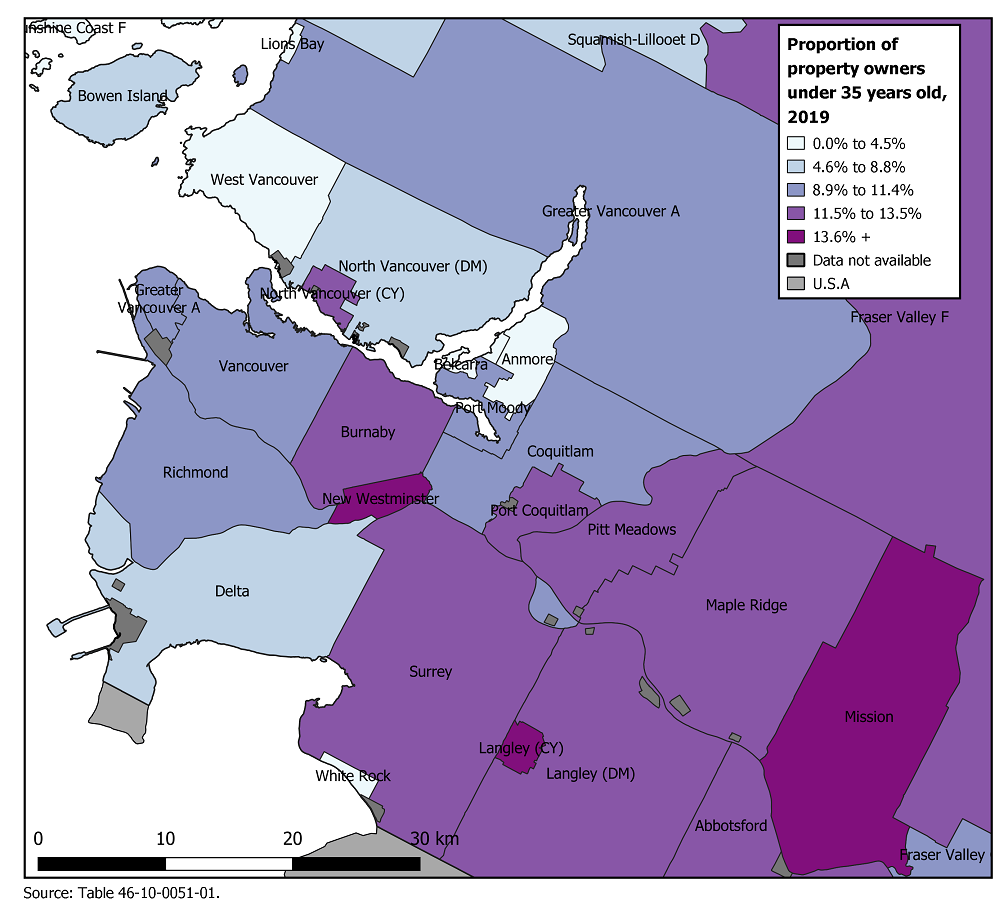
In Toronto and Vancouver, young homeowners tended to live outside the core of the CMA in 2019. In the census subdivision (CSD) of the city of Toronto, those younger than 35 accounted for 11.5% of individual homeowners in 2019. In comparison, 18.4% of homeowners in New Tecumseth and 17.3% in Bradford West Gwillimbury were younger than 35. These municipalities are located more than 50 kilometres from downtown Toronto and, as shown in the latest release from the CHSP, they saw faster housing stock growth compared with urban cores over the same period.
Those younger than 35 accounted for a larger share of homeowners in the CSD of Moncton (13.9%), albeit at a rate still below their share of the total population in the CMA.
Those younger than 35 also owned the homes with the lowest median total assessment value among all age groups in those CMAs. This was especially true in the Vancouver CMA, where they owned properties with a median assessment value $312,000 lower (-28.6%) than that of the properties of homeowners aged 35 to 54.
Lone-parent families are the least likely to be owners
Almost four in five owners were in a couple family in the four provinces studied in 2019. The share of lone-individual homeowners, referring to people not in a census family, ranged from 14.1% in Ontario to 16.6% in New Brunswick. Lone-parent families accounted for the smallest share of homeowners in British Columbia (4.1%), Ontario (4.9%), and New Brunswick and Nova Scotia (both at 5.2%).
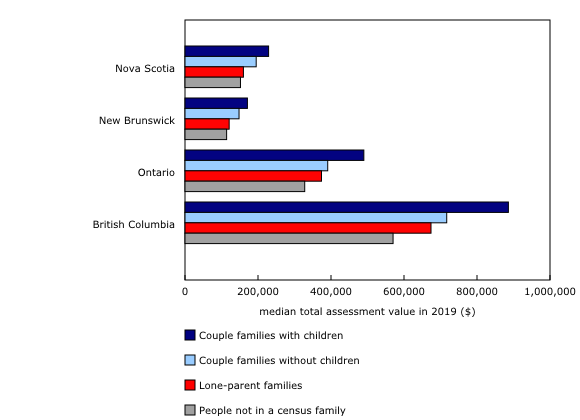
Couple families, especially those with children, owned higher-valued properties than other homeowners. Couple families with children owned properties with a median total assessment value that was at least 30% higher compared with properties owned by lone-parent families in all four provinces in 2019.
The median assessment values of properties owned by couples without children were almost one-fifth higher in Ontario (+19.2%), and over one-quarter higher in the other three provinces, than those of properties owned by lone individuals.
Approximately half of homeowners in Vancouver and Toronto are immigrants
In 2019, almost half of homeowners in Vancouver (47.1%) and over half of those in Toronto (54.3%) were immigrants. Conversely, immigrants accounted for about one-third of homeowners in Ontario and British Columbia, and a much smaller share of homeowners in Nova Scotia (6.2%) and New Brunswick (4.1%). These findings are comparable with the share of immigrants in the population, as indicated by the 2016 Census.
These new data support previous findings from the CHSP, which showed that the median assessment value of properties owned by immigrants exceeded that of properties owned by non-immigrants. In 2019, immigrants owned properties with a higher median assessment value than properties owned by non-immigrants in Moncton (+$14,000, or +8.2%), Halifax (+$60,000, or +22.9%) and Vancouver (+$80,000, or +7.6%). The lone exception was Toronto, where the median assessment value of residential properties owned by immigrants was lower than that of properties owned by non-immigrants.
These data also show that the median assessment value of properties owned by recent immigrants—defined as those who immigrated to Canada from 2009 to 2019—was lower than that of properties owned by those who immigrated earlier.
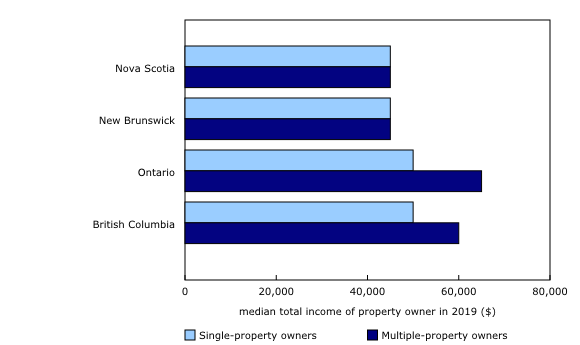
No differences in median income between multiple- and single-property owners in Nova Scotia and New Brunswick
In 2019, multiple-property ownership was more prevalent in Nova Scotia (23.4% of homeowners) and New Brunswick (20.3%) than in British Columbia (15.6%) and Ontario (15.5%).
Multiple-property owners in British Columbia (+20%) and Ontario (+30%) had higher median income compared with single-property owners in these provinces. Conversely, there were no major differences in median income between single- and multiple-property owners in Nova Scotia and New Brunswick.
Multiple-property owners in New Brunswick held properties with a median total assessment value over one-third (+37.1%) higher than that of the properties of single-property owners, while, in Nova Scotia, multiple-property owners held properties with an assessment value 48.1% higher. In Ontario (+114.4%) and British Columbia (+132.7%), the median total assessment value of the properties of multiple-property owners was over twice that of the properties of single-property owners.
Note to readers
The universe of this release is restricted to individual resident owners who occupy a residential property.
Homeowners in the Canadian Housing Statistics Program (CHSP) data for the 2019 reference year are linked to tax data from the T1 Family File (T1FF) for the tax year 2018. Similarly, homeowners in the 2018 reference year are linked to the T1FF for the tax year 2017. Data in the T1FF include all individuals who filed an individual T1 tax return, combined with other administrative files received from the Canada Revenue Agency. A property may have more than one owner, and an owner may have more than one property; thus, the counts of owners and properties can differ.
This release uses the concept of total income, which is the sum of market income and government transfers, in current dollars. Market income includes employment income, investment income, private retirement income and other income from market sources. Government transfers refer to all cash benefits received from federal, provincial, territorial or municipal governments. Total family income refers to the sum of the total income of all members of the family.
Claimants of the home buyers' amount are individuals who claimed the amount ($5,000) in their federal income tax return form for the taxation year in which the home was acquired. According to the Canada Revenue Agency rules, the claimant and their spouse must not have lived in another home they owned during the preceding four years and must intend to occupy their new home within one year of purchasing it.
The concept of family type is derived from the T1FF. Couple families with children include children in the family unit, without restriction on age.
In this release, people who own multiple residential properties are those whose name is on the property title of more than one residential property within a given province. For the purposes of this release, people who own one property in a given province and a second property in another province are not included among multiple-property owners at this time. After the CHSP has integrated information from all provinces and territories, this concept will be updated to take into account people who own properties in more than one province.
Demographic analysis of individual resident owners, including birth year and sex, considers only the population for which demographic information is known and excludes unspecified values when calculating shares so that total shares equal 100%.
Geographical boundaries
The CHSP disseminates data based on the geographical boundaries from the Standard Geographical Classification 2016.
Definitions
Assessment value refers to the assessed value of the property for the purpose of determining property taxes. Total assessment value represents the sum of the assessment values of all residential properties owned by an owner within a given province. In Ontario, assessment values for properties built since the last assessment year (2016) are suppressed. The reference years of the assessment values by province or territory are available here.
The core of a geographic area, for the purposes of this release, refers to the census subdivision within a census metropolitan area (CMA) with the highest number of residential properties.
The largest CMA refers to the most populated CMA in each province, based on the population from the 2016 Census.
Total income includes income reported by taxfilers from any of the following sources: employment income; dividends and interests; government transfers (including non-taxable income); private pensions; registered retirement savings plans; and other income such as net limited partnership income, rental net income, alimony, registered disability savings plans and other income (line 130 of the T1 form). It excludes veterans' disability and dependant pensioners' payments, war veterans' allowances, lottery winnings, and capital gains.
Contact information
For more information, or to enquire about the concepts, methods or data quality of this release, contact us (toll-free 1-800-263-1136; 514-283-8300; STATCAN.infostats-infostats.STATCAN@canada.ca) or Media Relations (613-951-4636; STATCAN.mediahotline-ligneinfomedias.STATCAN@canada.ca).
- Date modified:


