Price trends in key Canadian housing markets, third quarter 2019
Archived Content
Information identified as archived is provided for reference, research or recordkeeping purposes. It is not subject to the Government of Canada Web Standards and has not been altered or updated since it was archived. Please "contact us" to request a format other than those available.
Released: 2019-11-14
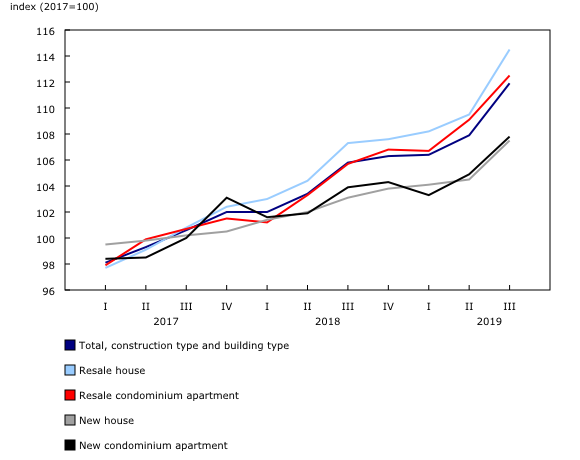
Today, Statistics Canada is introducing the new Residential Property Price Index (RPPI) that can be used to track the change in the average price of homes in six select census metropolitan areas (CMAs). According to this measure, while residential property prices have risen by 9.2% from the first quarter of 2017 to the third quarter of 2019, with much of the increase occurring prior to the second quarter of 2018.
The RPPI is composed of the New Housing Price Index, the New Condominium Apartment Price Index, and the Resale Residential Property Price Index which is being published for the first time with this release. Users can access the RPPI through the new interactive Residential Property Price Index Data Visualization Tool.
The Resale Residential Property Price Index measures changes over time in the resale prices of residential properties in Montréal, Ottawa, Toronto, Calgary, Vancouver and Victoria, as well as an aggregate of these six CMAs. Resales account for about two-thirds of the value of total housing sales each year.
Since the first quarter of 2017, prices for new properties (+6.4%) rose at a slower pace than the prices for resale properties (+10.5%). In both the new and resale markets in the six CMA composite, condominium apartment prices (+18.9%) rose at a much faster pace than house prices (+5.8%).
Toronto residential property prices have cooled, despite a robust condominium market
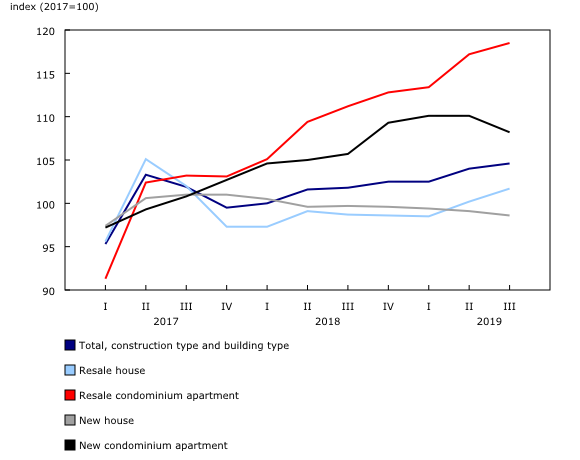
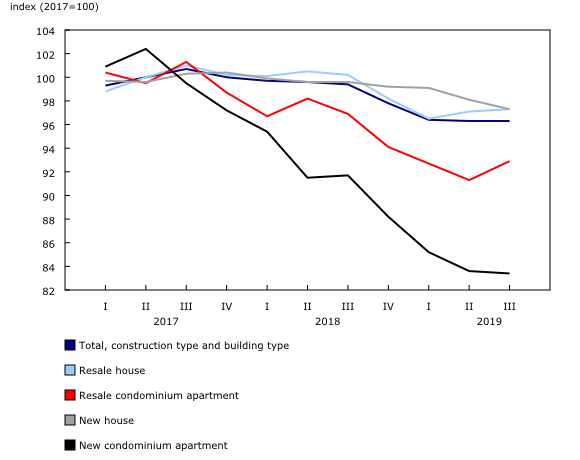
Residential property prices in Toronto have increased 9.8% from the first quarter of 2017 to the third quarter of 2019. However, resale prices for condominium apartments (+29.8%) have risen by almost one-third—the largest price increase in the CMA over this period.
Excluding new condominium apartments, most of the residential property price increase in Toronto occurred in the second quarter of 2017, when the RPPI rose 8.4%. From the third quarter of 2017 to the third quarter of 2019, residential property prices in Toronto have increased 1.6%. The Ontario Fair Housing Plan, put into place in April 2017, may have been a factor.
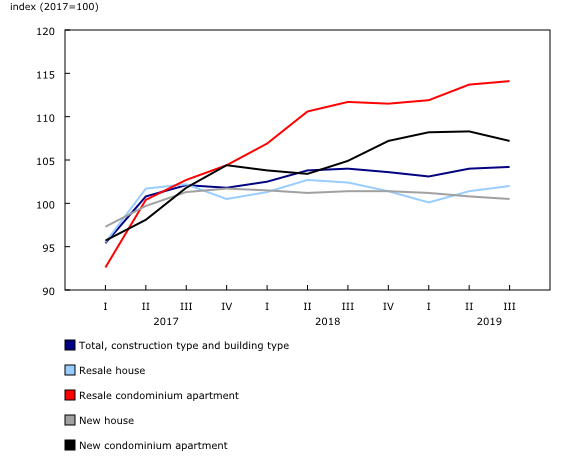
Residential property prices in Ottawa have risen 18.4% since the first quarter of 2017. The most rapid growth (+3.9%) took place in the second quarter of 2019, driven by both the resale house (+4.8%) and new condominium apartment (+8.9%) markets.
Residential property prices in Vancouver are down from a year earlier
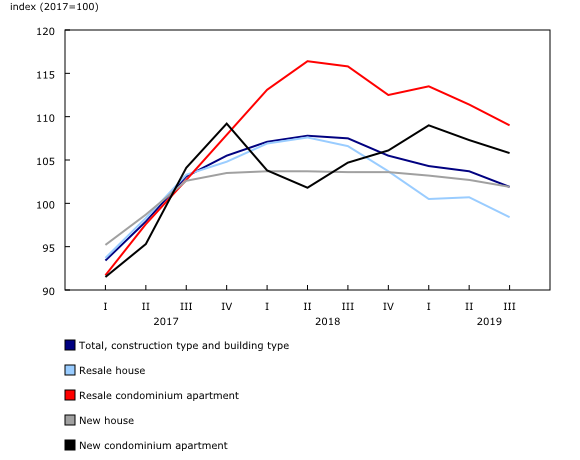
Vancouver residential property prices rose 9.1% from the first quarter of 2017 to the third quarter of 2019, led by an 18.9% increase in resale condominium apartment prices. However, the Vancouver market has cooled since the second quarter of 2018, with prices falling by 5.5%. Cooling measures, such as increased mortgage interest rates and the Foreign Buyer's tax, may have contributed to the recent declines in property prices.
Property owners in Victoria paid 14.3% more for residential properties in the third quarter of 2019 compared with the first quarter of 2017. New condominium apartment prices in Victoria have risen by 35.2% over this period, the largest growth nationally.
New condominium apartment prices in Calgary have fallen by almost one-fifth
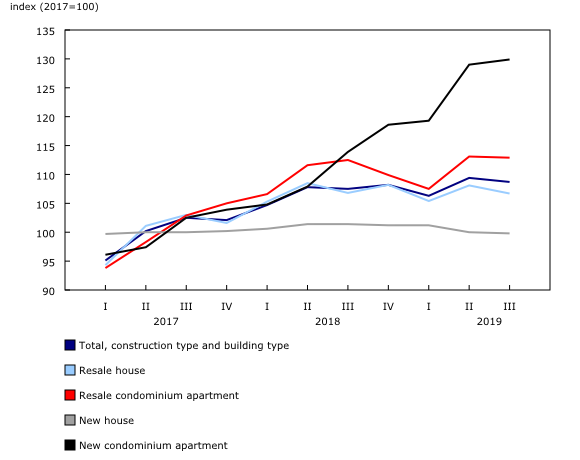
Residential property prices in Calgary fell by 3.0% from the first quarter of 2017 to the third quarter of 2019, led by sharply lower new condominium prices.
In Calgary, new condominium apartment prices have fallen by almost one-fifth (-17.3%) from the first quarter of 2017 to the third quarter of 2019, bringing condominium prices in the CMA down 14.1%. The decline was attributable to the oversupply of condominium apartments in Calgary. Meanwhile, resale condominium apartment prices in Calgary declined by 7.5%.
Resales contribute to higher residential property prices in Montréal
Montréal residential property prices increased 14.1% from the first quarter of 2017 to the third quarter of 2019, with the resale homes contributing the most (+17.2%) to this growth.
Note to readers
The Residential Property Price Index (RPPI) measures the change over time in the selling price of residential properties. It provides a comprehensive portrait of the residential real estate market as it covers both the new and resale markets for house and condominium apartment properties in each of the census metropolitan areas (CMAs) of Montréal, Ottawa, Toronto, Calgary, Vancouver, Victoria, as well as for the six CMA composite. The RPPI is a quarterly index, starting in the first quarter of 2017, is subject to a one quarter revision and is not seasonally adjusted.
Products
Statistics Canada has a new Residential Property Price Index Data Visualization Tool. This interactive dashboard provides access to current and historical data for the RPPI, and its sub-components (new and resale houses and condominium apartments) for the CMAs of Montréal, Ottawa, Toronto, Calgary, Vancouver, Victoria and for a six CMA composite, in a dynamic and customizable format.
The infographic 'A First Complete Look at Residential Property Prices,' part of the series Statistics Canada – Infographics (11-627-M), includes key statistics and shows market trends in the residential real estate market.
The Residential Property Price Index (RPPI) Methodology is now available. This document provides details on the methodology used to calculate the New Housing Price Index, the New Condominium Apartment Price Index, and the Resale Residential Property Price Index, and how these indices are compiled to form the RPPI.
For more information on the topic of housing, visit the new Housing Statistics Portal.
Statistics Canada has launched the Producer Price Indexes Portal as part of a suite of portals for prices and price indexes. This webpage provides Canadians with a single point of access to a wide variety of statistics and measures related to producer prices. The portal offers an array of information on topics such as manufacturing, construction, professional services, distributive trades and financial services. The portal will be continually updated as new information becomes available.
The video "Producer Price Indexes" is available on the Statistics Canada Training Institute webpage. It provides an introduction to Statistics Canada's Producer Price Indexes—what they are, how they are made and what they are used for.
Next RPPI release
The Residential Property Price Index for the fourth quarter of 2019 will be released on January 29, 2020.
Contact information
For more information, or to enquire about the concepts, methods or data quality of this release, contact us (toll-free 1-800-263-1136; 514-283-8300; STATCAN.infostats-infostats.STATCAN@canada.ca) or Media Relations (613-951-4636; STATCAN.mediahotline-ligneinfomedias.STATCAN@canada.ca).
- Date modified:


