
Annual civil aviation statistics, 2019

Archived Content
Information identified as archived is provided for reference, research or recordkeeping purposes. It is not subject to the Government of Canada Web Standards and has not been altered or updated since it was archived. Please "contact us" to request a format other than those available.
Released: 2021-03-16
Highlights
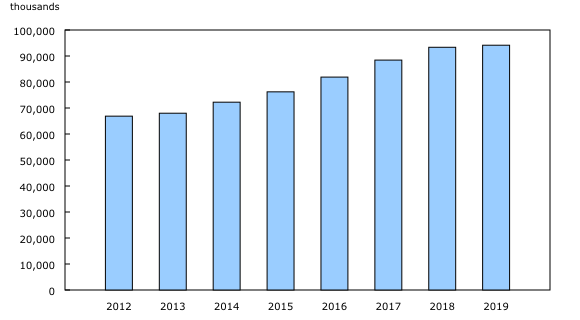
Canadian air carriers transported 94.1 million passengers in 2019, up 0.8% from the previous year. The growth in passengers was the 10th consecutive increase in traffic following the economic downturn in 2009.
With upward pressure on prices, operating revenue earned by Level I to III air carriers in 2019 rose 5.4% to $29.5 billion. Net operating income increased 18.3% to $2.2 billion in 2019, bouncing back from an 18.9% decrease in 2018.
Net operating income bounces back on the strength of passenger revenue
In 2019, profits grew in the airline industry as net operating income increased by $334.7 million, rebounding from a $425.7 million decline in 2018. Total operating revenue rose 5.4% from a year earlier to a record $29.5 billion in 2019. On the other side of the ledger, total operating expenses increased 4.5% to $27.3 billion, resulting in an operating profit margin—net operating income divided by operating revenue—of 7.3%.
Passenger revenue accounted for 87.3% of total operating revenue in 2019, down from 88.2% in 2018. The increase in total operating revenue was mainly driven by a 0.8% growth in passenger traffic and a 2.1% increase in yield (passenger revenue per passenger-kilometre). The higher yield in 2019 stemmed mainly from limited capacity as a result of the grounding of all Boeing 737 MAX aircraft that began in mid-March, as well as from upward pressure on prices. According to the Consumer Price Index, prices for air transportation were 5.7% higher in 2019 than in 2018. Revenue earned from passenger transportation grew in most provinces and territories, with the largest gains in Ontario (+$230.2 million), followed by Alberta (+$184.9 million) and Quebec (+$138.6 million).
Lower turbo fuel costs moderate the growth in operating expenses
The 4.5% increase in operating expenses in 2019 reflected growth in most of their major components. Depreciation (+44.7%) posted the largest gain relative to 2018, followed by all other operating expenses (+8.5%) and maintenance (+1.7%). Lower spending on aircraft operations (-4.4%), largely because of lower turbo fuel costs, moderated the rise. Canadian Level I to III air carriers consumed 8.8 billion litres of turbo fuel in 2019 and spent $6.8 billion to purchase the fuel. The decrease in these costs was partly related to a reduction in jet fuel prices (-3.9%), as reported in the Industrial Product Price Index from January to December. Fuel costs accounted for 24.9% of total operating expenses, down from 26.6% in 2018.
In 2019, 92.7 cents of each operating revenue dollar were used to cover operating expenses. Aircraft operations accounted for the largest portion of each dollar spent, at 42.4 cents, followed by all other operating expenses (34.6 cents), including general administration, and by maintenance (12.2 cents).
Chart 1

Turbo fuel consumption and expenses, Canadian air carriers

Total employment in the air transportation industry rose 5.6% to 70,023, and airlines paid $5.1 billion (+6.3%) in wages and salaries. In 2019, nearly 19% of the industry's total operating expenses were payments made to employees. Total wages and salaries were up in most provinces.
In 2019, operating revenue per employee edged down 0.3% from the previous year to $421,022, as labour productivity—measured by tonne-kilometres (both cargo and passenger flights) per employee—declined to 379,500 tonne-kilometres, down 3.9% from 2018.
Total assets of Canadian Level I to III air carriers stood at $38.0 billion in 2019, up 20.9% compared with 2018.
Passenger numbers continue to rise but growth slows
Canadian Level I to III air carriers reported 94.1 million passengers in 2019, an all-time high, up 0.8% from 2018 and continuing the upward trend that began in 2010. The number of passengers on scheduled flights rose 0.9% to 91.3 million in 2019, while the number of passengers on chartered flights was relatively flat, up 0.4% to 2.9 million.
Chart 2
Passengers carried, Canadian air carriers
Domestic traffic (within Canada) edged up 0.2% to 48.8 million passengers, while international traffic grew 1.5% to 45.4 million passengers—both smaller increases than in 2018. The slowdown in total international traffic growth reflected a 4.1% gain in other international traffic, which was partly offset by a 1.6% decrease in transborder traffic (between Canada and the United States). These results are consistent with the findings from the 2019 National Travel Survey, which revealed that the number of trips to overseas countries by Canadian residents rose 4.0% from 2018, while trips to the United States were down 2.3%.
Canadian Level I to III air carriers recorded 233.2 billion passenger-kilometres flown in their scheduled and charter operations in 2019, up 2.2% from the previous year, with scheduled services accounting for almost all (99.0%) of the passenger-kilometres. On average, each passenger travelled 2,477 kilometres, up 1.4% compared with 2018. In 2019, the average trip length in the domestic sector was 1,239 kilometres, compared with 3,808 kilometres in the international sector.
This release covers a period just before the beginning of the COVID-19 pandemic and will serve as an important benchmark to measure the full effect of the pandemic on the Canadian airline industry. More recent operational and financial data are available with the monthly and quarterly civil aviation statistics.
Note to readers
This release covers Canadian Level I, II and III air carriers.
Level I air carriers include every Canadian air carrier that, in the calendar year before the year in which information is provided, transported at least 2 million revenue passengers or at least 400 000 tonnes of cargo.
Level II air carriers include every Canadian air carrier that, in the calendar year before the year in which information is provided, transported (a)at least 100,000, but fewer than 2 million, revenue passengers, or (b) at least 50 000 tonnes, but less than 400 000 tonnes, of cargo.
Level III air carriers include every Canadian air carrier that (a) is not a Level I or II air carrier, and (b) in the calendar year before the year in which information is provided, realized gross revenues of at least $2 million for the provision of air services for which the air carrier held a licence.
Net non-operating income and loss are from commercial ventures that are not part of air transportation services, from other revenue and expenses attributable to financing or other activities that are not an integral part of air transportation, and from special recurrent items of a non-periodic nature. Non-operating income can be, for example, capital gains from the sale of aircraft, interest income and foreign exchange adjustment, while non-operating loss can include capital losses and interest on bank loans and other debt.
The average passenger trip length is calculated by dividing the number of passenger-kilometres by the number of passengers. Trips across Canada and the world are included in this calculation.
Data for 2016 to 2018 have been revised.
Because of rounding, components may not add up to the total.
Contact information
For more information, or to enquire about the concepts, methods or data quality of this release, contact us (toll-free 1-800-263-1136; 514-283-8300; STATCAN.infostats-infostats.STATCAN@canada.ca) or Media Relations (613-951-4636; STATCAN.mediahotline-ligneinfomedias.STATCAN@canada.ca).
- Date modified: